-
-
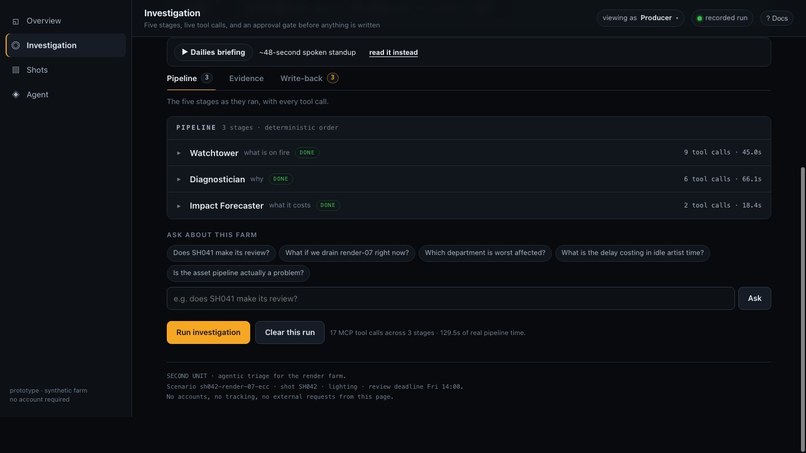
Investigation dashboard
-
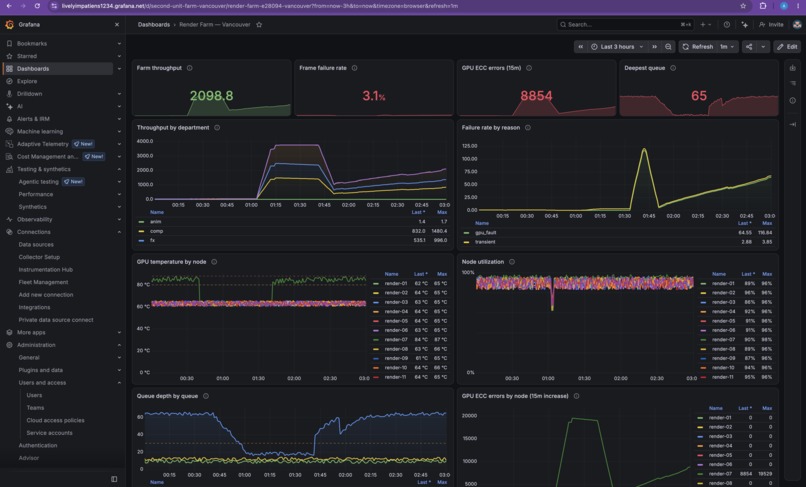
Dashboards Render Farm — Vancouver
-
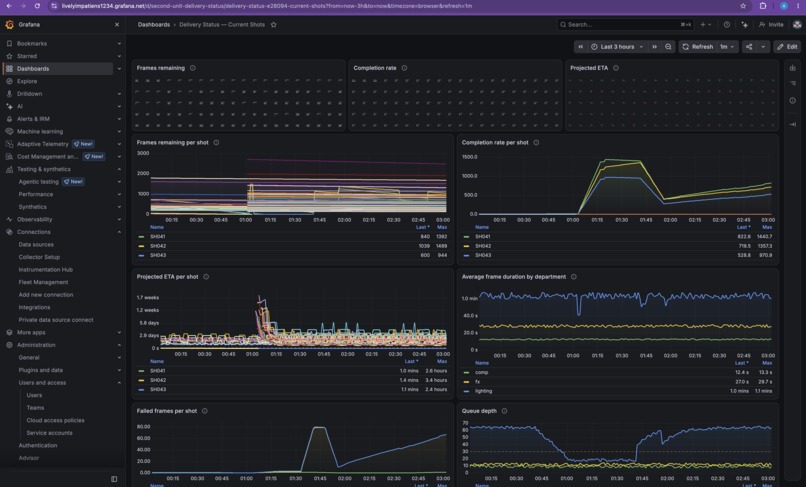
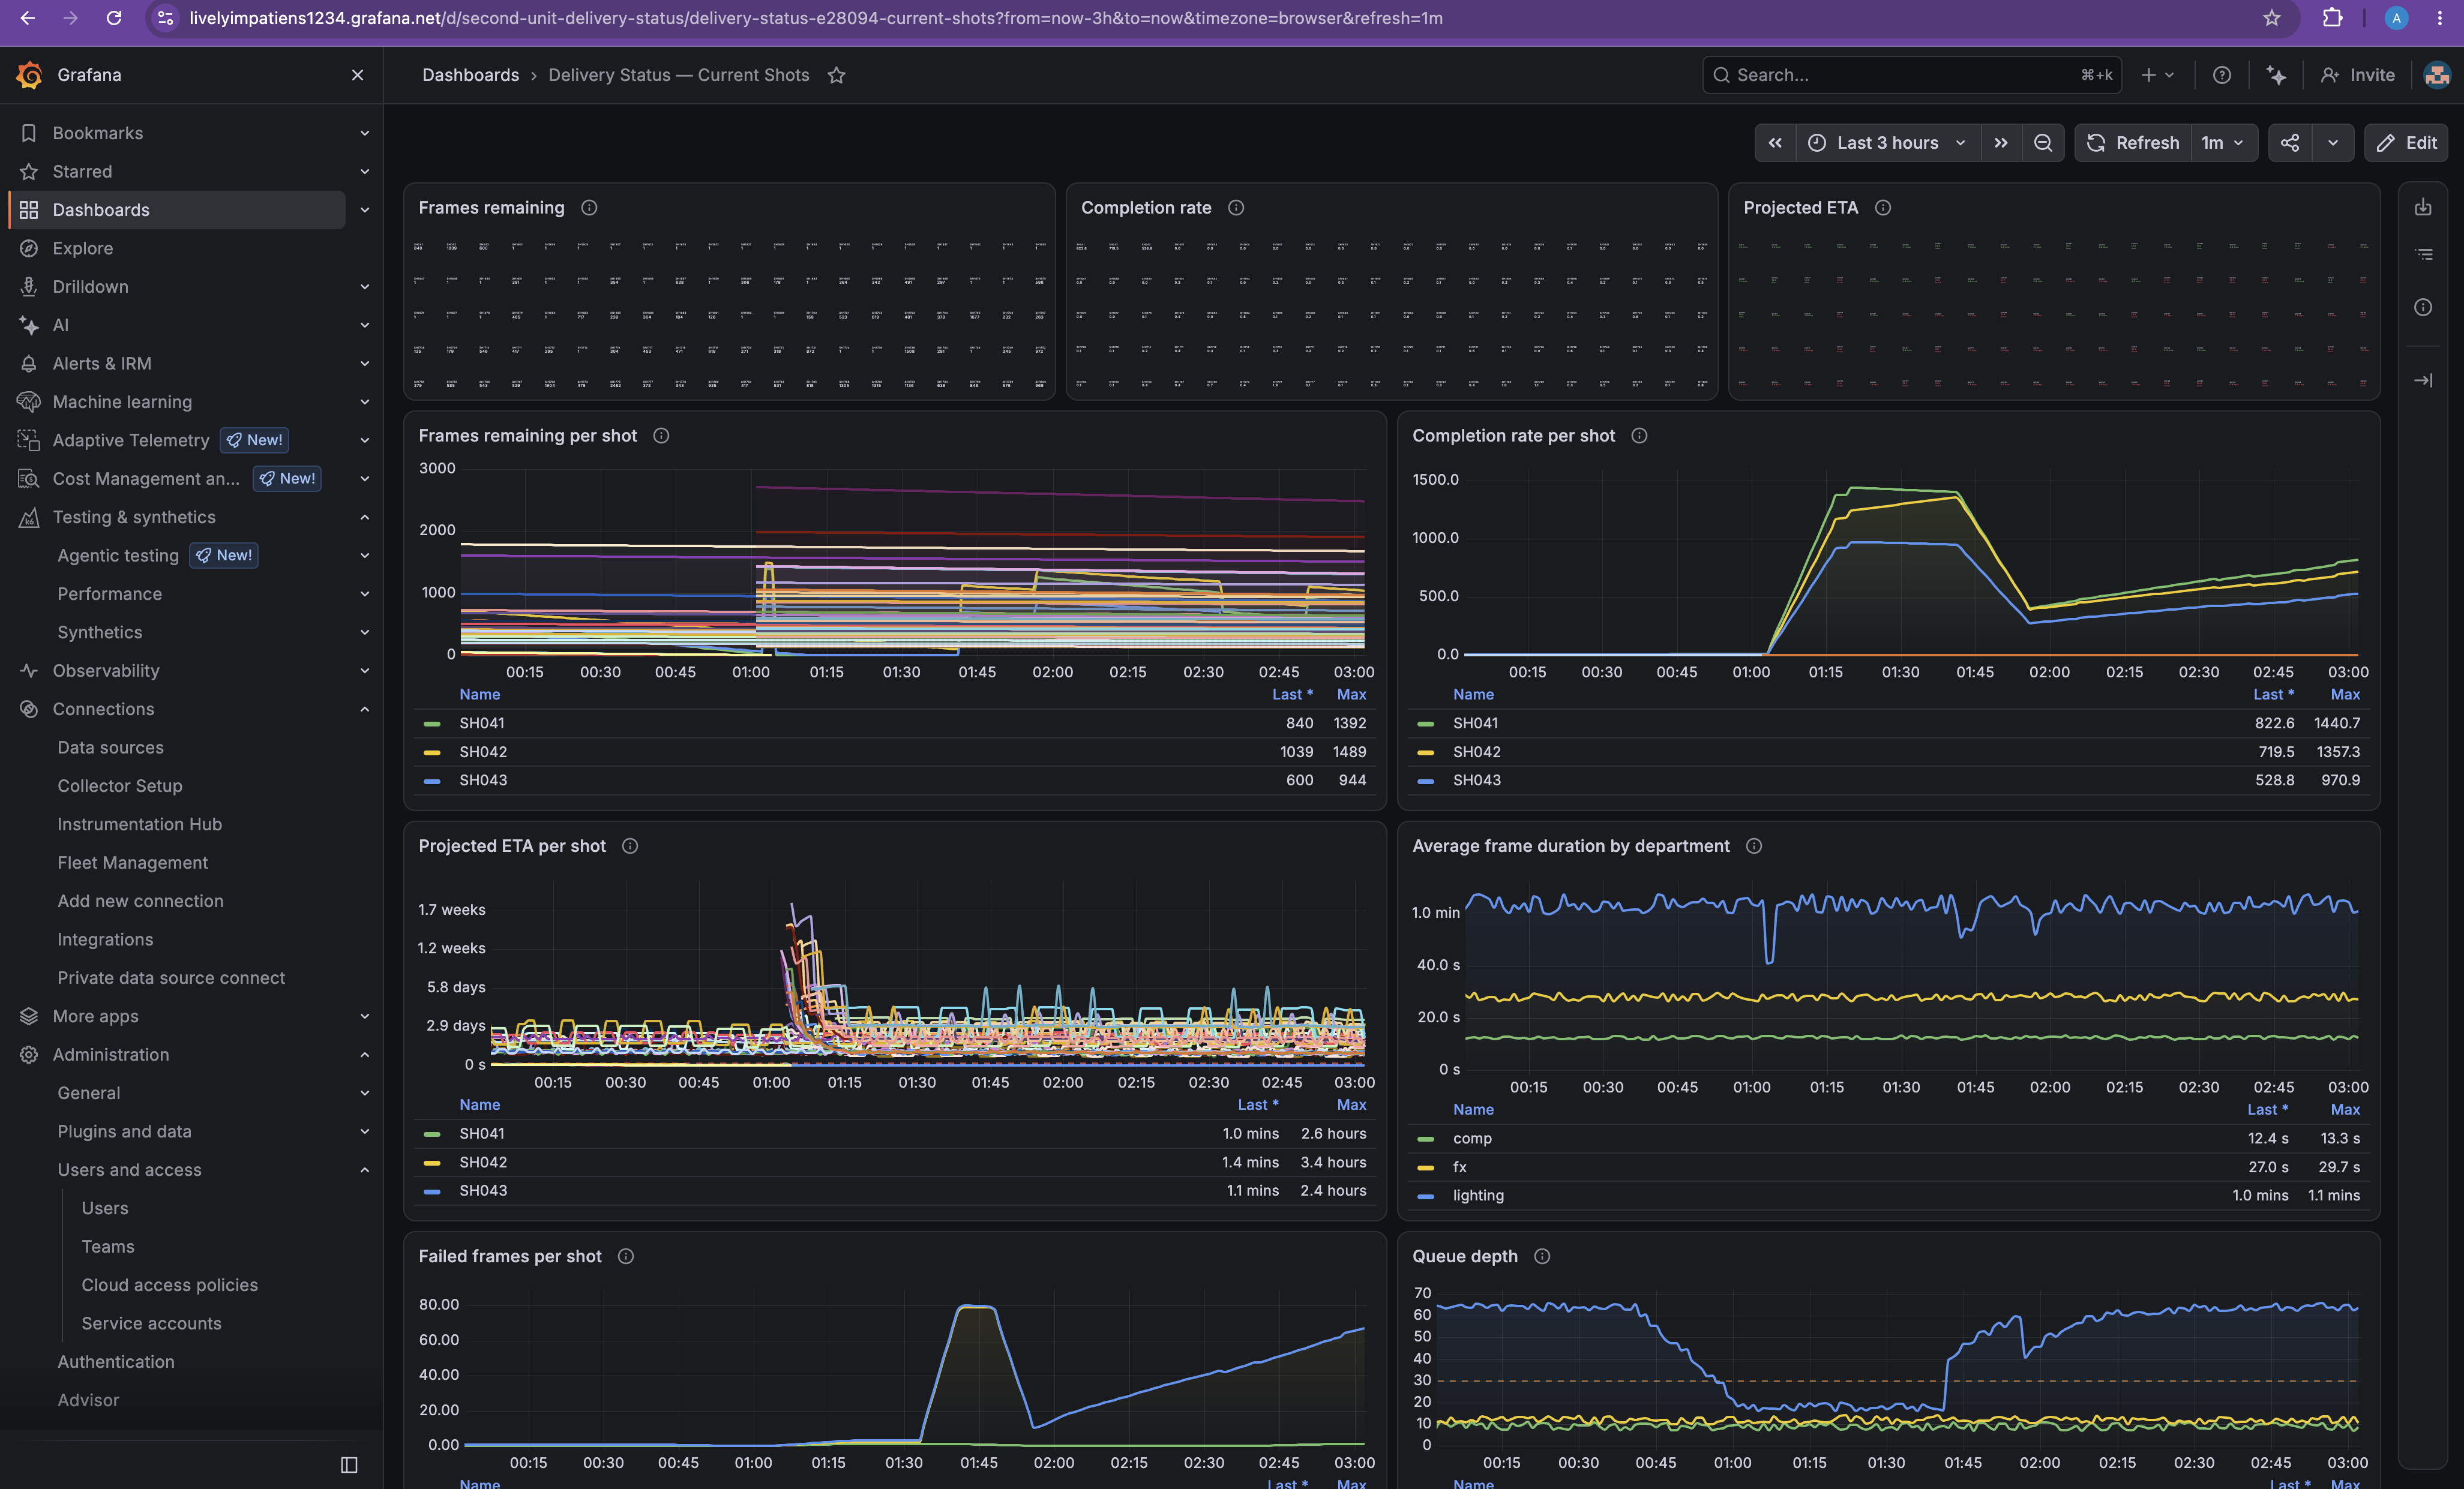
Delivery Status — Current Shots dashboard
-
-
-
Inspiration
A visual effects house lives and dies by the client review date. Between a shot leaving an artist's hands and landing in review, it passes through a render farm: hundreds of nodes chewing through frames, licence servers, asset caches, queue managers. When something in that chain degrades, the telemetry is already sitting in Grafana. Nobody who needs it can read it.
The VFX supervisor doesn't open dashboards. The producer doesn't write PromQL. So the failure mode is social, not technical: a coordinator notices a queue looks slow, asks a pipeline TD, who digs through metrics between other jobs, and four hours later somebody says "we're going to miss Friday." By then artists have been idle half a day and the overtime is already booked.
The data was never missing. What's missing is the translation layer between infrastructure telemetry and production decisions. That is an agent-shaped problem.
What it does
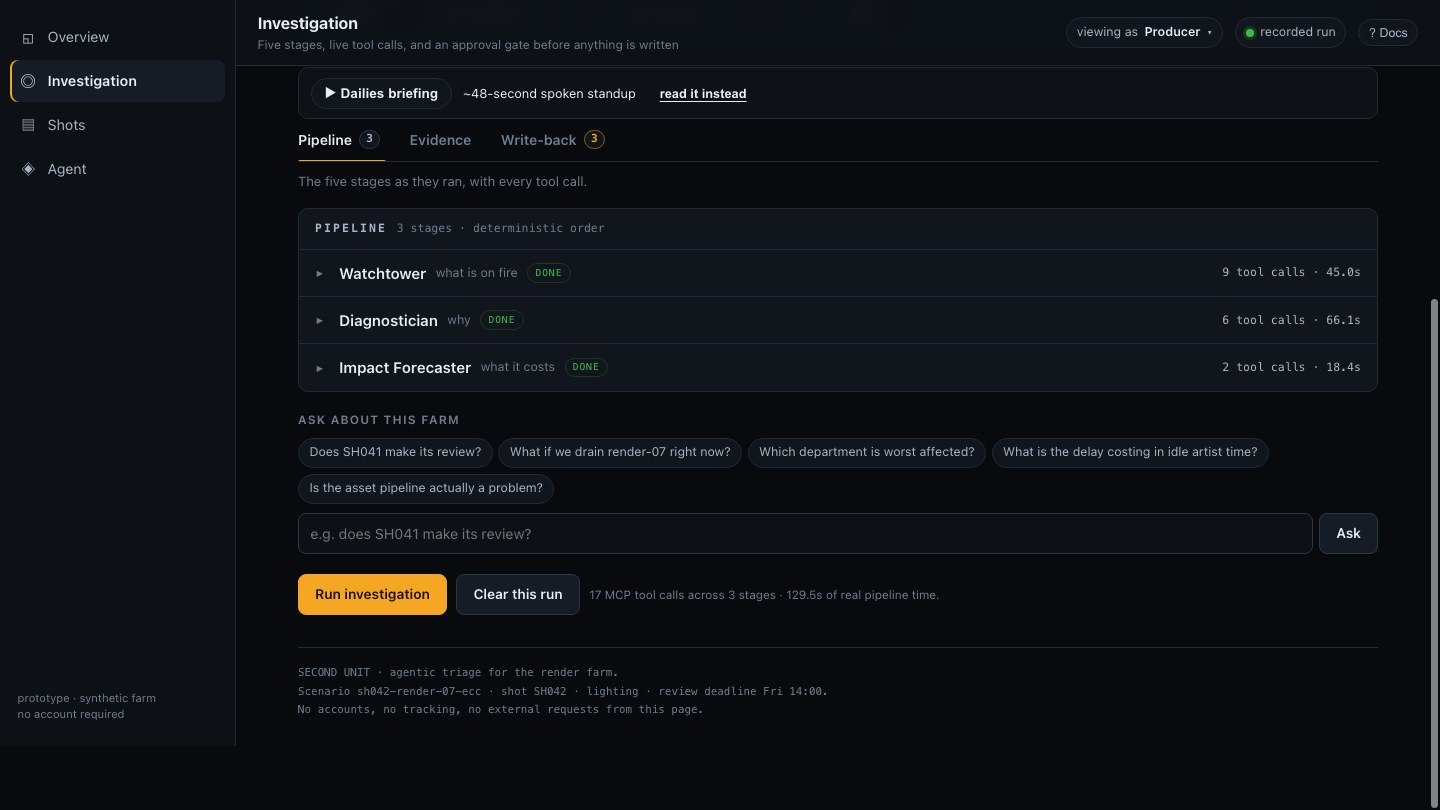
Second Unit is a crew of Gemini agents that runs the triage a pipeline TD would run, in one pass, and reports in production language instead of infrastructure language.
- Watchtower picks up firing alerts and recent error logs from the studio's Grafana stack.
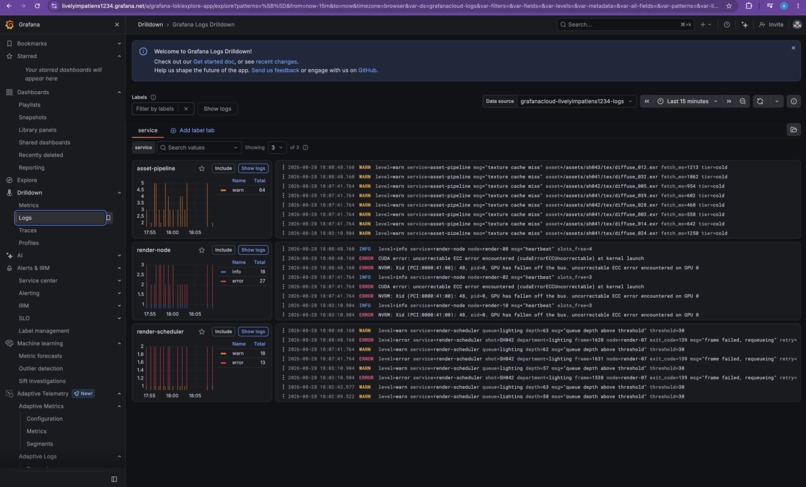
- Diagnostician correlates them, PromQL across render-node metrics, log patterns in Loki, traces on the job-submission service, and names a probable cause.
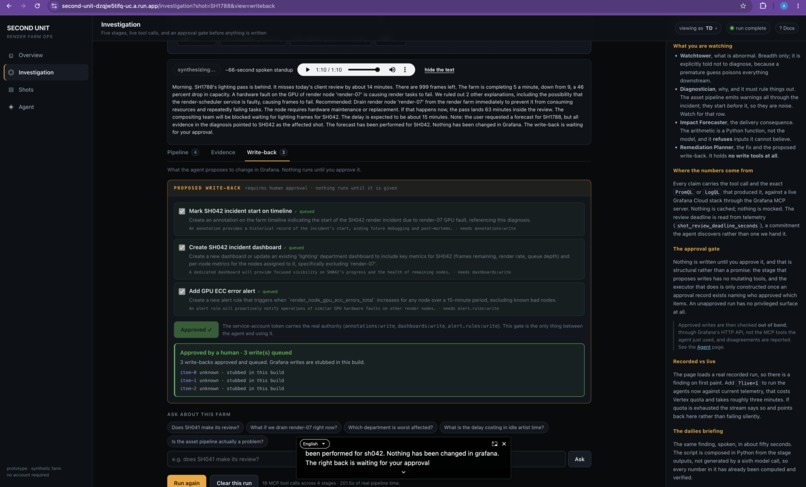
- Impact Forecaster does the step that matters. It reasons over queue depth, throughput and frames remaining and produces a sentence a producer can act on: "SH042's lighting pass slips 2.3 hours past the client review; capacity is down 46% and three artists go idle from 08:00."
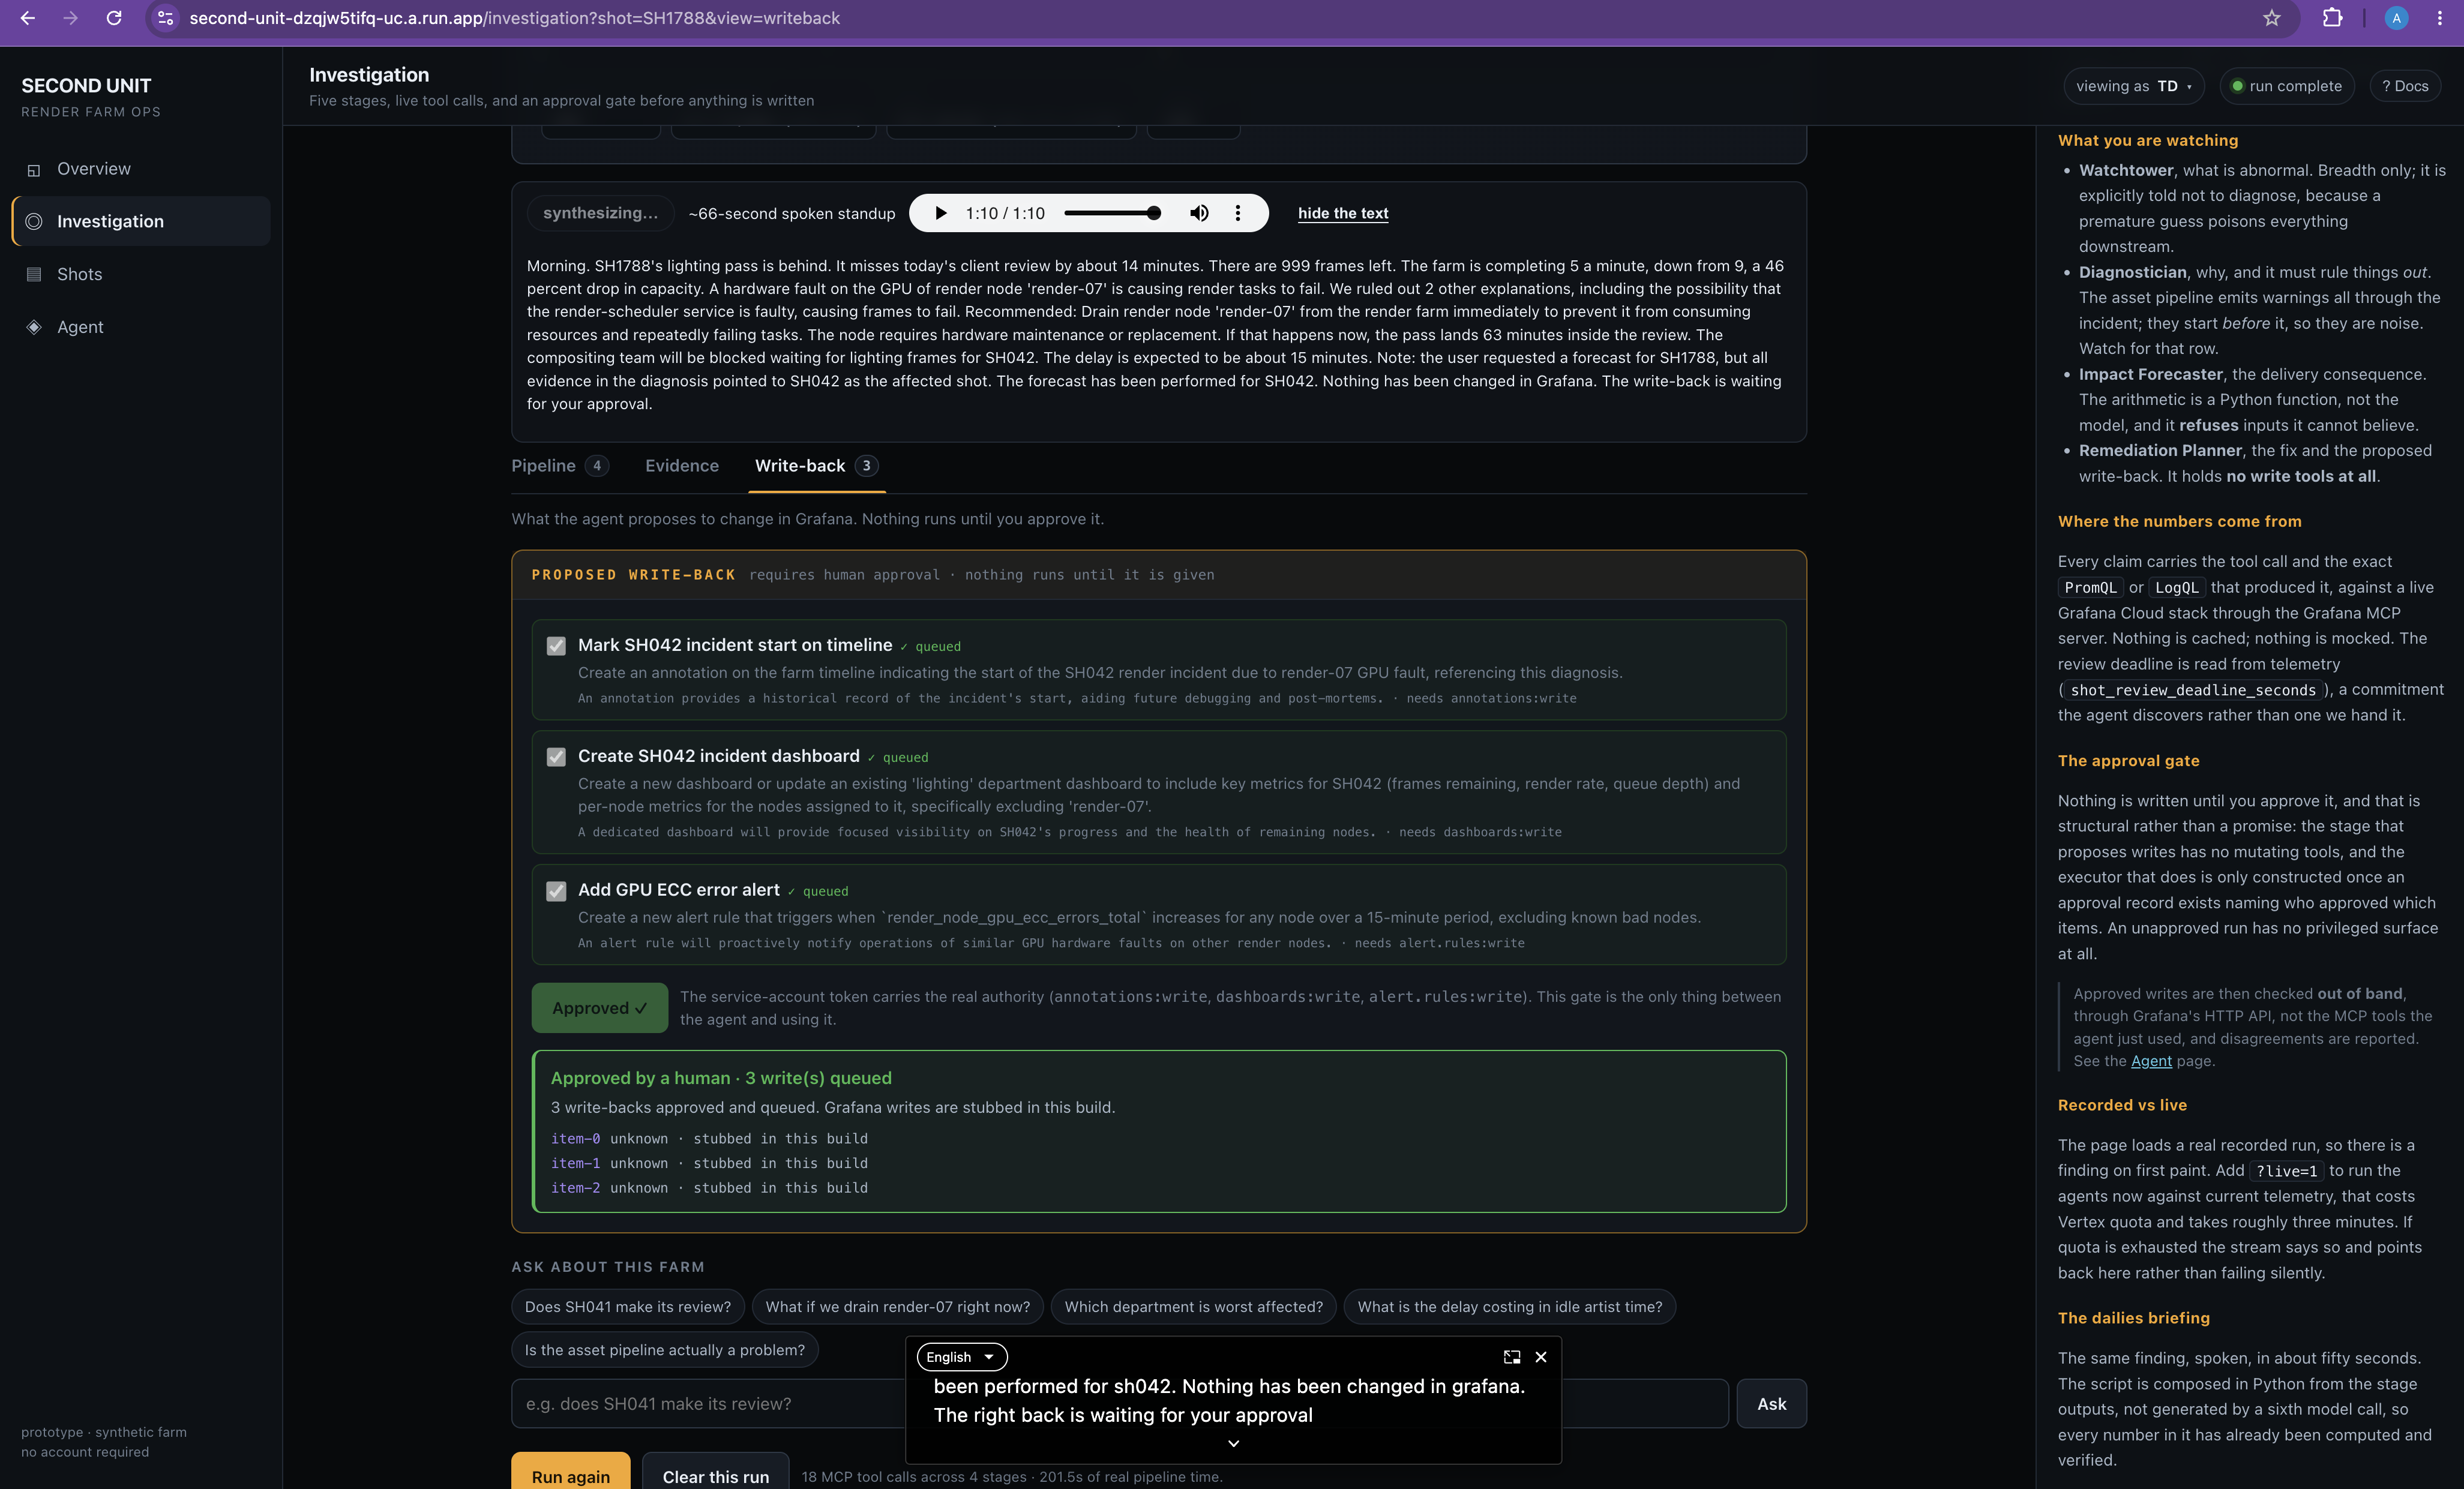
- Remediator proposes the fix and writes it back through MCP: a focused incident dashboard, an alert rule so the same failure is caught earlier next time, an annotation on the timeline. Every write sits behind an approval gate the model is forced to call before any mutating tool runs. Nothing changes in the studio's observability stack without a human saying yes.
- Dailies Briefing renders the whole thing as a spoken standup, about fifty seconds, so the crew gets it in the morning without opening anything. A VFX morning is a stand-up, not a dashboard review, and the whole point of this project is that a finding has to arrive in the form its recipient already uses. The script is composed in Python from the typed stage outputs rather than by another model call: every number in it has already been computed and verified, and re-narrating them would only add a new way to be subtly wrong on the one artefact nobody fact-checks because it sounds authoritative.
The console around it is five pages, because an operator console answers four questions in order: what needs me (Overview, a fleet sweep across every shot in flight, computed with no model at all, so it cannot hallucinate a shot), why and what do I do (Investigation), where does my work stand (Shots, against each pass's published review deadline), and do I trust what told me (Agent, per-stage cost, token usage, and write-claim verification). The fifth surface is a contextual documentation drawer on every page, the pattern the Google Cloud console uses, because "what am I looking at?" should not cost a navigation. Choosing a role is a viewing lens on /start, not a login, there are no accounts and nothing to sign into, so a judge is never blocked.
The pipeline is deterministic: fixed stages, structured handoffs, no free-text passing between agents. The model decides what it finds, not what happens next.
How I built it
Google Cloud. The agents are built on the Agent Development Kit as a multi-agent graph with explicit sequencing, running Gemini on Vertex AI. Stage boundaries use structured output; the approval gate uses forced function calling, so the model cannot reach a write tool without first calling request_human_approval. The backend deploys to Agent Engine, the operator UI to Cloud Run, and the Grafana credential lives in Secret Manager, never in the repo. Gemini TTS renders the dailies briefing. Safety settings are configured explicitly rather than left default.
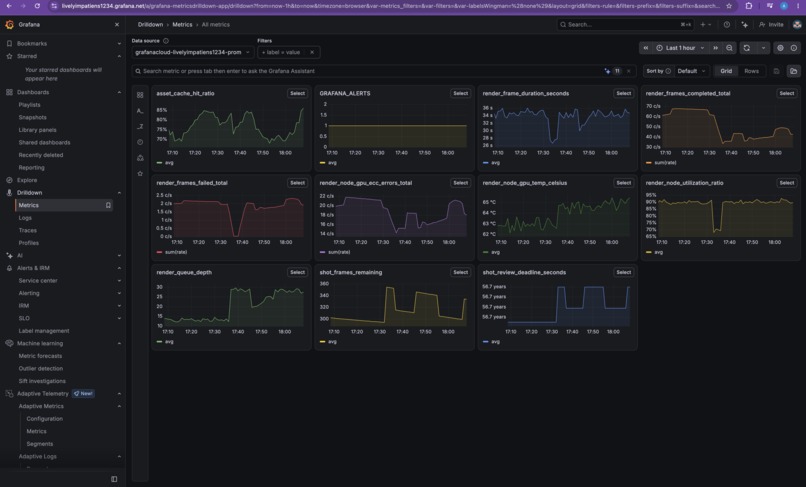
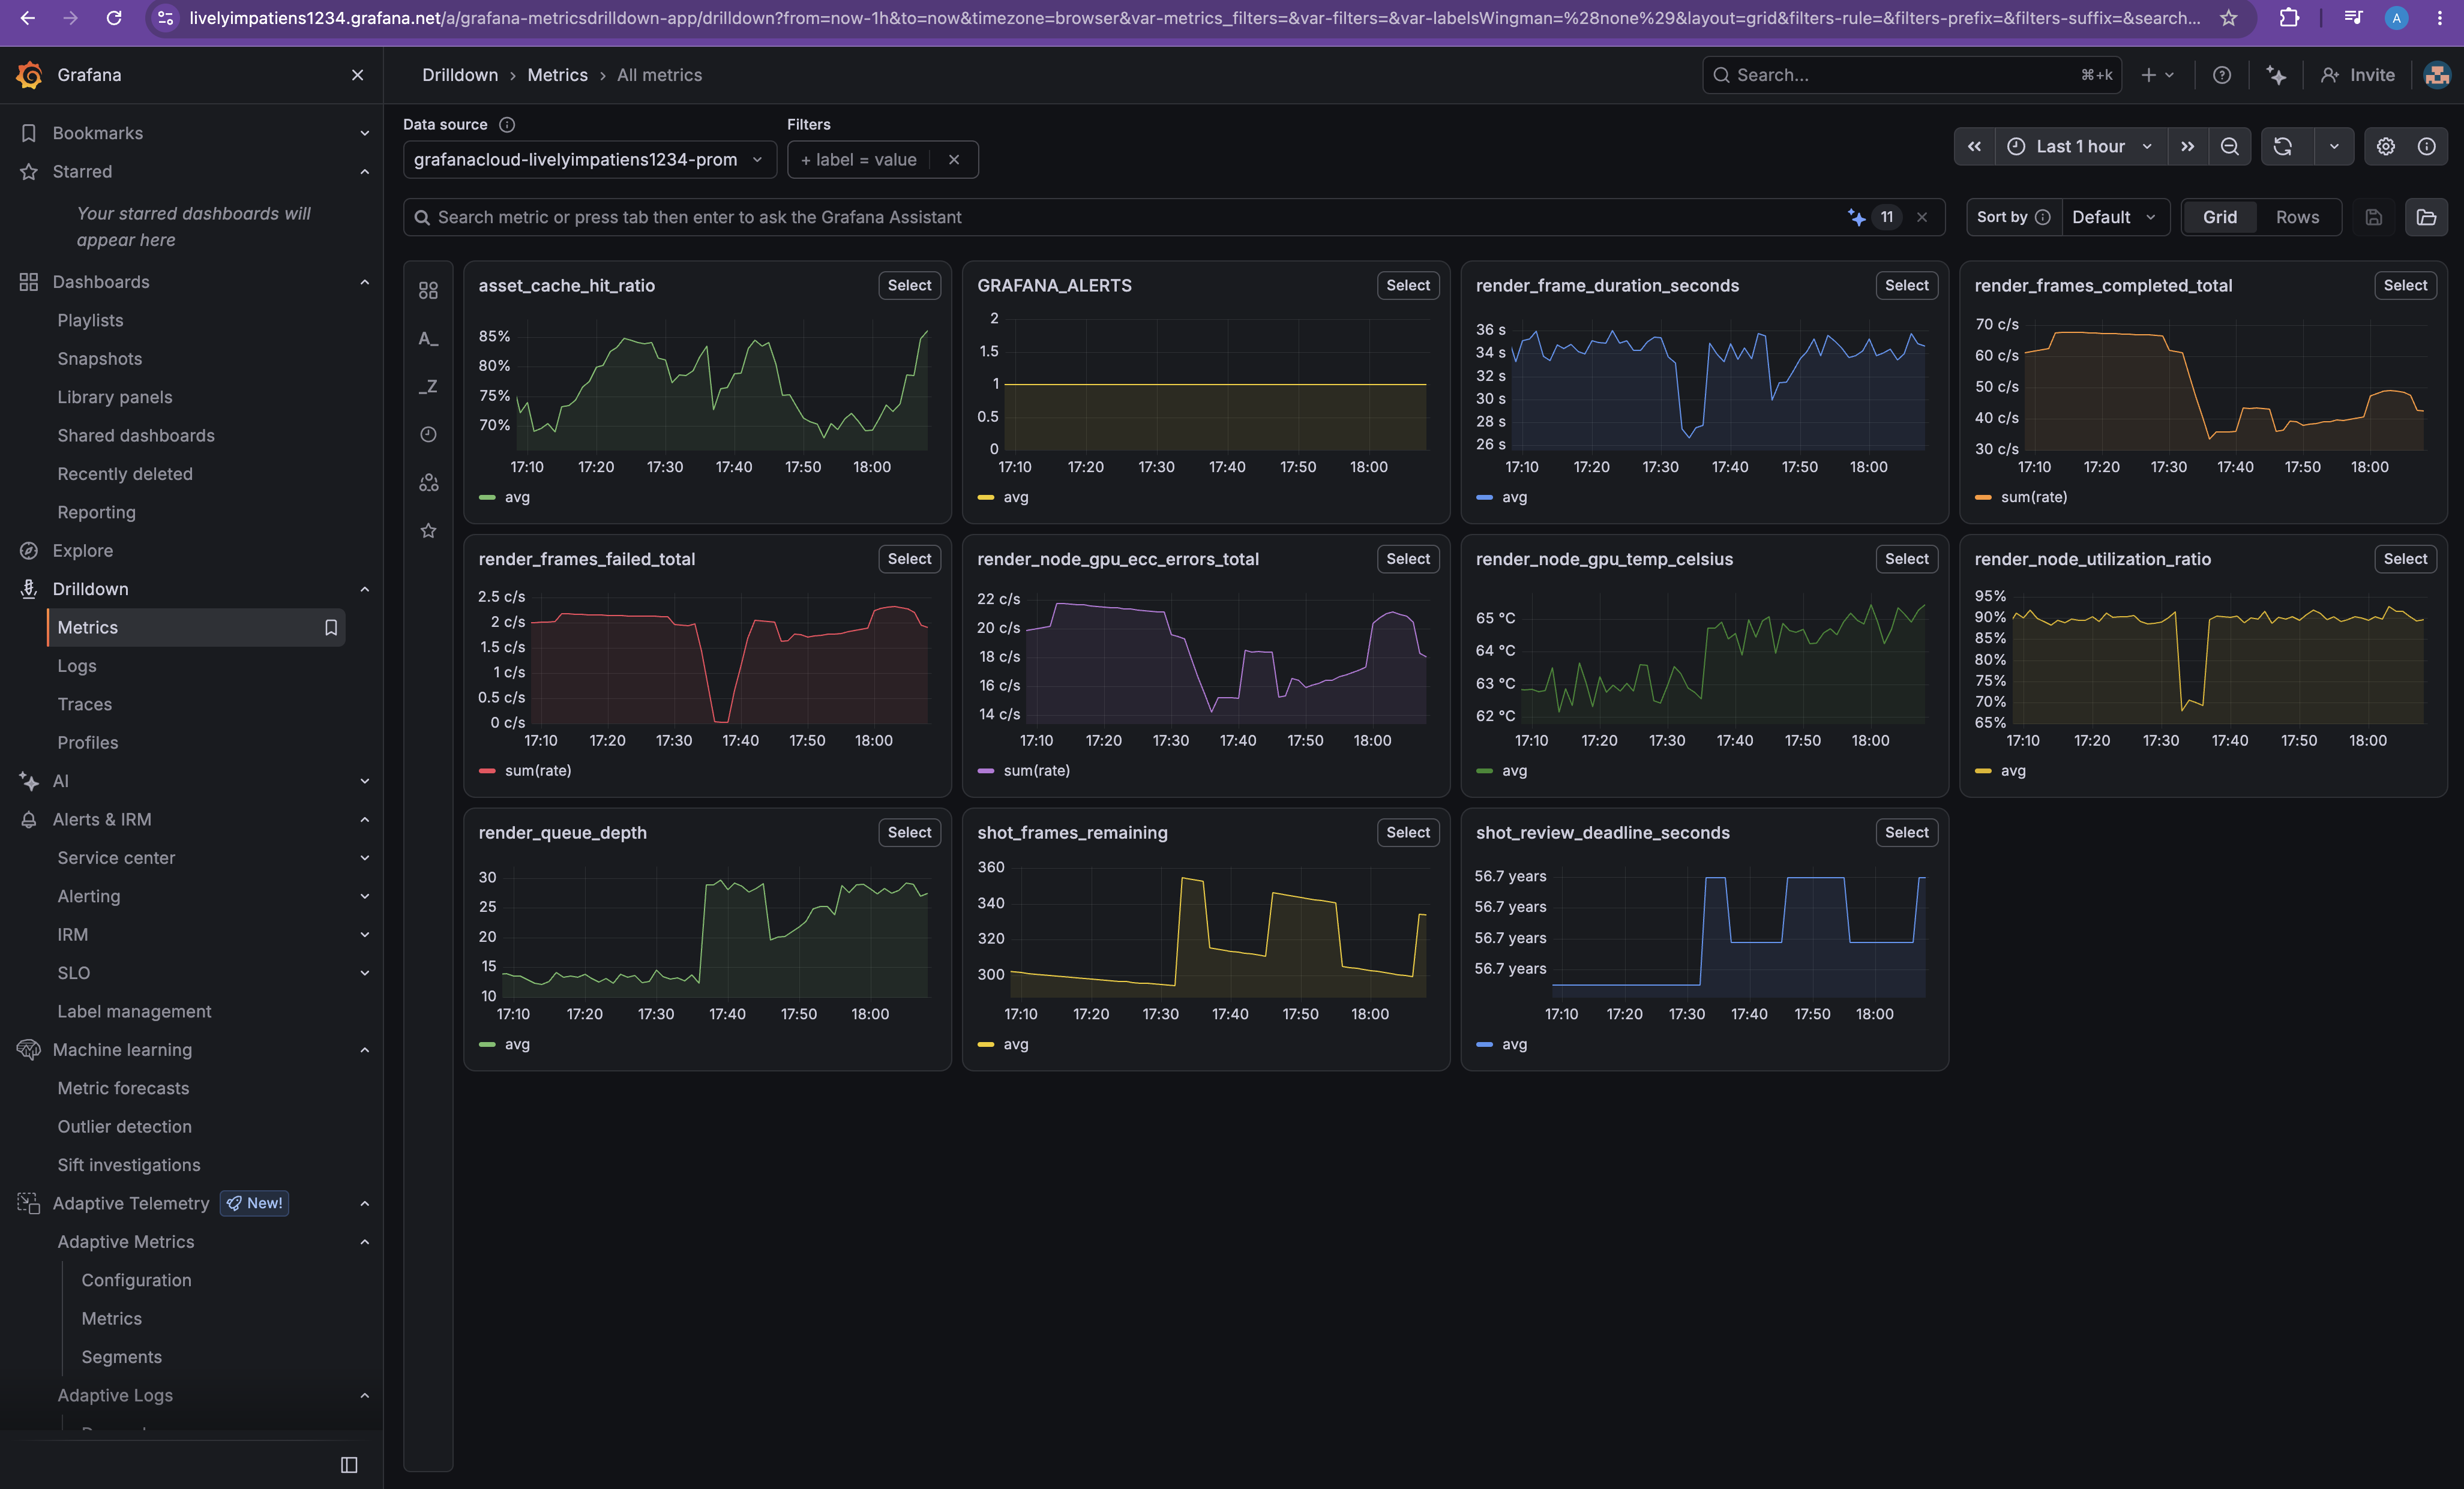
Grafana. Every fact the agent states comes from a live MCP tool call against the Grafana Cloud stack at runtime, no cached fixtures, no mocks. The bridge exposes 76 tools; a single triage run exercises list_datasources, list_alert_groups, list_prometheus_metric_names, list_prometheus_label_values, query_prometheus, list_loki_label_names, list_loki_label_values, query_loki_logs, query_loki_patterns, search_folders, search_dashboards, get_dashboard_by_uid, create_annotation, update_dashboard and alerting_manage_rules, spanning alerting, Prometheus, Loki, dashboards, folders and annotations, in both read and write directions. I also turned the telescope around and put Grafana Agent Observability on the agent itself, so token cost, latency and every tool call it makes are visible in the same stack it is investigating: which is how I justified running a fast model for the retrieval stages and a stronger one for the forecast.
The slate. A farm with three shots is a toy, so the console carries ~750 shots growing by 50 a day to about 1,400 by the deadline, sequences, departments, priorities, frame counts, review dates. It grows with no scheduler and no database, because the catalogue is a pure function of the date: the same shots on the same day in every process, duplicate ids impossible, and it keeps filling after I stop touching it. Live telemetry stays small on purpose, only the ~60 passes actually rendering get Prometheus series, and the page says plainly which numbers come from the production tracker and which from the farm.
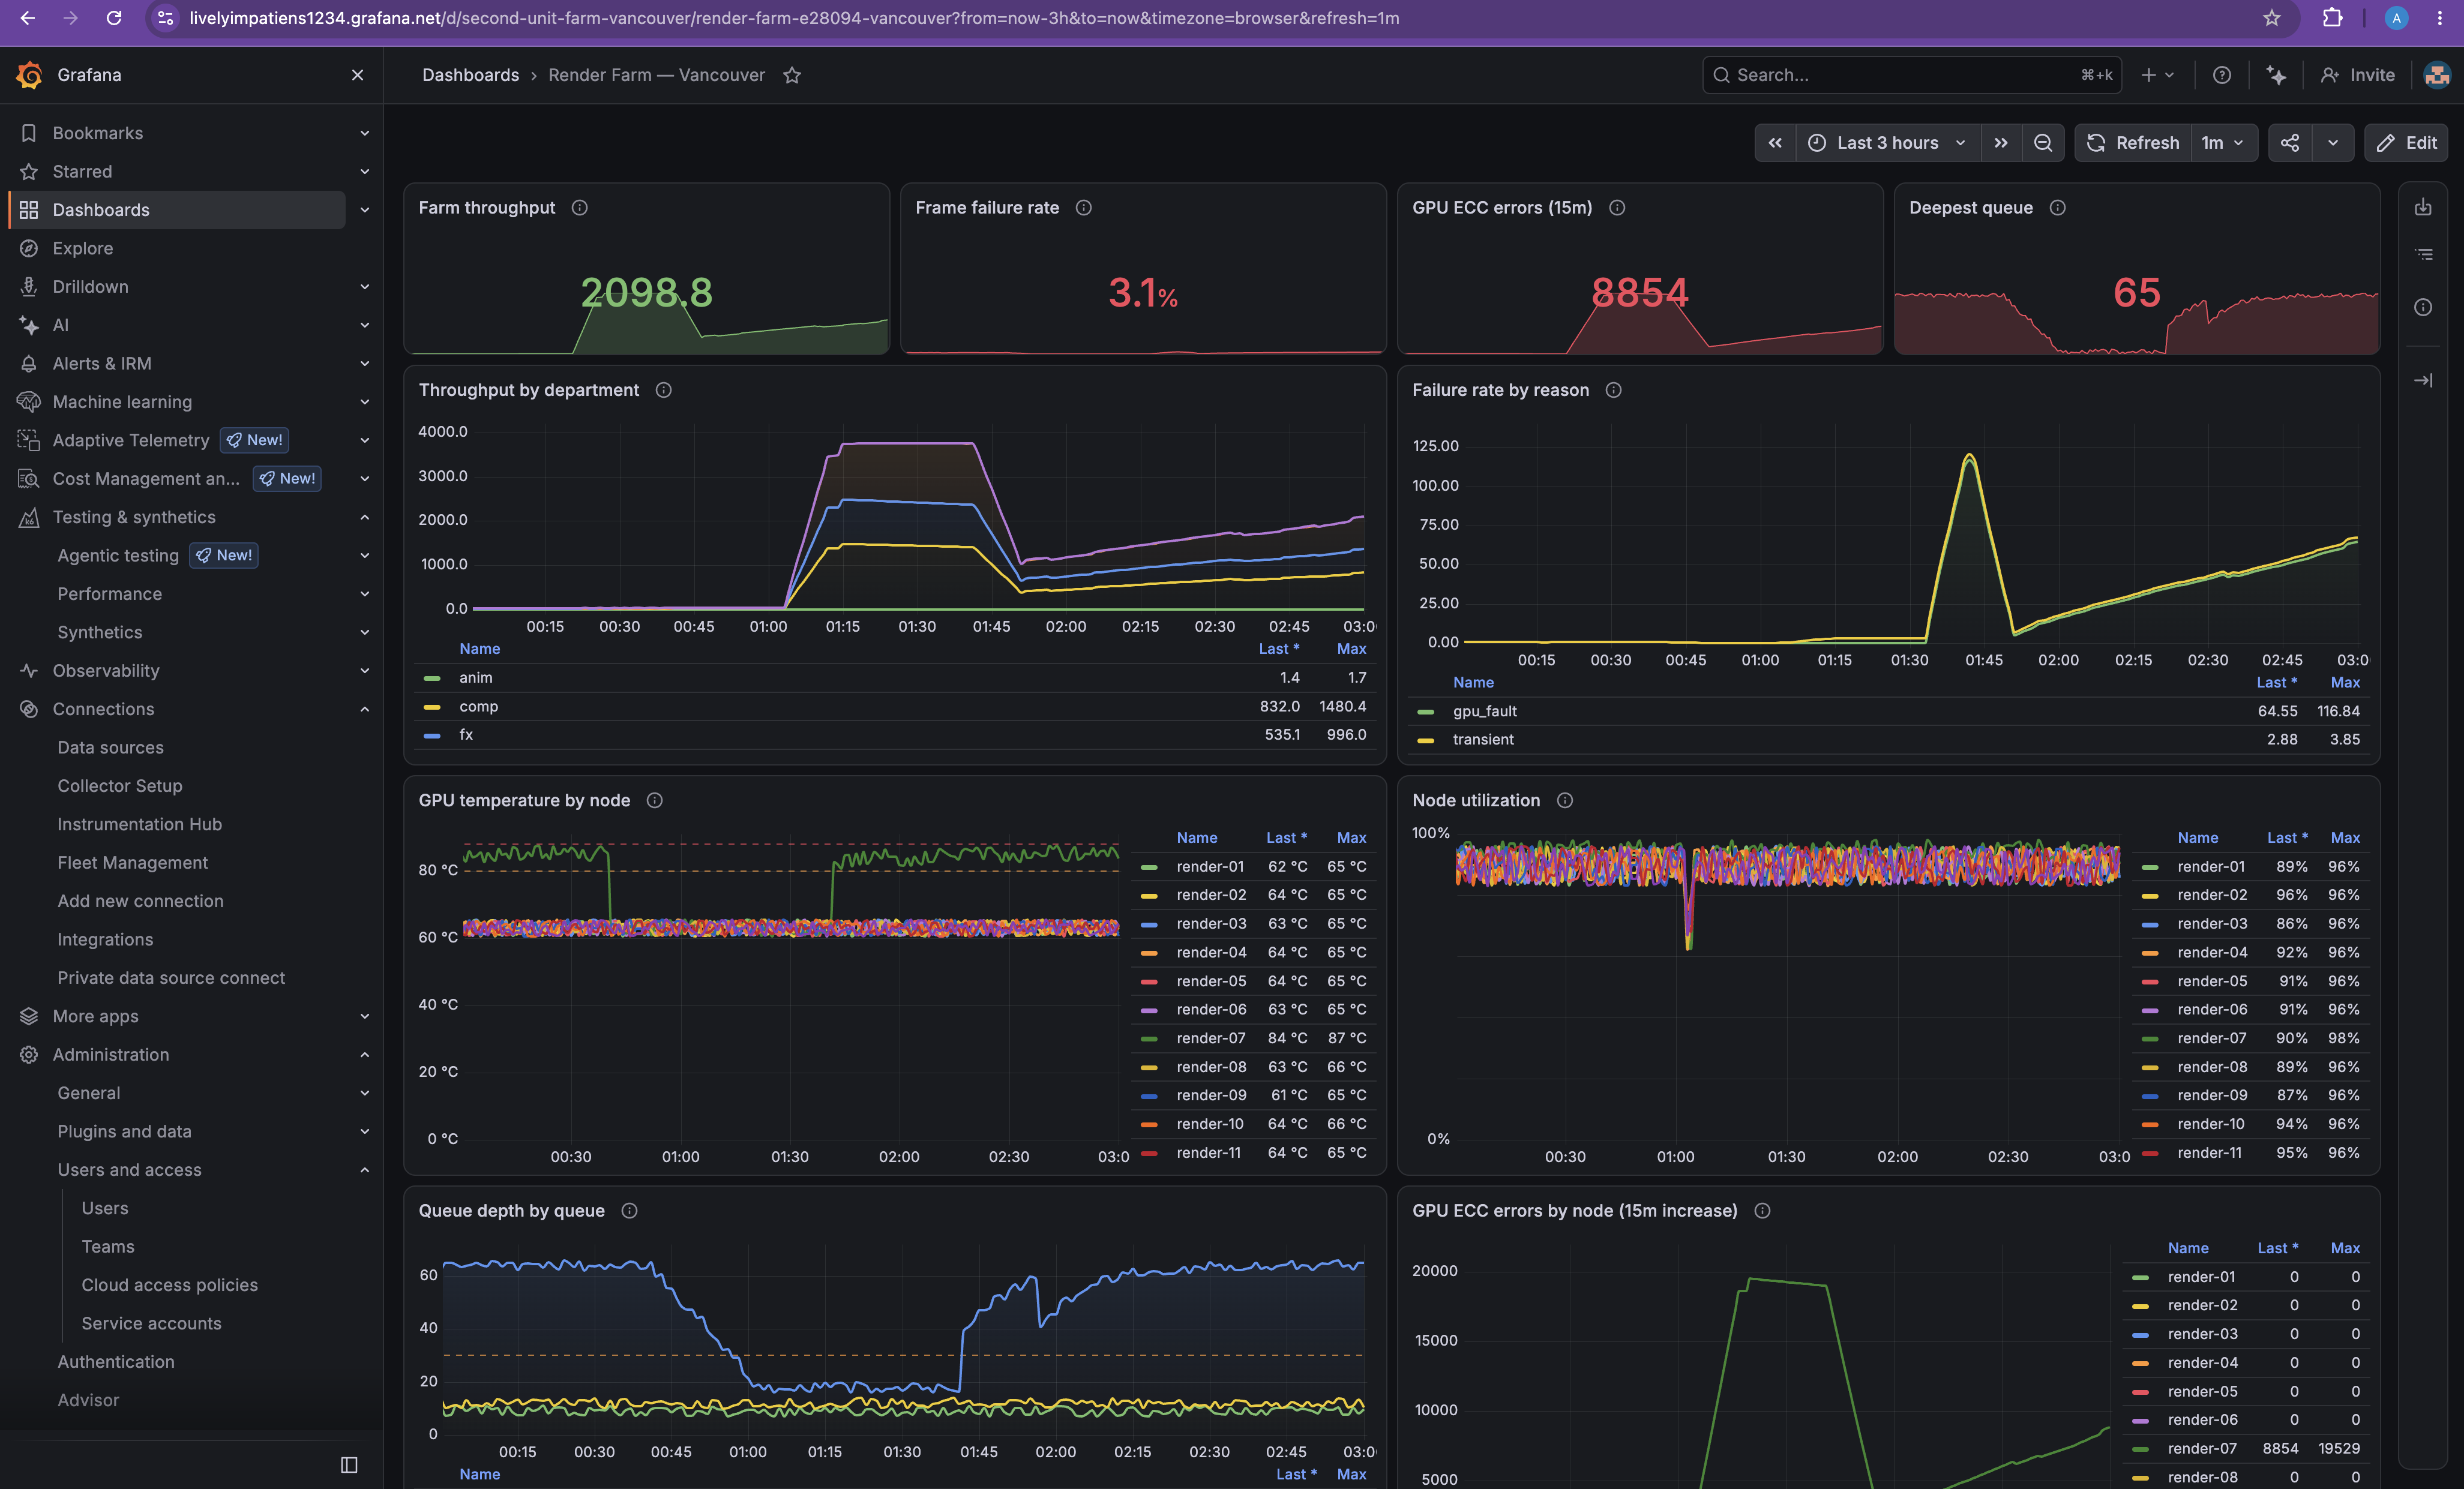
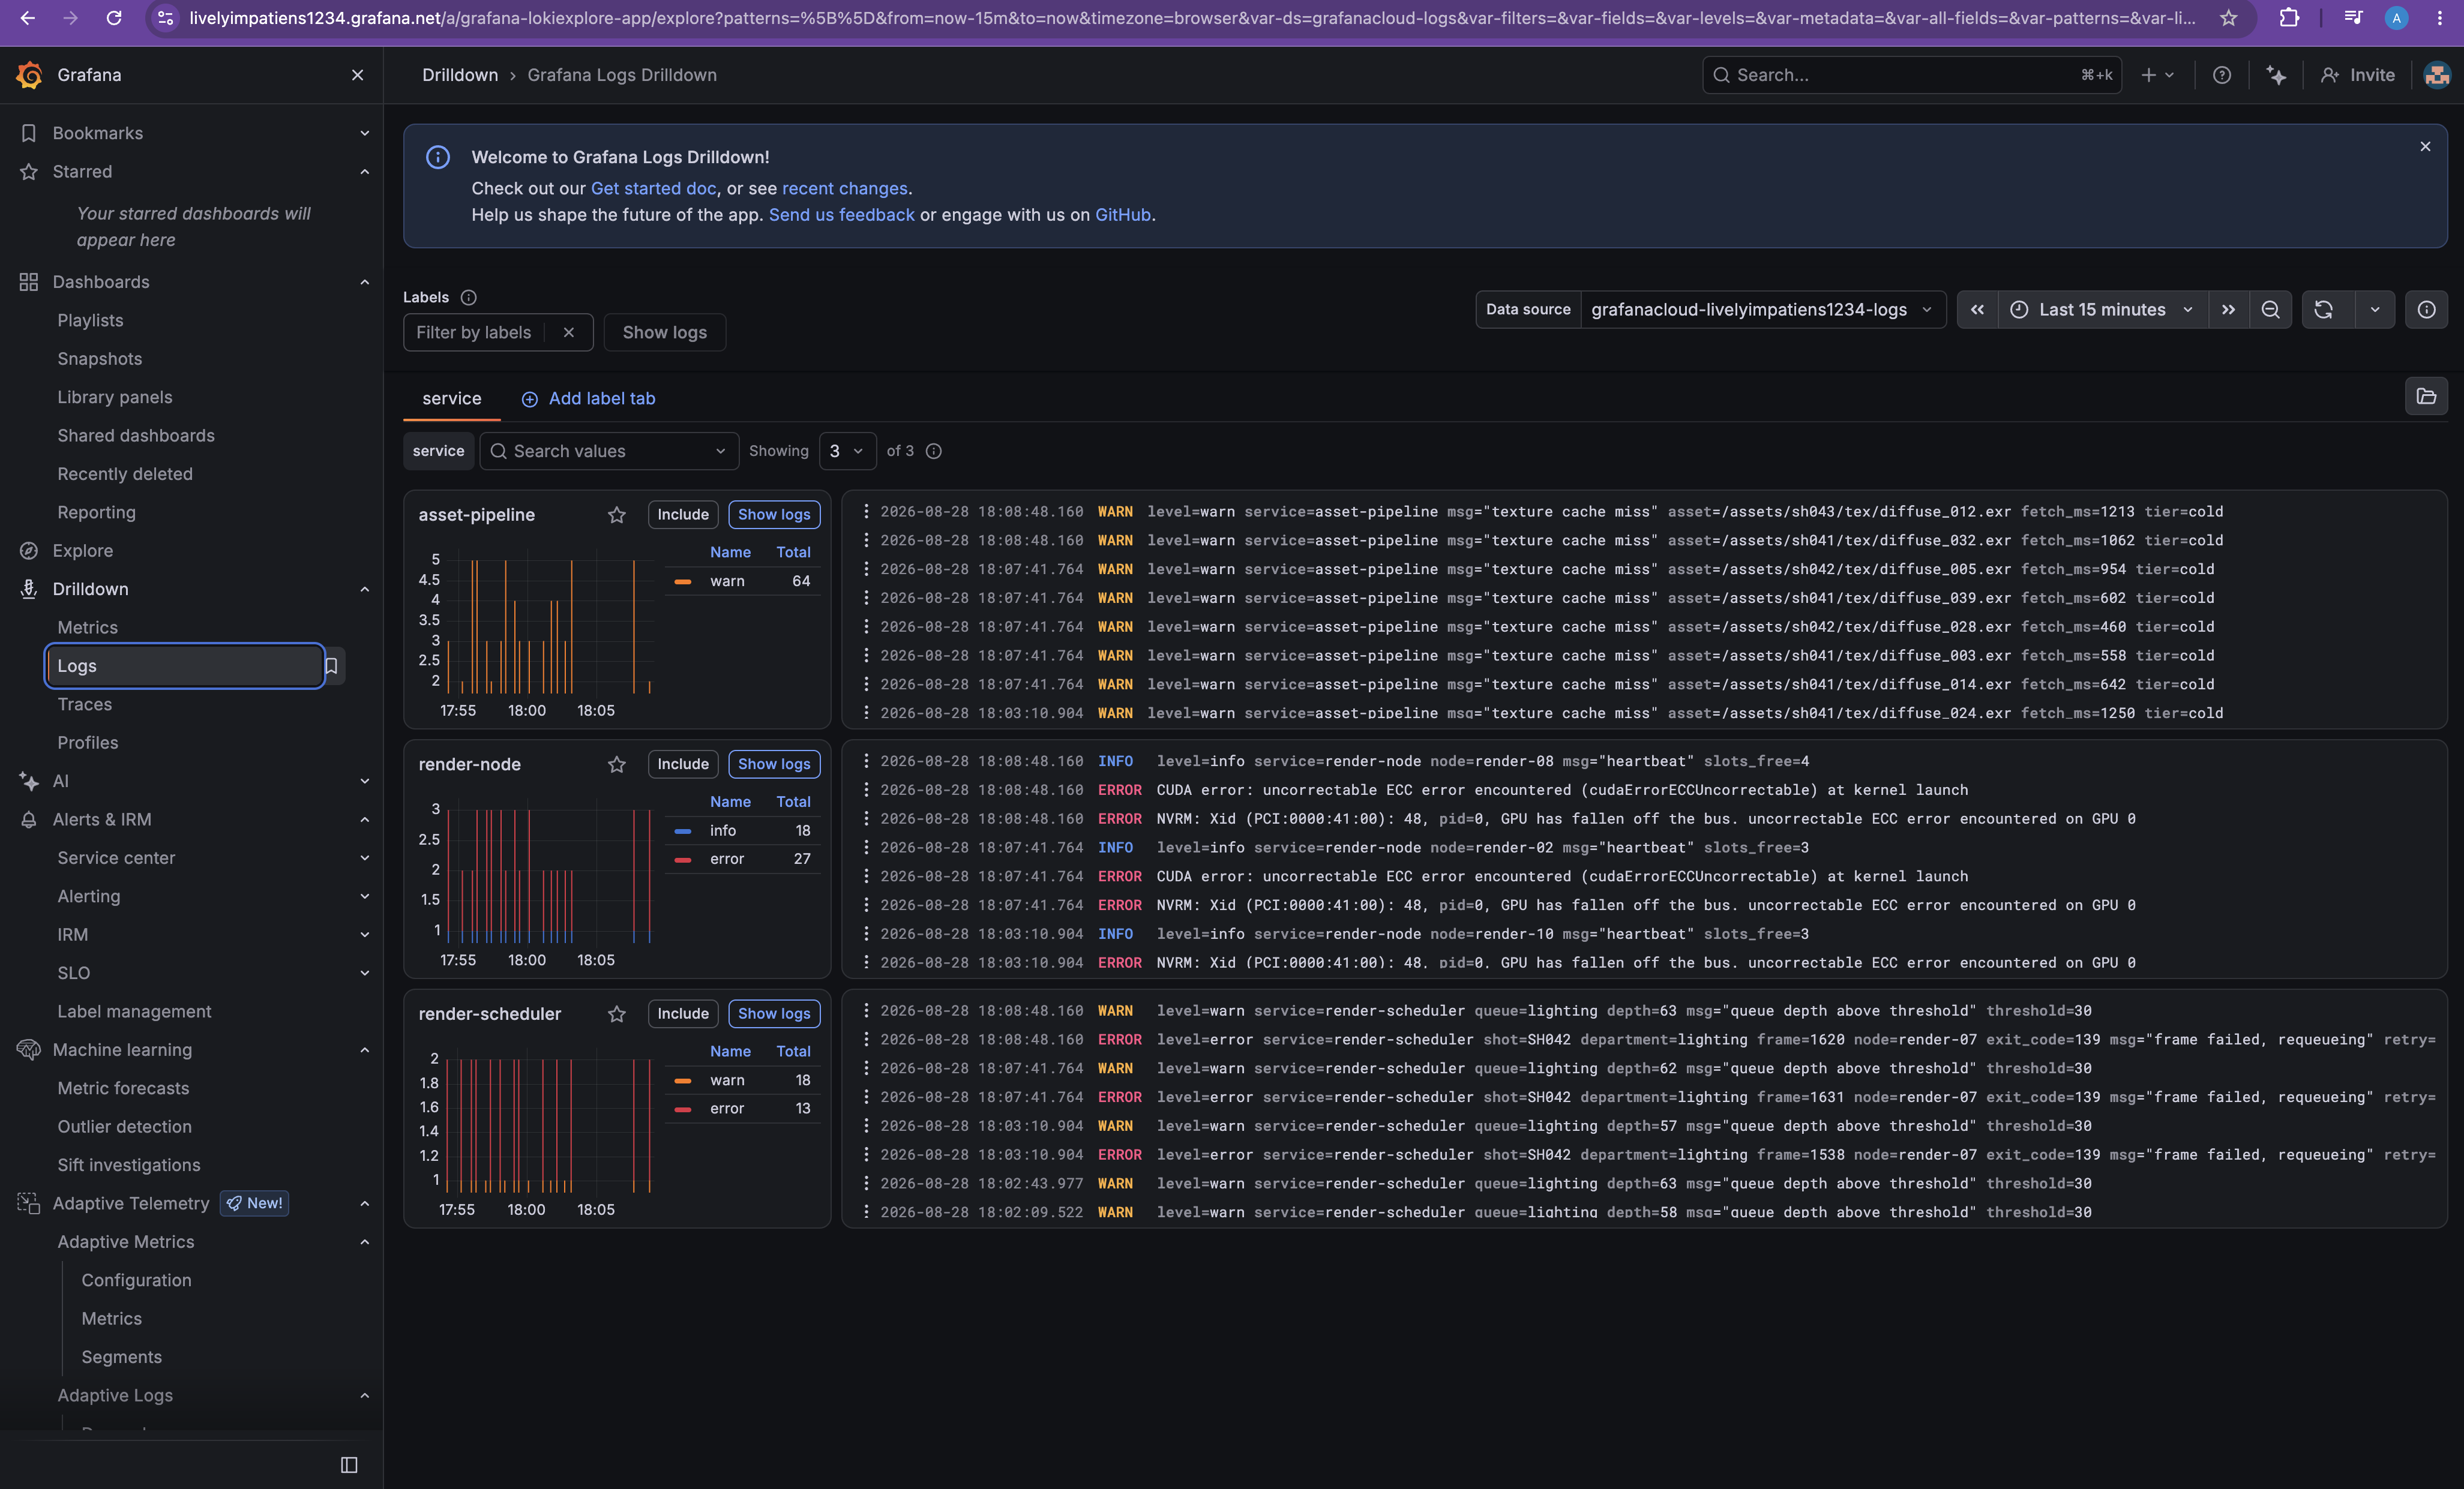
The telemetry. A studio's render farm isn't something you can borrow, so I generate one: a 12-node farm with three shots in flight, pushed to Grafana Cloud via Prometheus remote_write and the Loki push API. It is built around a real causal chain rather than a scripted answer, render-07 starts logging Xid 48 uncorrectable ECC errors, frames dispatched to it fail with exit 139 five minutes later, the retries crowd the lighting queue at eight minutes, and farm-wide throughput collapses at twelve. Measured over a 150-minute run, healthy throughput is 10.1 frames/min and degraded is 5.5, a 46% loss that pushes SH042 from a 2.7-hour ETA to 5.0.
There is also a deliberate decoy: the asset pipeline throws loud texture-cache-miss warnings throughout, starting before the incident. An agent that pattern-matches on "lots of warnings" reaches the wrong conclusion. The world is staged; the reasoning is not.
Challenges I ran into
- A dependency trap that reports itself as healthy.
google-adk2.7.1 requiresmcp>=1.24,<2, but it declares that only under an extra. A plainmcpinstall therefore resolves to 2.x,pip checkreports no broken requirements, and every ADK MCP import dies withNo module named 'mcp.shared.session'. Nothing in the error points at the version. I pinned the ceiling and left a comment inrequirements.txtexplaining why, because the next person to "tidy up the pins" will otherwise reintroduce it. - Remote MCP over streamable HTTP hangs forever without explicit timeouts (
adk-python#2615). Every client sets one and every await is bounded: a decision made on day one, not a fix after an outage. - Headless auth, answered with evidence rather than a shrug. I assumed the hosted Cloud MCP
endpoint would refuse an unattended process, then went looking for proof instead of trusting the
assumption. Five surfaces, all refusing a static service account token, and the decisive artefact
was the authorization-server metadata:
grant_types_supported: ["authorization_code",
"refresh_token"]
. Noclient_credentials. Every supported grant requires a user agent that can complete a redirect, so this is a property of the authorization server, not a header I got wrong. Grafana's own build session works because it runs locally beside a browser; ours is serverless and unattended, and that difference was the entire question. The probe is in the repo. - Building a fault worth diagnosing. The first version of the seeded farm burned through every frame of the shot before the incident even landed, which left the forecaster with a deadline that could not be missed. Throughput had to be derived from frame duration and nodes assigned to passes before the scenario had any stakes.
- A retry loop that only appeared in production.
find_error_pattern_logsis the one tool of 76 whose signature takes nodatasourceUid, it is a Sift investigation tool. The model generalised correctly from its 75 siblings, was wrong, and got backunknown argument "datasourceUid": an error that names the invalid argument but not the valid one, so there was nothing in it to break the loop. It retried eleven times on the deployed service. What stopped it was a per-stage tool-call budget added an hour earlier for an unrelated reason, ADK's own default is 500 calls, which on a public URL means a stranger's click can hammer your observability stack. - Two container bugs that a working laptop build actively hid.
mcp-grafanarequires Go ≥ 1.26.3; my machine silently auto-upgraded its toolchain while the official Go image setsGOTOOLCHAIN=localand refuses to. And Debian putstiniin/usr/bin, not/usr/sbin, a container that cannot exec its entrypoint fails Cloud Run's startup probe with no application log at all. The Dockerfile now asserts every path the entrypoint depends on, so that class of failure names a file at build time instead of going silent at deploy time.
Accomplishments that I'm proud of
- The approval gate. Most agent demos show an agent doing things. This one shows an agent that cannot touch your observability stack until a human agrees: the actual precondition for anything like this running in a studio.
- The output is in the language of the people who need it. "SH042 slips 2.3 hours past Friday's review" is a sentence a producer can act on. "p99 render latency up 340%" is not.
- The agent is observable. Using Grafana as both the agent's tool surface and its telemetry backend meant I could answer "what did that investigation cost" with a number instead of a shrug.
- Fleet-wide triage that uses no model at all. A producer's real first question is "what else needs me?", and answering it with an agent per shot would triple the cost of every run to report that two of three shots are fine. So the sweep is plain Python over one Prometheus query, every shot every time, and the agent is spent only on the exception. It cannot hallucinate a shot or disagree with itself between runs, and it immediately earned its place by exposing a contradiction in its own scenario that a judge could have spotted.
- A cleanup tool for its own mess. Every approved write-back adds an annotation, so a day of
development leaves a farm timeline full of near-duplicates.
stack_hygiene.pyinventories by default and deletes only behind an explicit flag and a typed confirmation.
What I learned
- The hard part of an observability agent isn't querying the data, it's deciding what's worth saying. Most of the engineering went into constraining the agent to one useful verdict instead of a wall of correlations.
- A synthetic environment is a piece of engineering in its own right. If the failure you seed has no consequence, the agent has nothing to reason toward, and no amount of prompt work rescues it.
- A verifier can have the same disease as the thing it verifies. My first write-back checker matched dashboards by name and "confirmed" two writes that never happened, because Grafana Cloud ships a built-in dashboard called "Incident Insights" and the heuristic matched the word "incident". A verifier with a false-positive mode is worse than no verifier: it launders the agent's claims. It is now a strict before/after id diff, and each new object can be credited to only one claim.
- Withholding a capability also withholds its vocabulary. Removing the write tools from the
planning stage worked exactly as designed, and then the planner proposed
grafana_annotation_tool, which does not exist, because it could no longer see the real names. The same shape bit me twice more: nosearch_folders, so it could not find a folder id for an alert rule; no Loki label tools, so it guessed label names. Least privilege has an ergonomic cost and you pay it at the interface.
What's next for Second Unit
- Wire it to real farm schedulers (Deadline, Tractor) so the forecast reads live queue state instead of inferring it from metrics.
- Close the loop on remediation: requeue failed frames onto healthy nodes, still gated behind approval.
- Per-show cost attribution: the same telemetry answers "what did this sequence cost to render," which is a producer's other favourite question.
Built With
- agent-engine
- cloud-run
- docker
- gemini
- gemini-tts
- google-adk
- google-cloud
- grafana
- grafana-cloud
- loki
- mcp
- model-context-protocol
- prometheus
- promql
- python
- secret-manager
- tempo
- vertex-ai

Log in or sign up for Devpost to join the conversation.