-
-
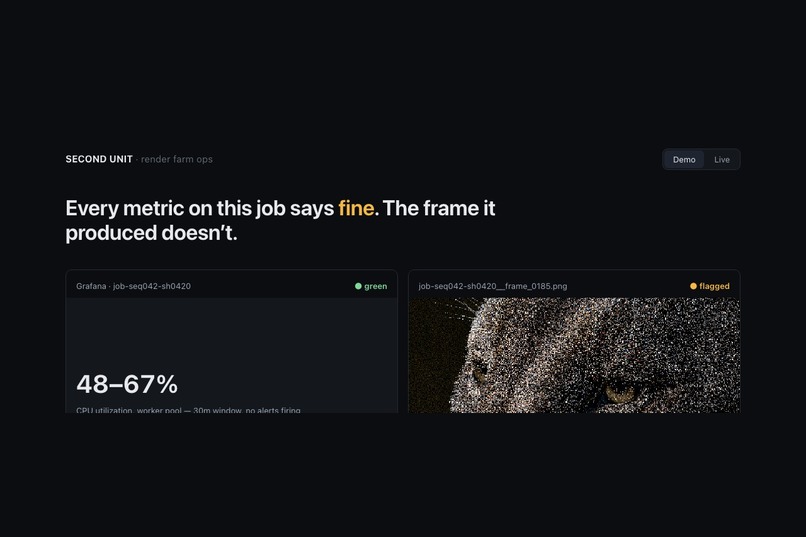
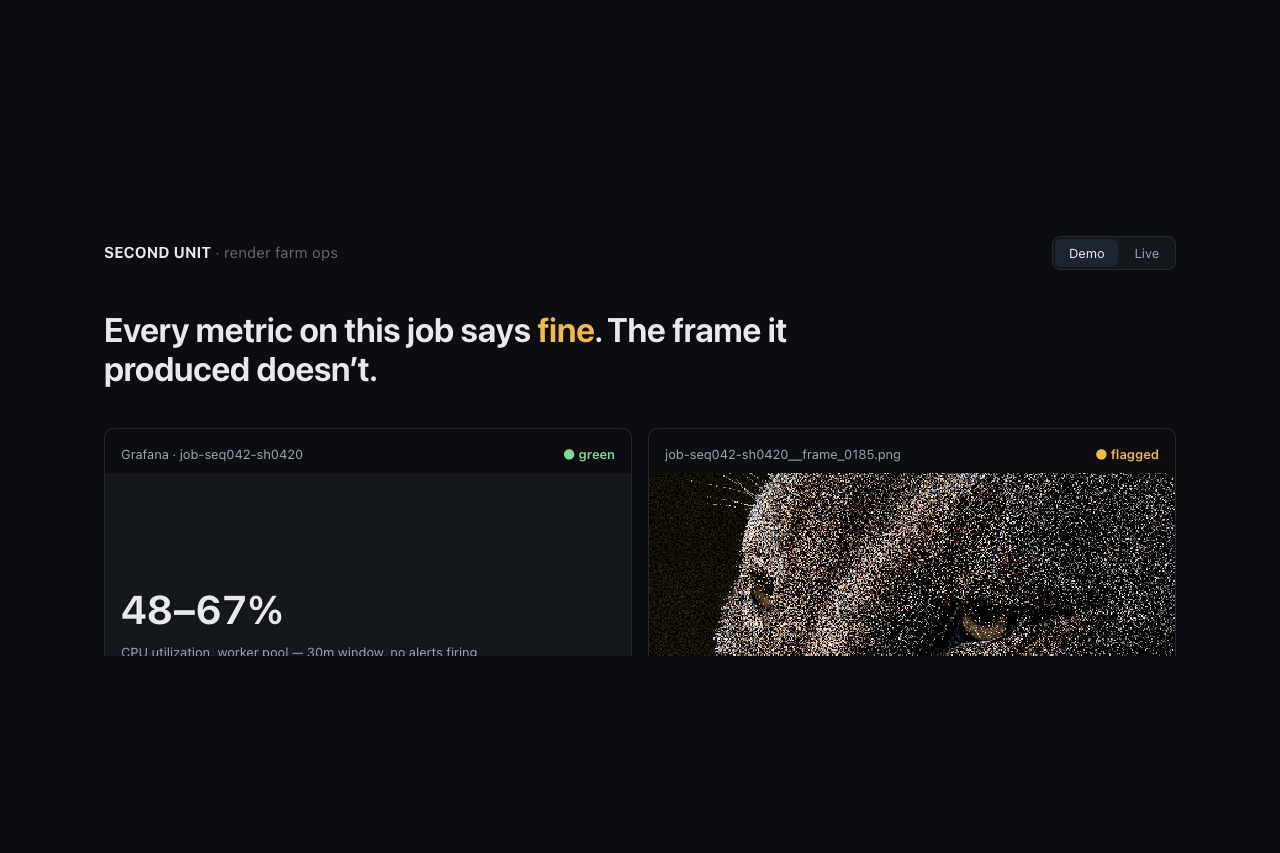
he contradiction: Grafana says the render is green. The frame it produced is genuinely broken.
-
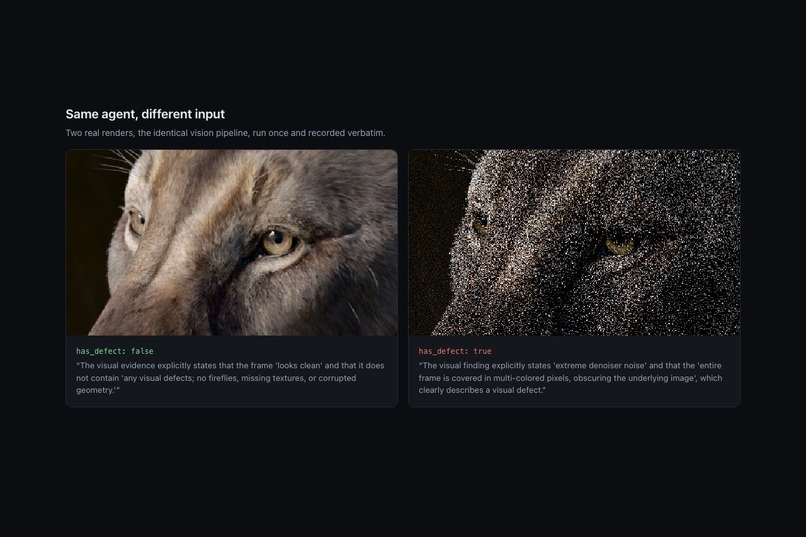
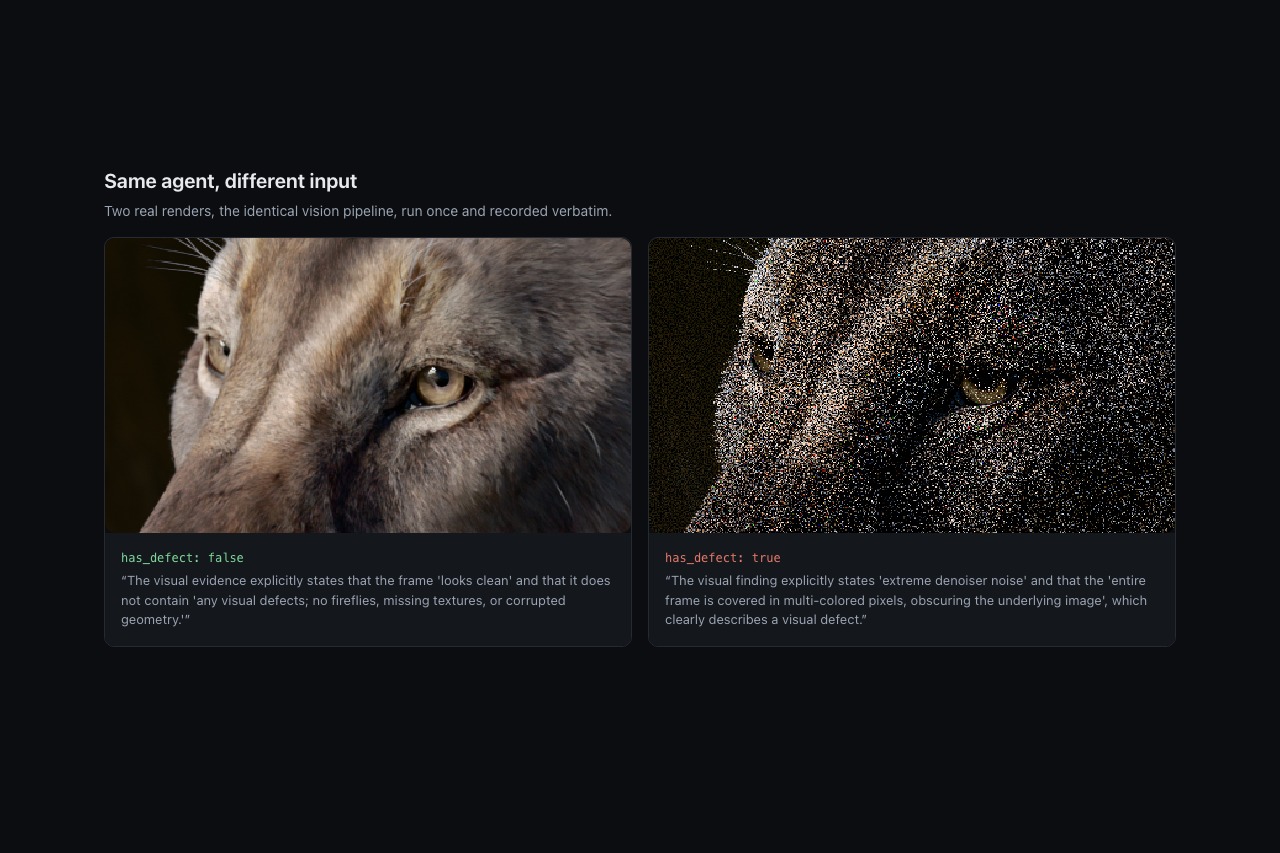
Same agent, two real renders. Clean frame in → has_defect: false. Broken frame in → has_defect: true — real verdicts, not staged.
-
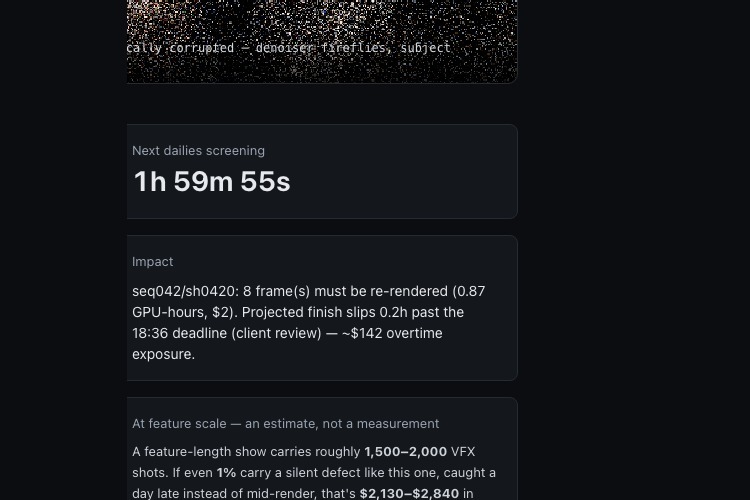
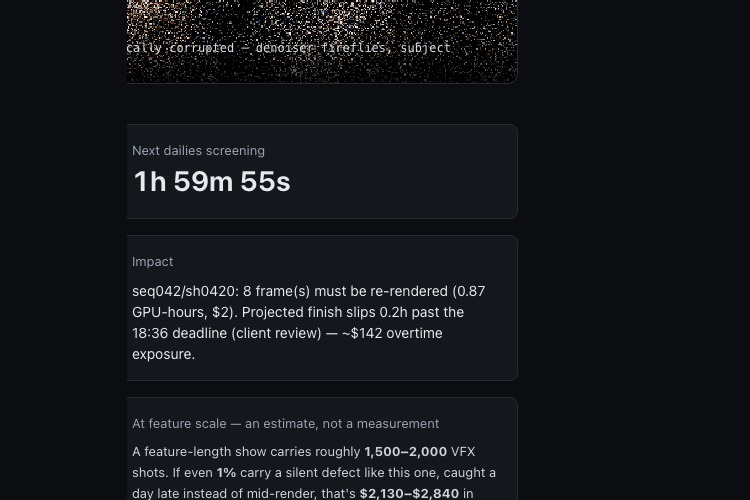
Real cost from a real formula: $2 re-render now vs. $142 overtime tomorrow, extrapolated to feature scale with the math shown, not asserted.
Inspiration
Render farms are the largest single cost line in post-production, and studios genuinely monitor them in Grafana today. But observability has a structural blind spot: it measures whether the job succeeded, never whether the output is correct.
A render can finish in the expected time, on a healthy node, with exit code 0 and every metric nominal — and still produce a visibly ruined frame. Denoiser fireflies from a bad sample count. A missing texture rendering as flat magenta. No dashboard on earth alerts on that, because from the infrastructure's point of view nothing went wrong.
Today that gets caught by an artist at the 9am dailies screening, hours after it could have been caught mid-render, with the re-render cost and the schedule slip already locked in.
What it does
SECOND UNIT is a deterministic agent crew that watches a render farm two ways at once:
- Reads the telemetry — Prometheus metrics, Loki logs, and Tempo traces, live through the Grafana Cloud MCP server.
- Looks at the actual picture — Gemini vision on the real rendered frames.
When those two disagree — green metrics, broken art — it raises the alarm the dashboards never would. It then maps the defect to the specific shot, computes what it costs in GPU-hours, schedule slip, and overtime exposure against the delivery deadline, proposes a fix, waits for a human to approve, and writes the incident back into Grafana as a real annotation on the team's own panels.
How we built it
- Google Cloud / Gemini: A deterministic ADK agent graph —
SequentialAgent→ParallelAgent(4 evidence agents in parallel) →LoopAgent(skeptic/re-examine verify loop) → impact → plan → human approval gate → actuator.gemini-2.5-profor vision,gemini-2.5-flashfor reasoning, via Vertex AI. Deployed on Cloud Run, with Firestore for the shot list, Secret Manager for credentials, and a least-privilege runtime service account. - Grafana (partner): The official
grafana/mcp-grafanaserver, called at runtime, in both directions — reading metrics/logs/traces (33 tools live, including proxied Tempo) and writing annotations back. The agent graph's own reasoning is auto-instrumented into Grafana Tempo bygoogle-adkitself (verified live: a single diagnose run produces a 35-span trace, including each sub-agent's actual output text), so you can debug the AI inside the same tool you use to debug the farm. The vision agent's verdict is also emitted as a real Prometheus counter (second_unit_visual_defects_detected_total) with a provisioned Grafana alert rule on it — the failure class that observability structurally cannot see becomes something you can page on, not just a chat transcript. - THE BACKLOT: a real render farm, not a simulator. Headless Blender rendering real frames from Blender's official CC-BY 5.2 splash asset, with faults induced through real render conditions — sample count forced to 1, textures genuinely unpacked and repointed to a dead path, workers actually SIGKILLed mid-frame.
- The proof:
eval/harness.pyscores the real agent against every real rendered condition and commits a regenerable scorecard.
Challenges we ran into
Everything below was found by running the thing, not by reasoning about it:
- Getting pixels in front of a vision agent. An ADK function tool returns text/JSON, so
frames have to go through
ToolContext.save_artifact()and then ADK's built-inload_artifactstool. Before that was wired correctly, one agent confidently described "a Viper spacecraft flying through a nebula" for a frame that was a grey cube — it had no image and hallucinated one. That failure is exactly why the eval harness exists. - A verify loop that manufactured defects. The loop ran a fixed 3 rounds regardless of
outcome, so after confirming on round 1 it had nothing left to examine and invented a
critique on a clean frame. Fixed with a real
exit_loopescalation tool. - Two keyword classifiers that both failed, in opposite directions. One missed a real detection; its replacement then flagged "there are no visual defects" because "defect" matched as a substring. Replaced with a structured-output verdict agent — the right tool for a question with a real structured answer.
- A fault that wasn't a fault. The first low-sample-count renders came out pixel-identical to clean ones, because Blender's default scene uses EEVEE, which ignores Cycles sample settings entirely.
- Headless MCP auth. The hosted
mcp.grafana.comendpoint is OAuth-2.1-only by design (verified: a service-account token returns401 invalid_token), which a Cloud Run container with no browser cannot complete. The official self-hosted binary — explicitly permitted by the track rules — authenticates unattended and exposes the same tools.
Accomplishments that we're proud of
An eval scorecard that is real and regenerable in one command: 11 real rendered conditions,
100% detection rate, 0% false positives, and 6 defects caught that a threshold-alerting
baseline would have missed entirely. That 0% isn't the first number we got — an earlier run
scored 25%, both false positives traced to the verify loop over-reading clean fur as damage,
fixed and re-run rather than explained away. eval/RESULTS.md regenerates from scratch and is
never hand-edited, so the number on this page can't drift from what the harness actually
found.
What we learned
Agent quality is a measurement problem before it is a prompting problem. Every meaningful improvement here came from building the harness that could catch the agent being wrong — the hallucinated spacecraft, the manufactured critique, the negation-blind classifier — and none of them would have been visible from a single happy-path demo run.
What's next for SECOND UNIT
Point it at a real studio's stack: their Grafana, their shot database behind the one
tools/shotlist.py interface, their farm's existing exporters instead of our Blender
backlot. It doesn't replace a studio's alerting — it adds the one check that alerting
structurally cannot perform.
Built With
- blender
- cloud-build
- cloud-run
- fastapi
- firestore
- gemini-2.5-flash
- gemini-2.5-pro
- google-adk
- grafana-cloud
- grafana-mcp-grafana
- loki
- nextjs
- opentelemetry
- prometheus
- python
- secret-manager
- tempo
- typescript
- vertex-ai

Log in or sign up for Devpost to join the conversation.