-
-
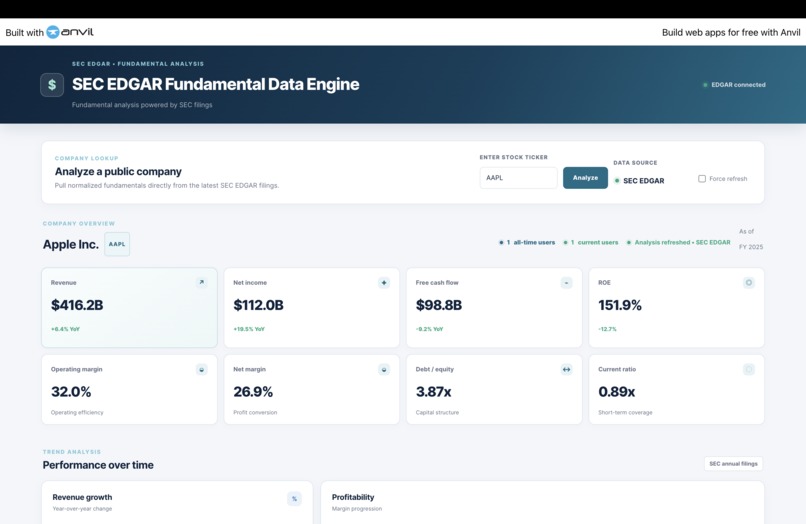
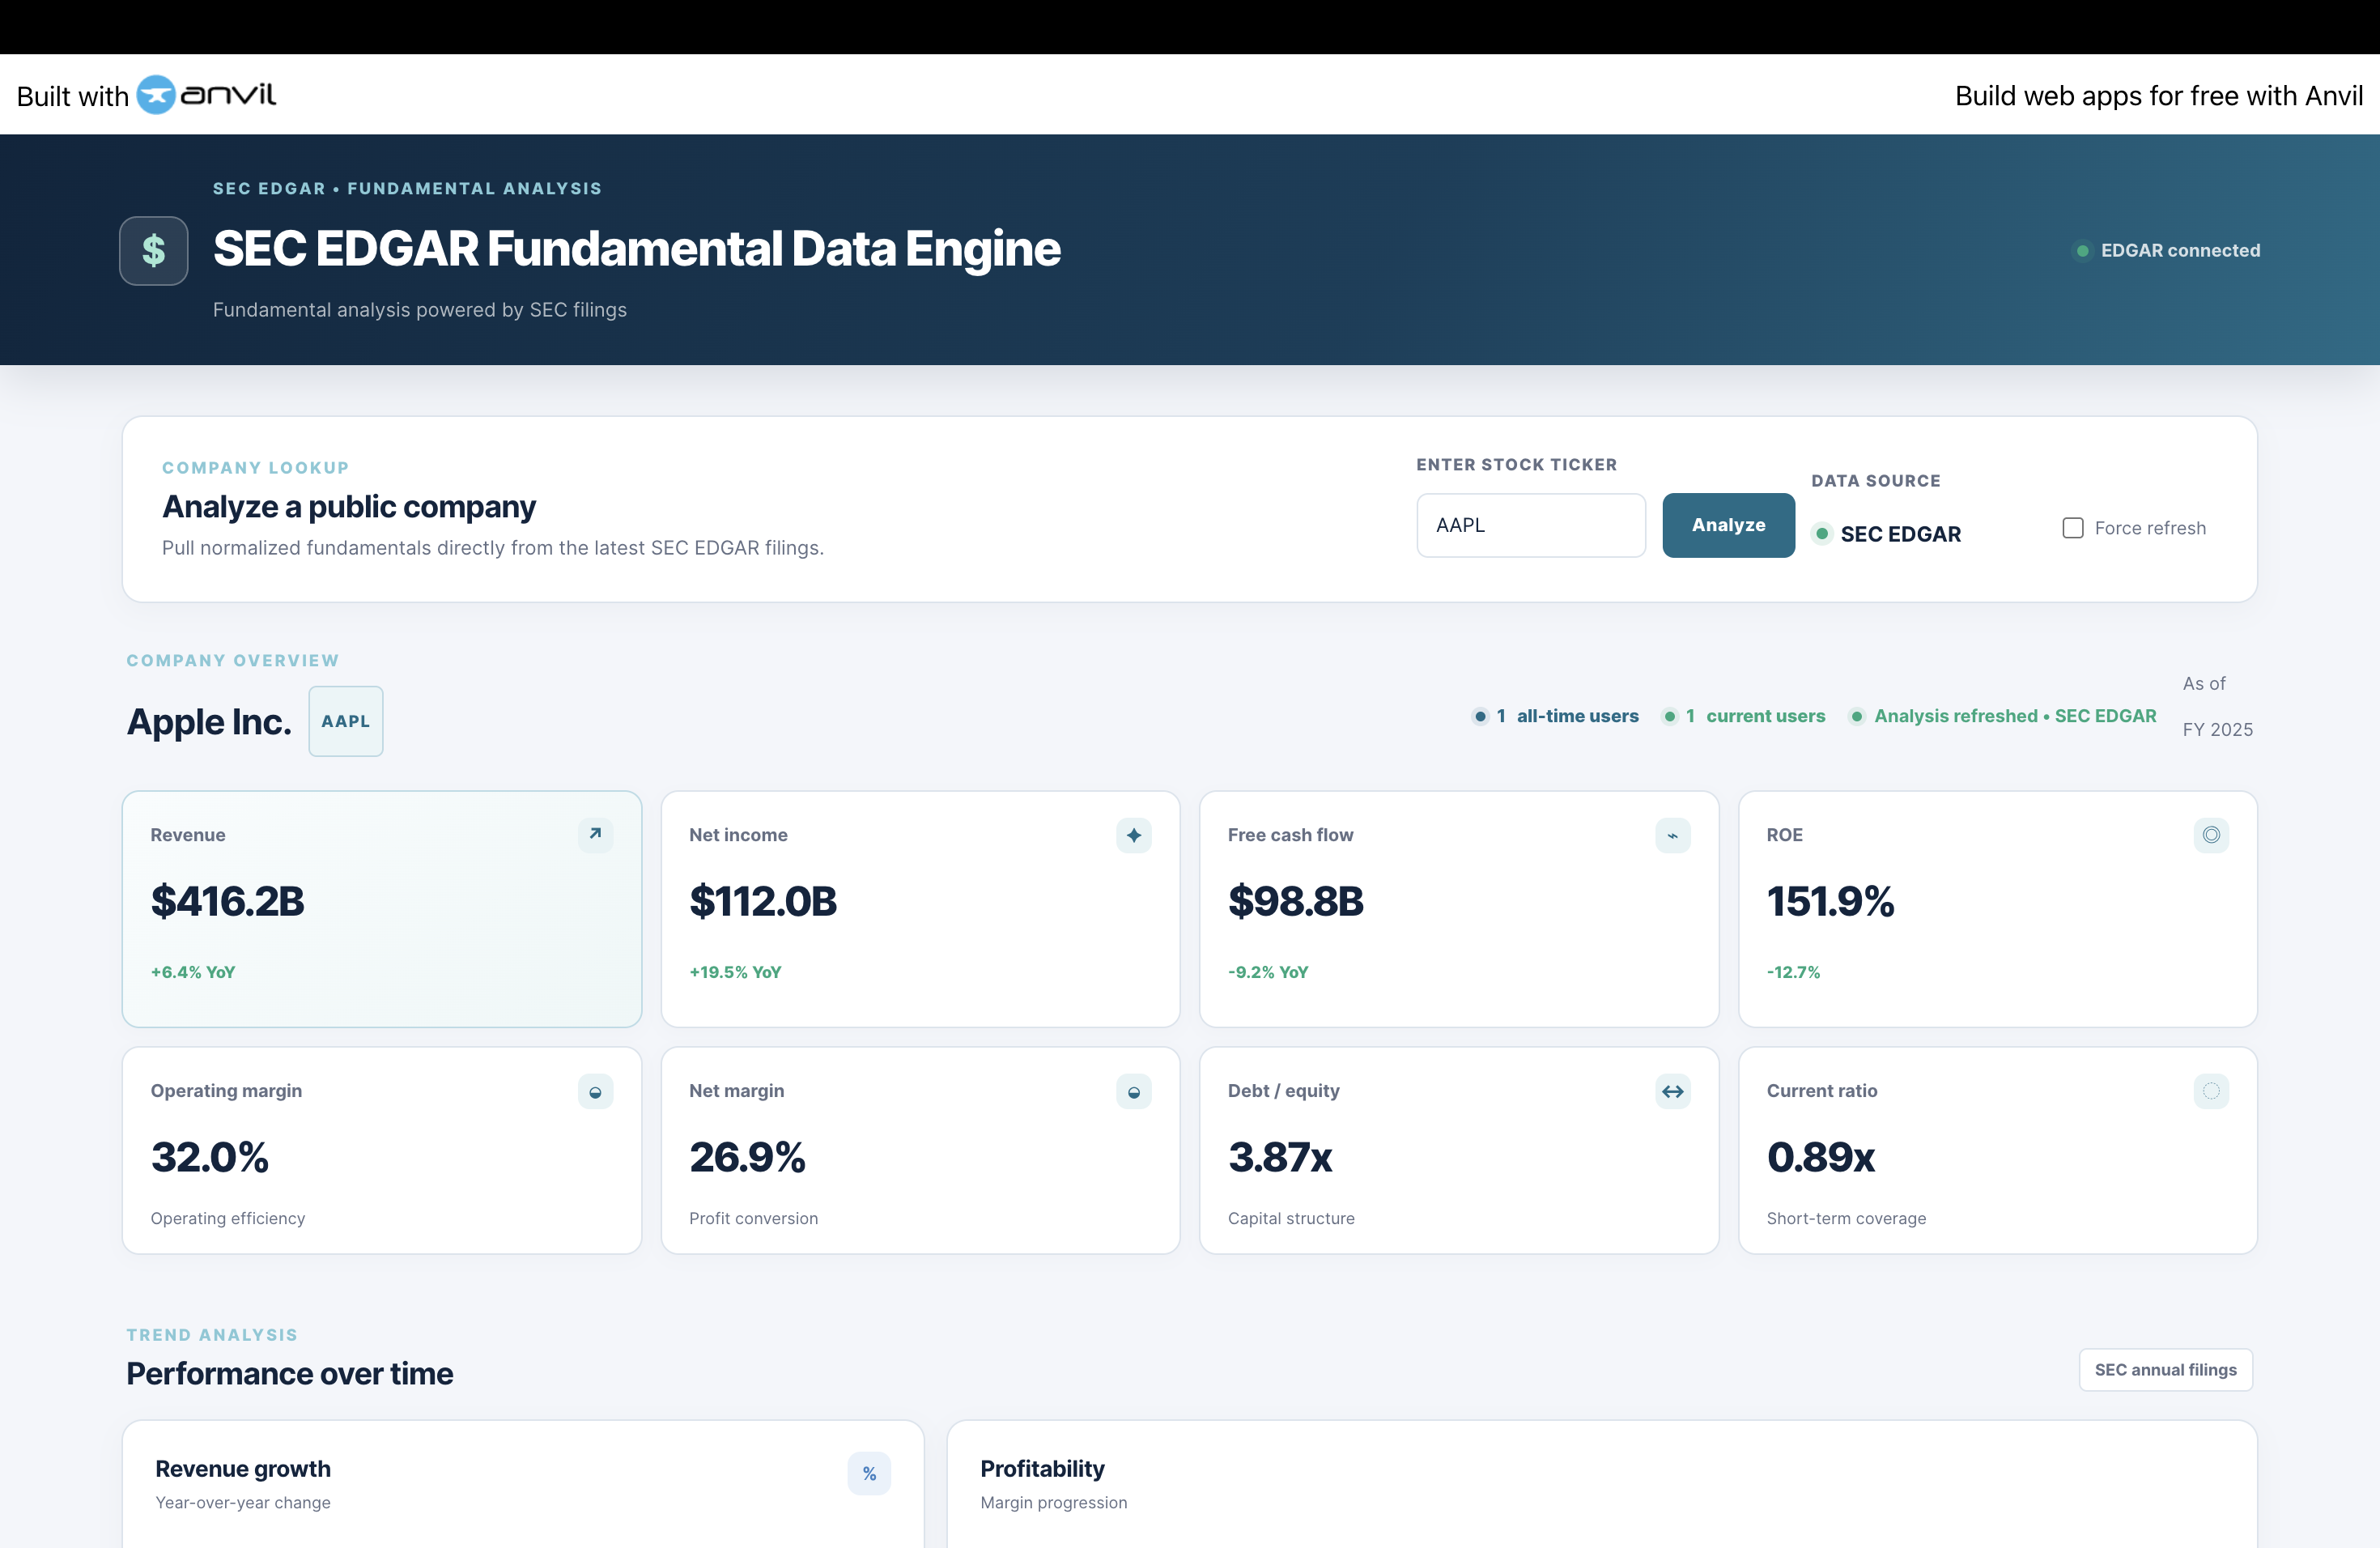
Interactive Financial Analysis Dashboard — Streamlit interface
-
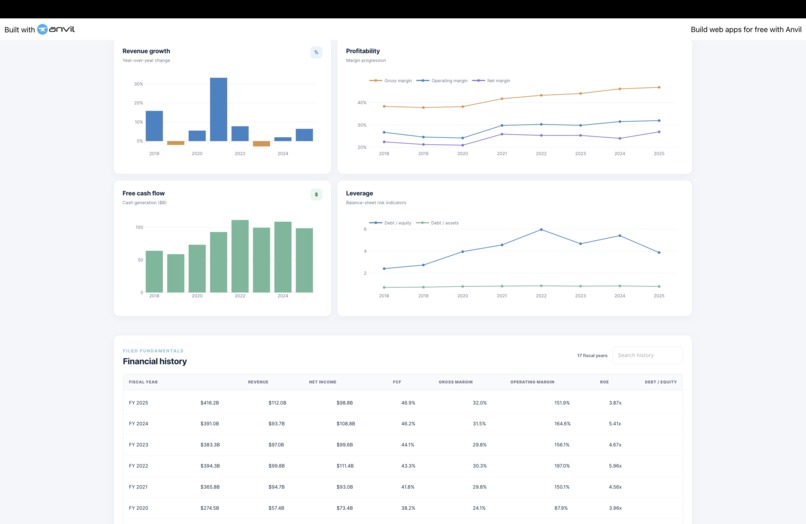
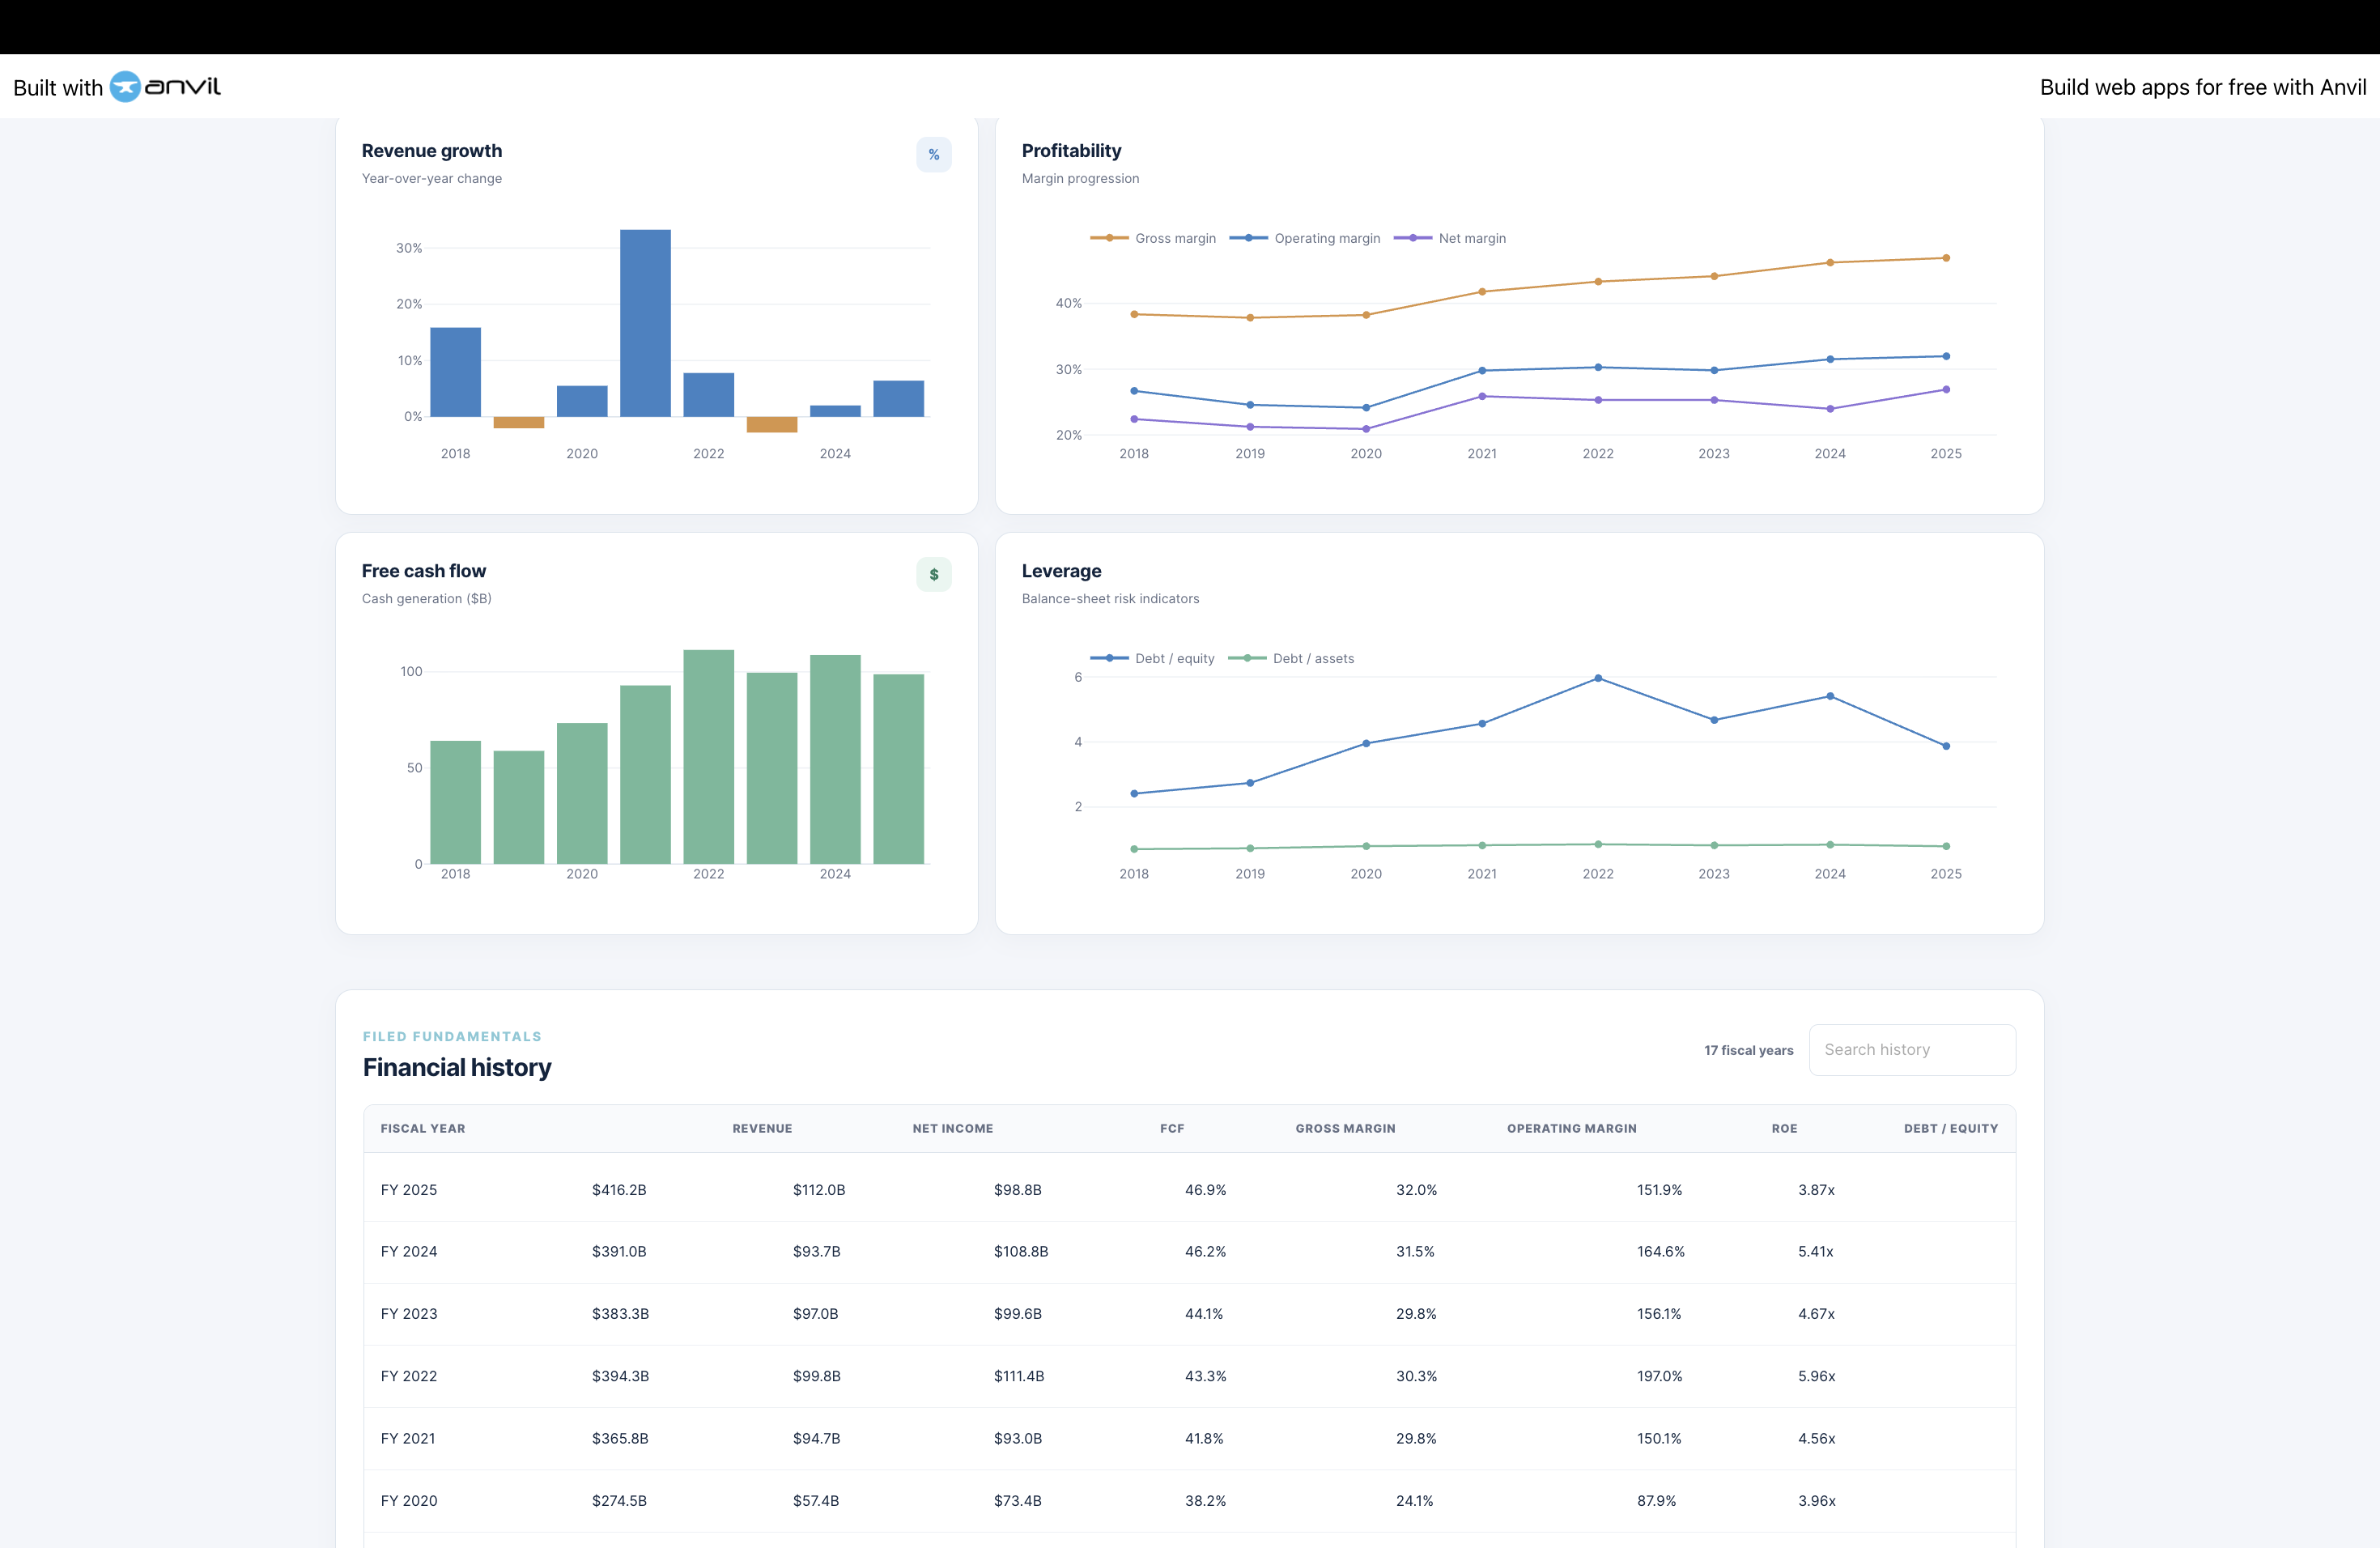
Financial Trend Analysis — Processes historical SEC data
-
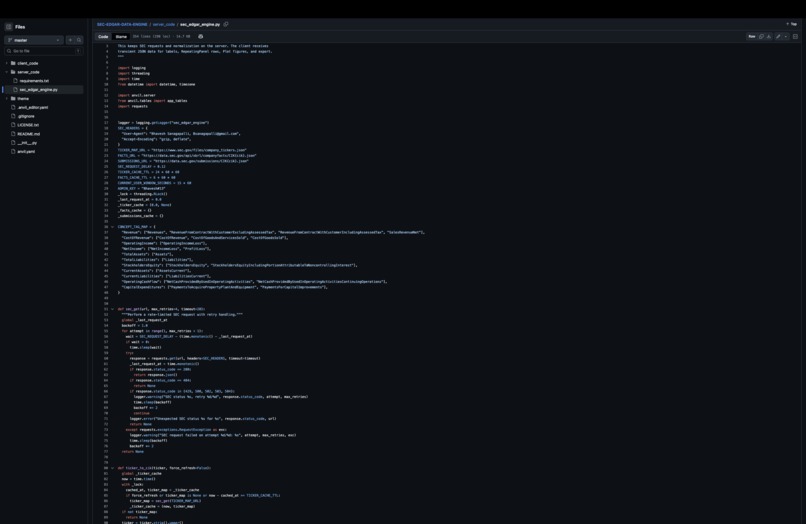
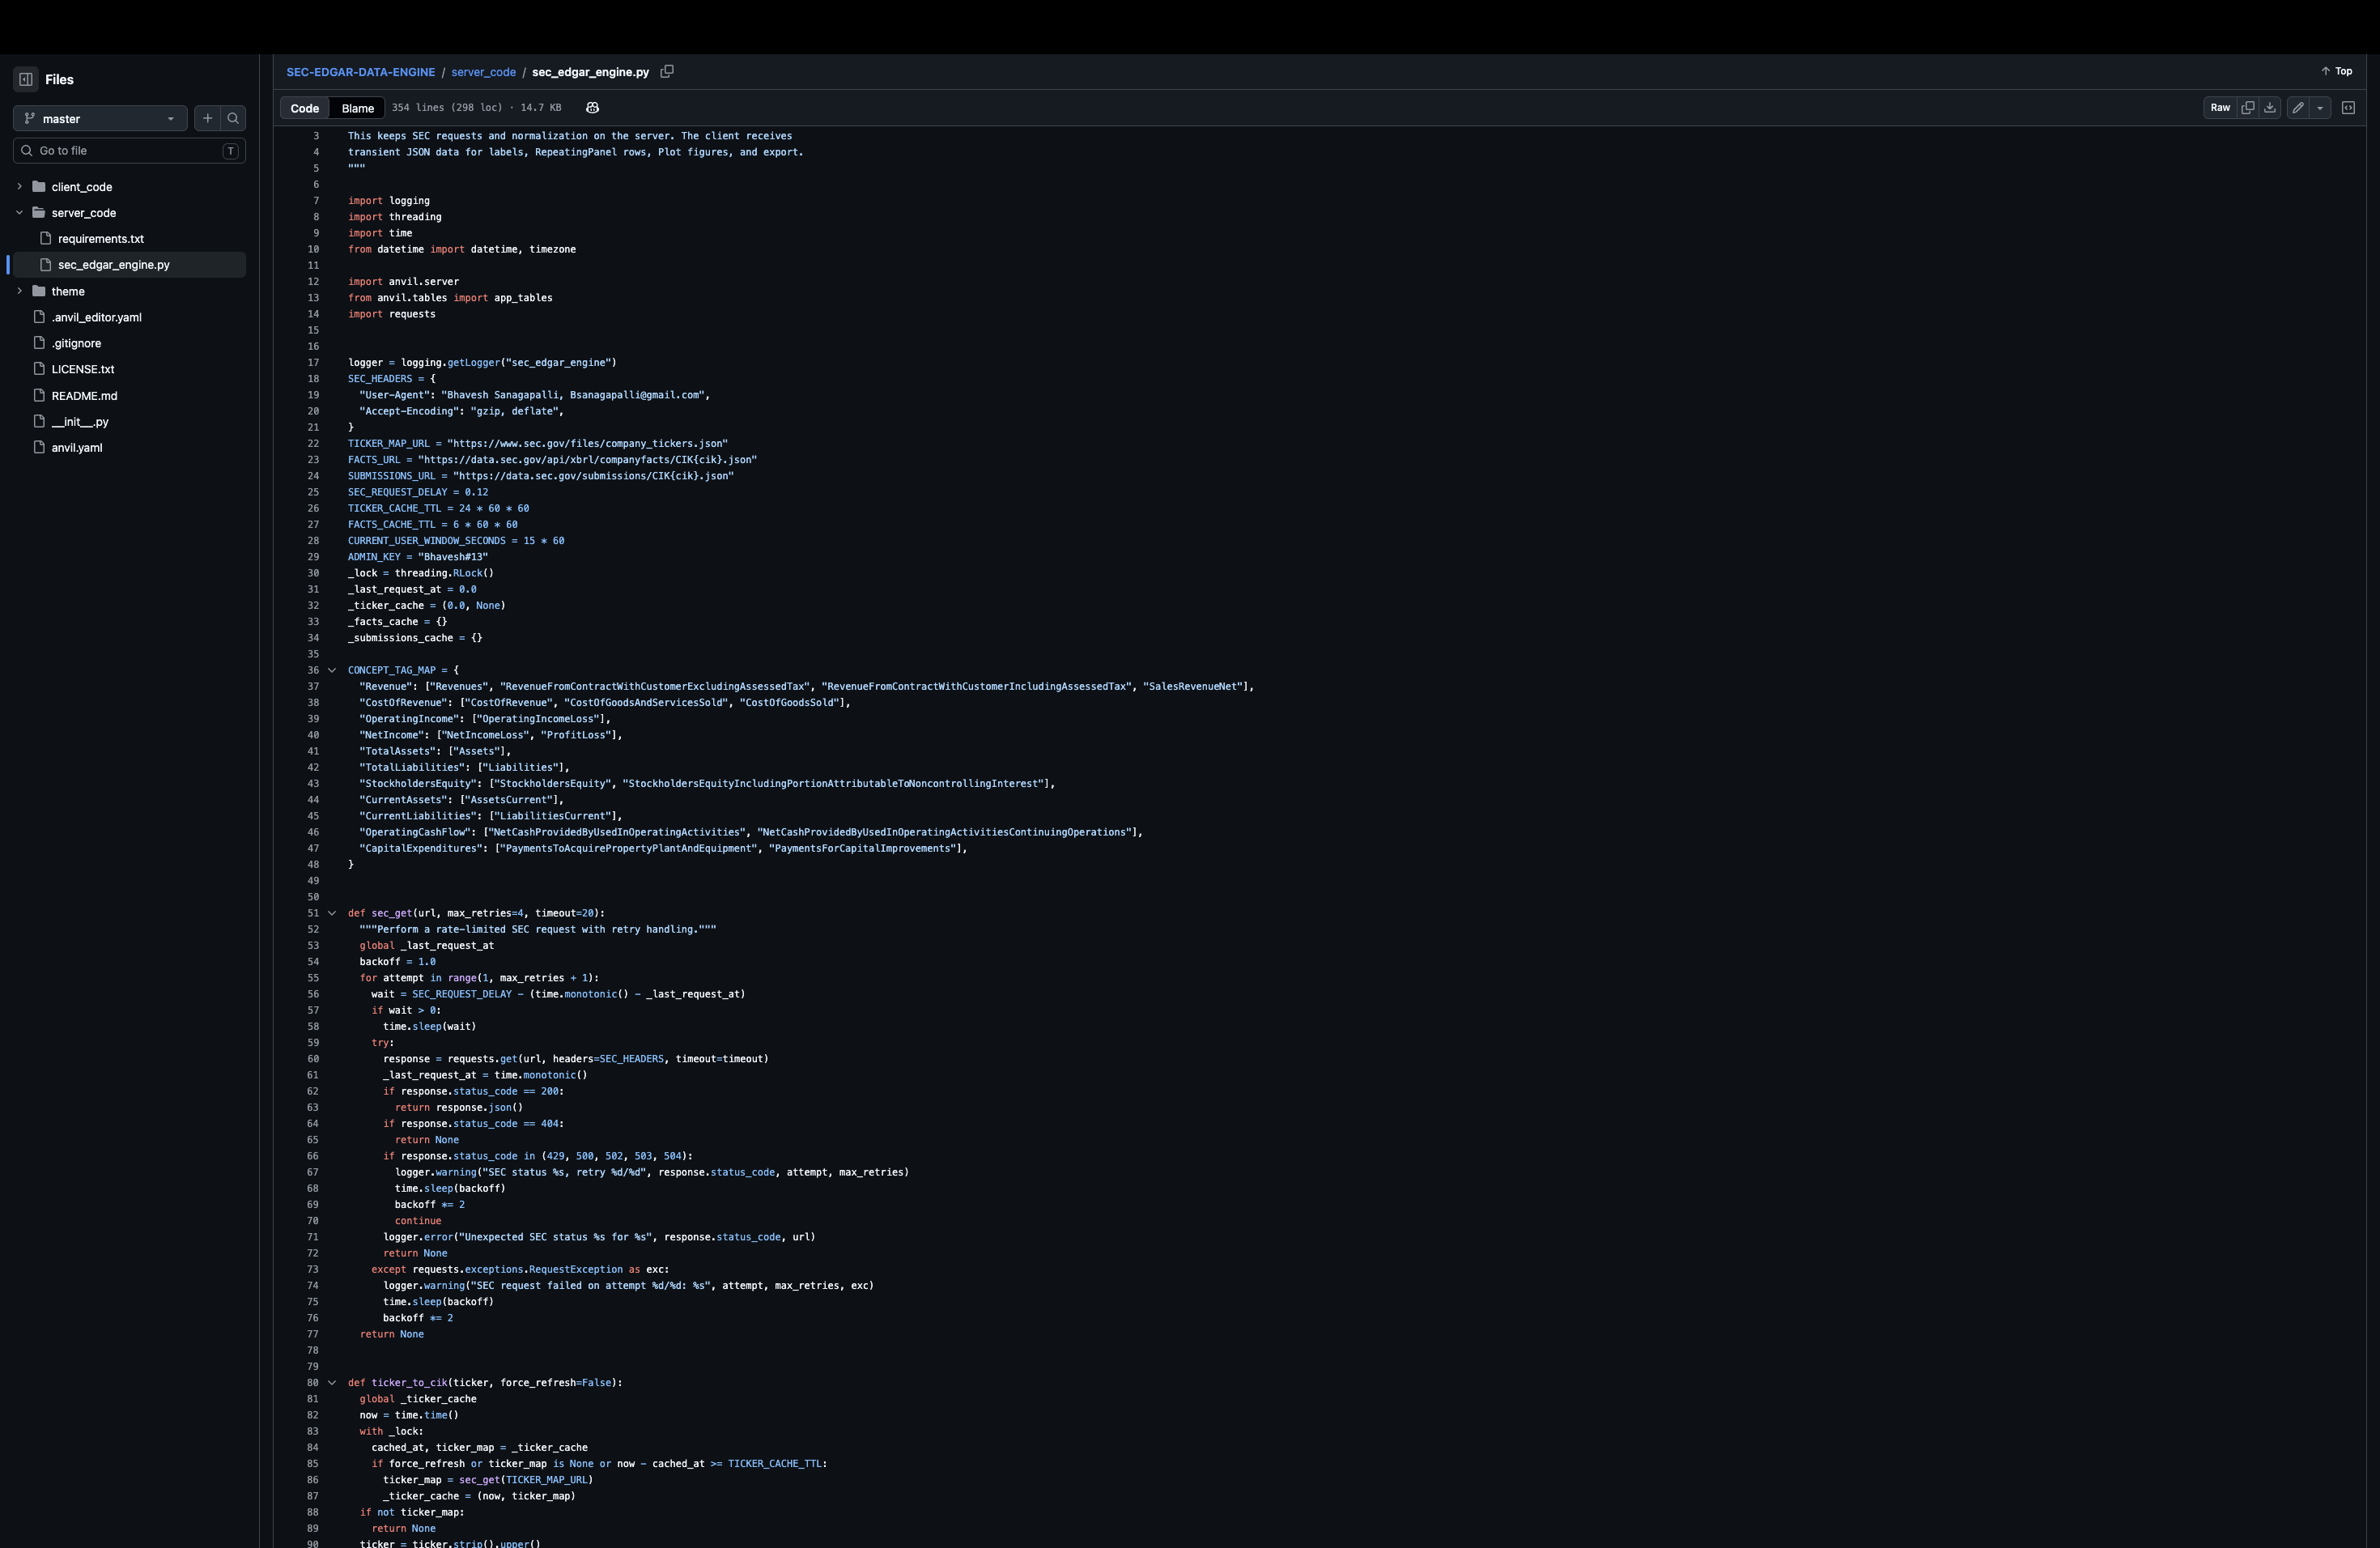
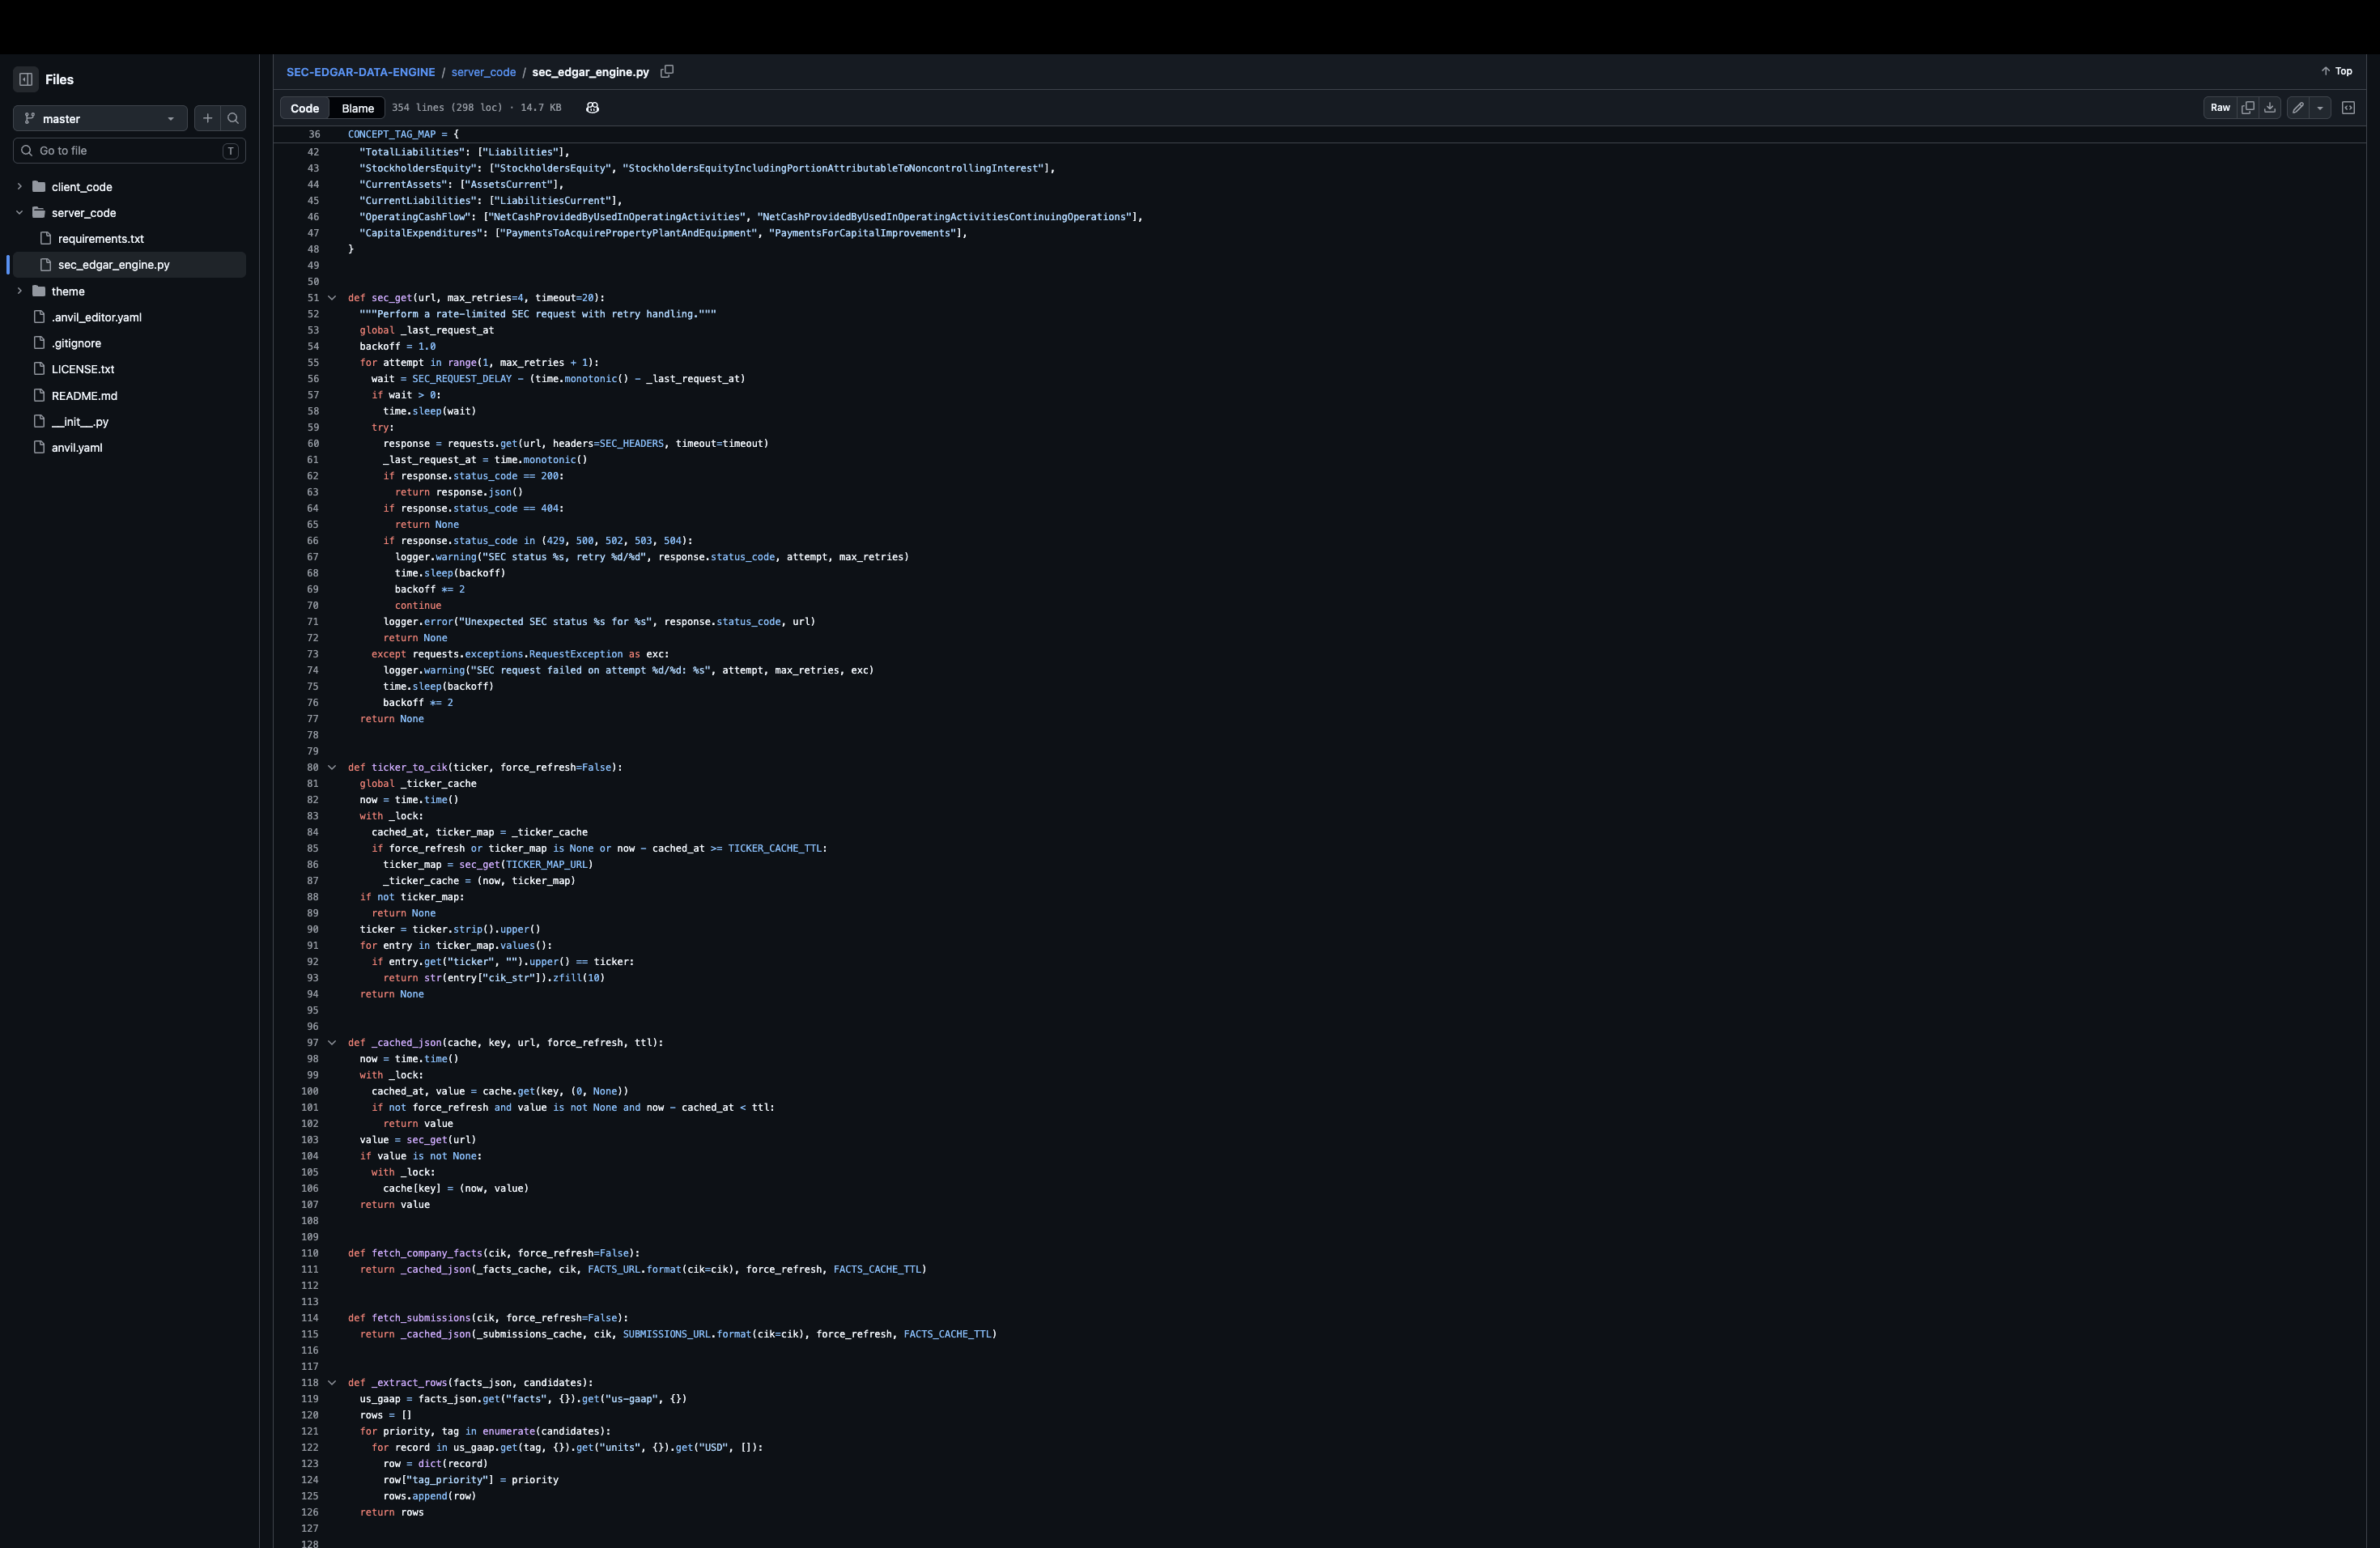
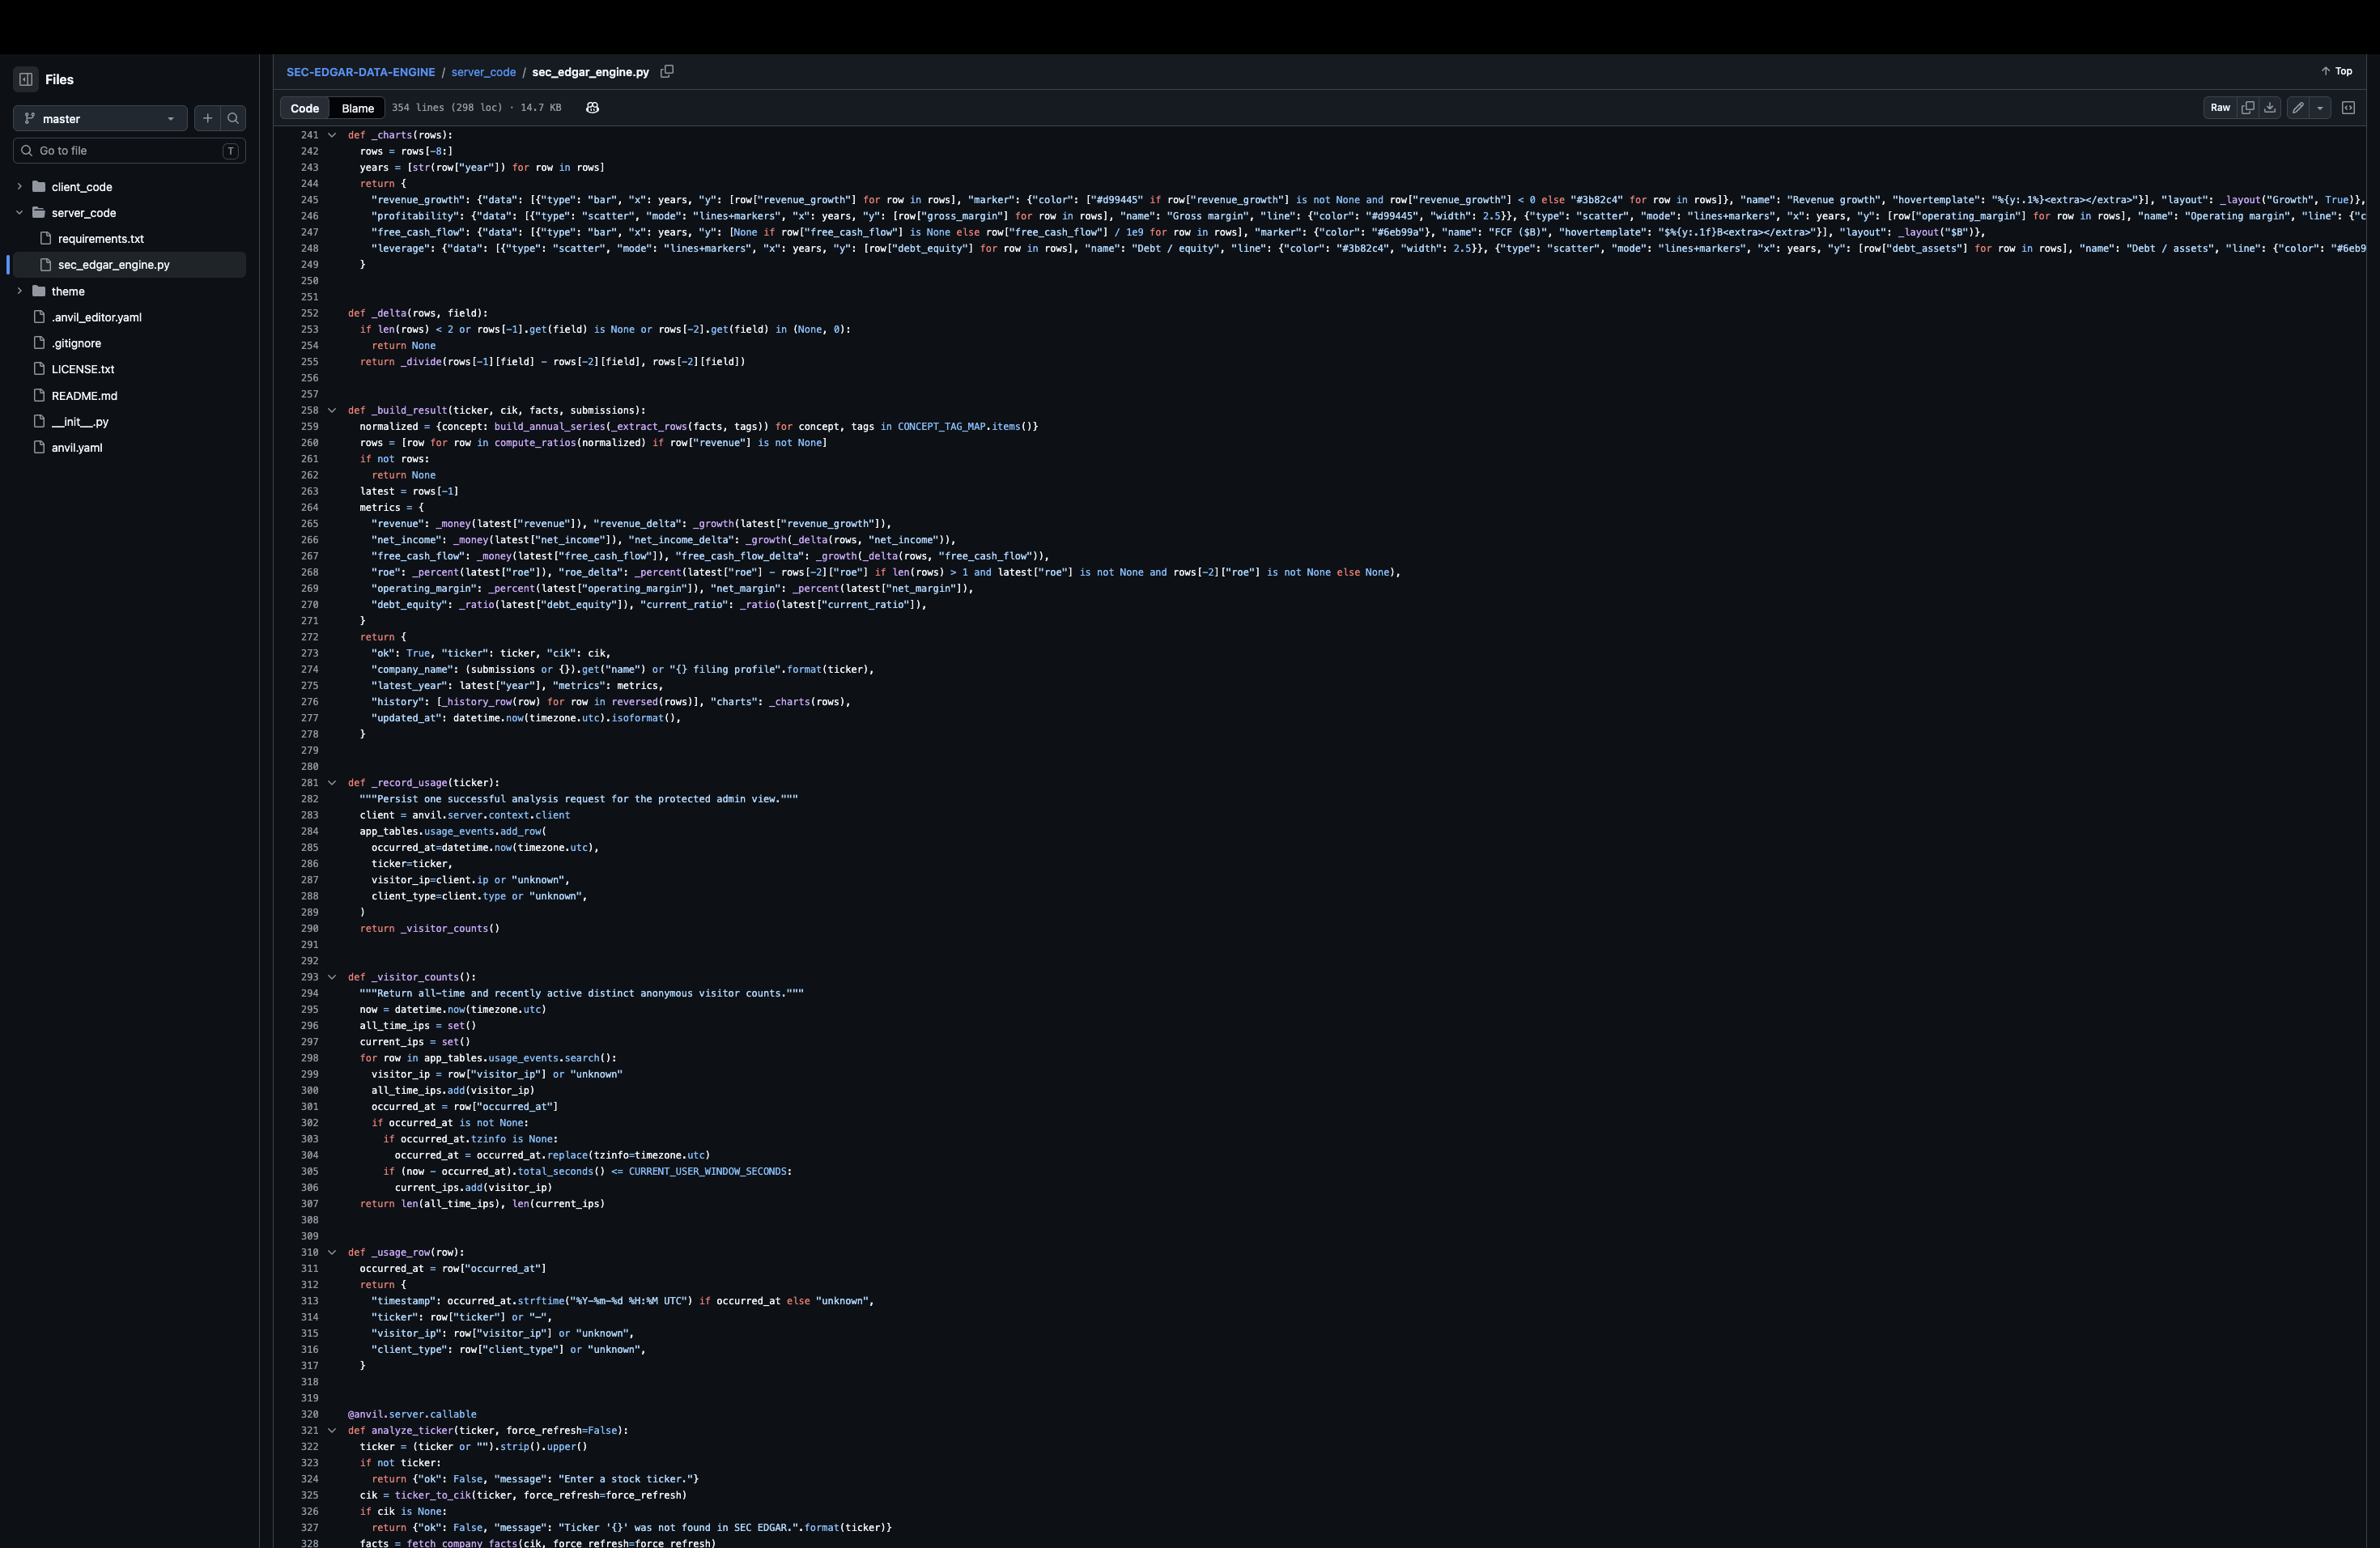
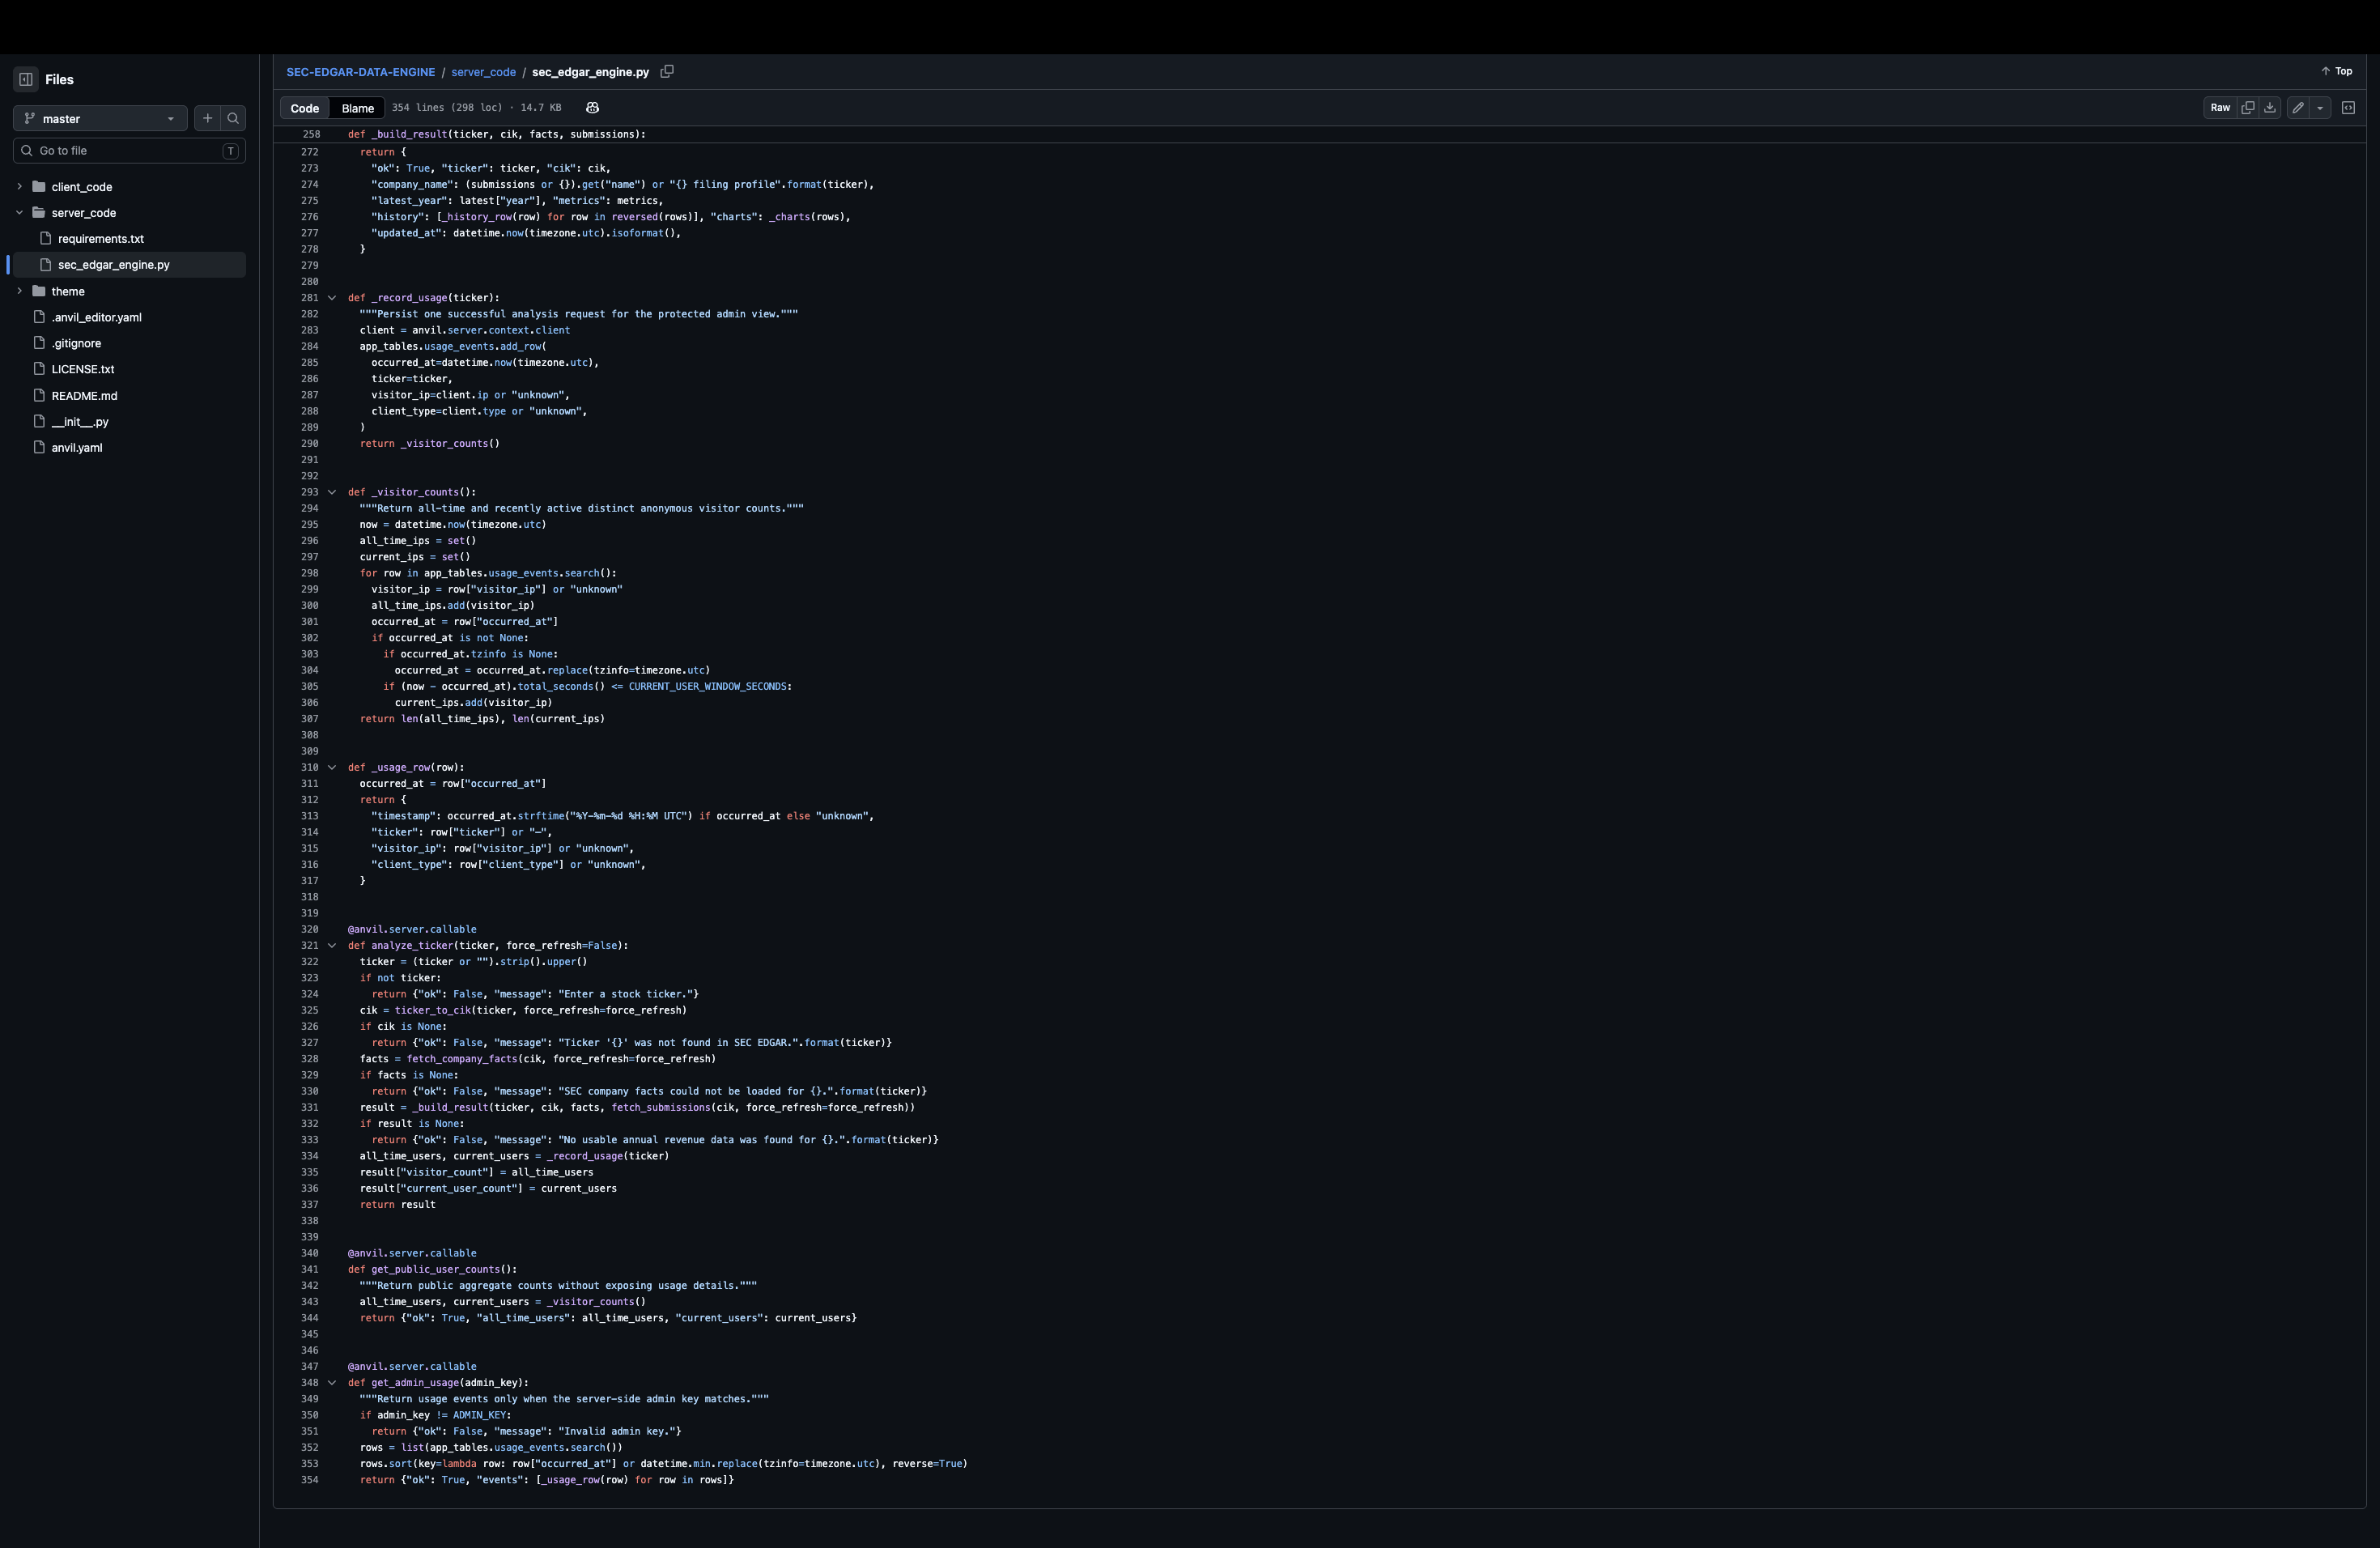
SEC Data Pipeline — Retrieves and processes public SEC data
-
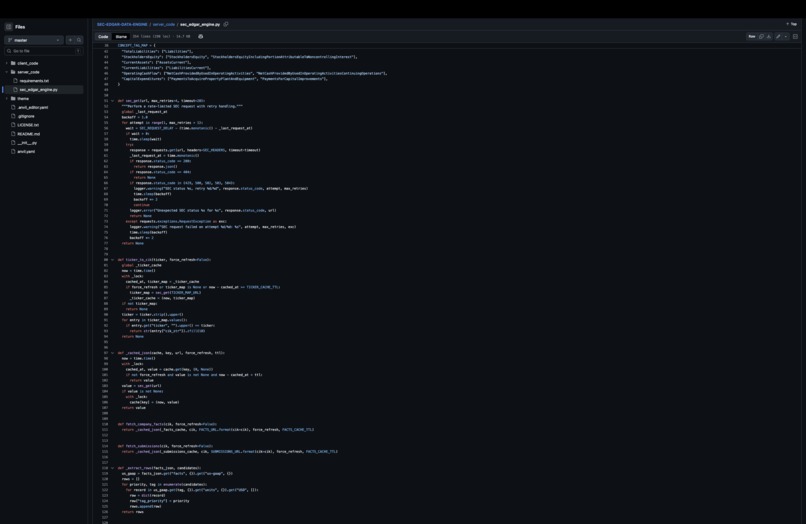
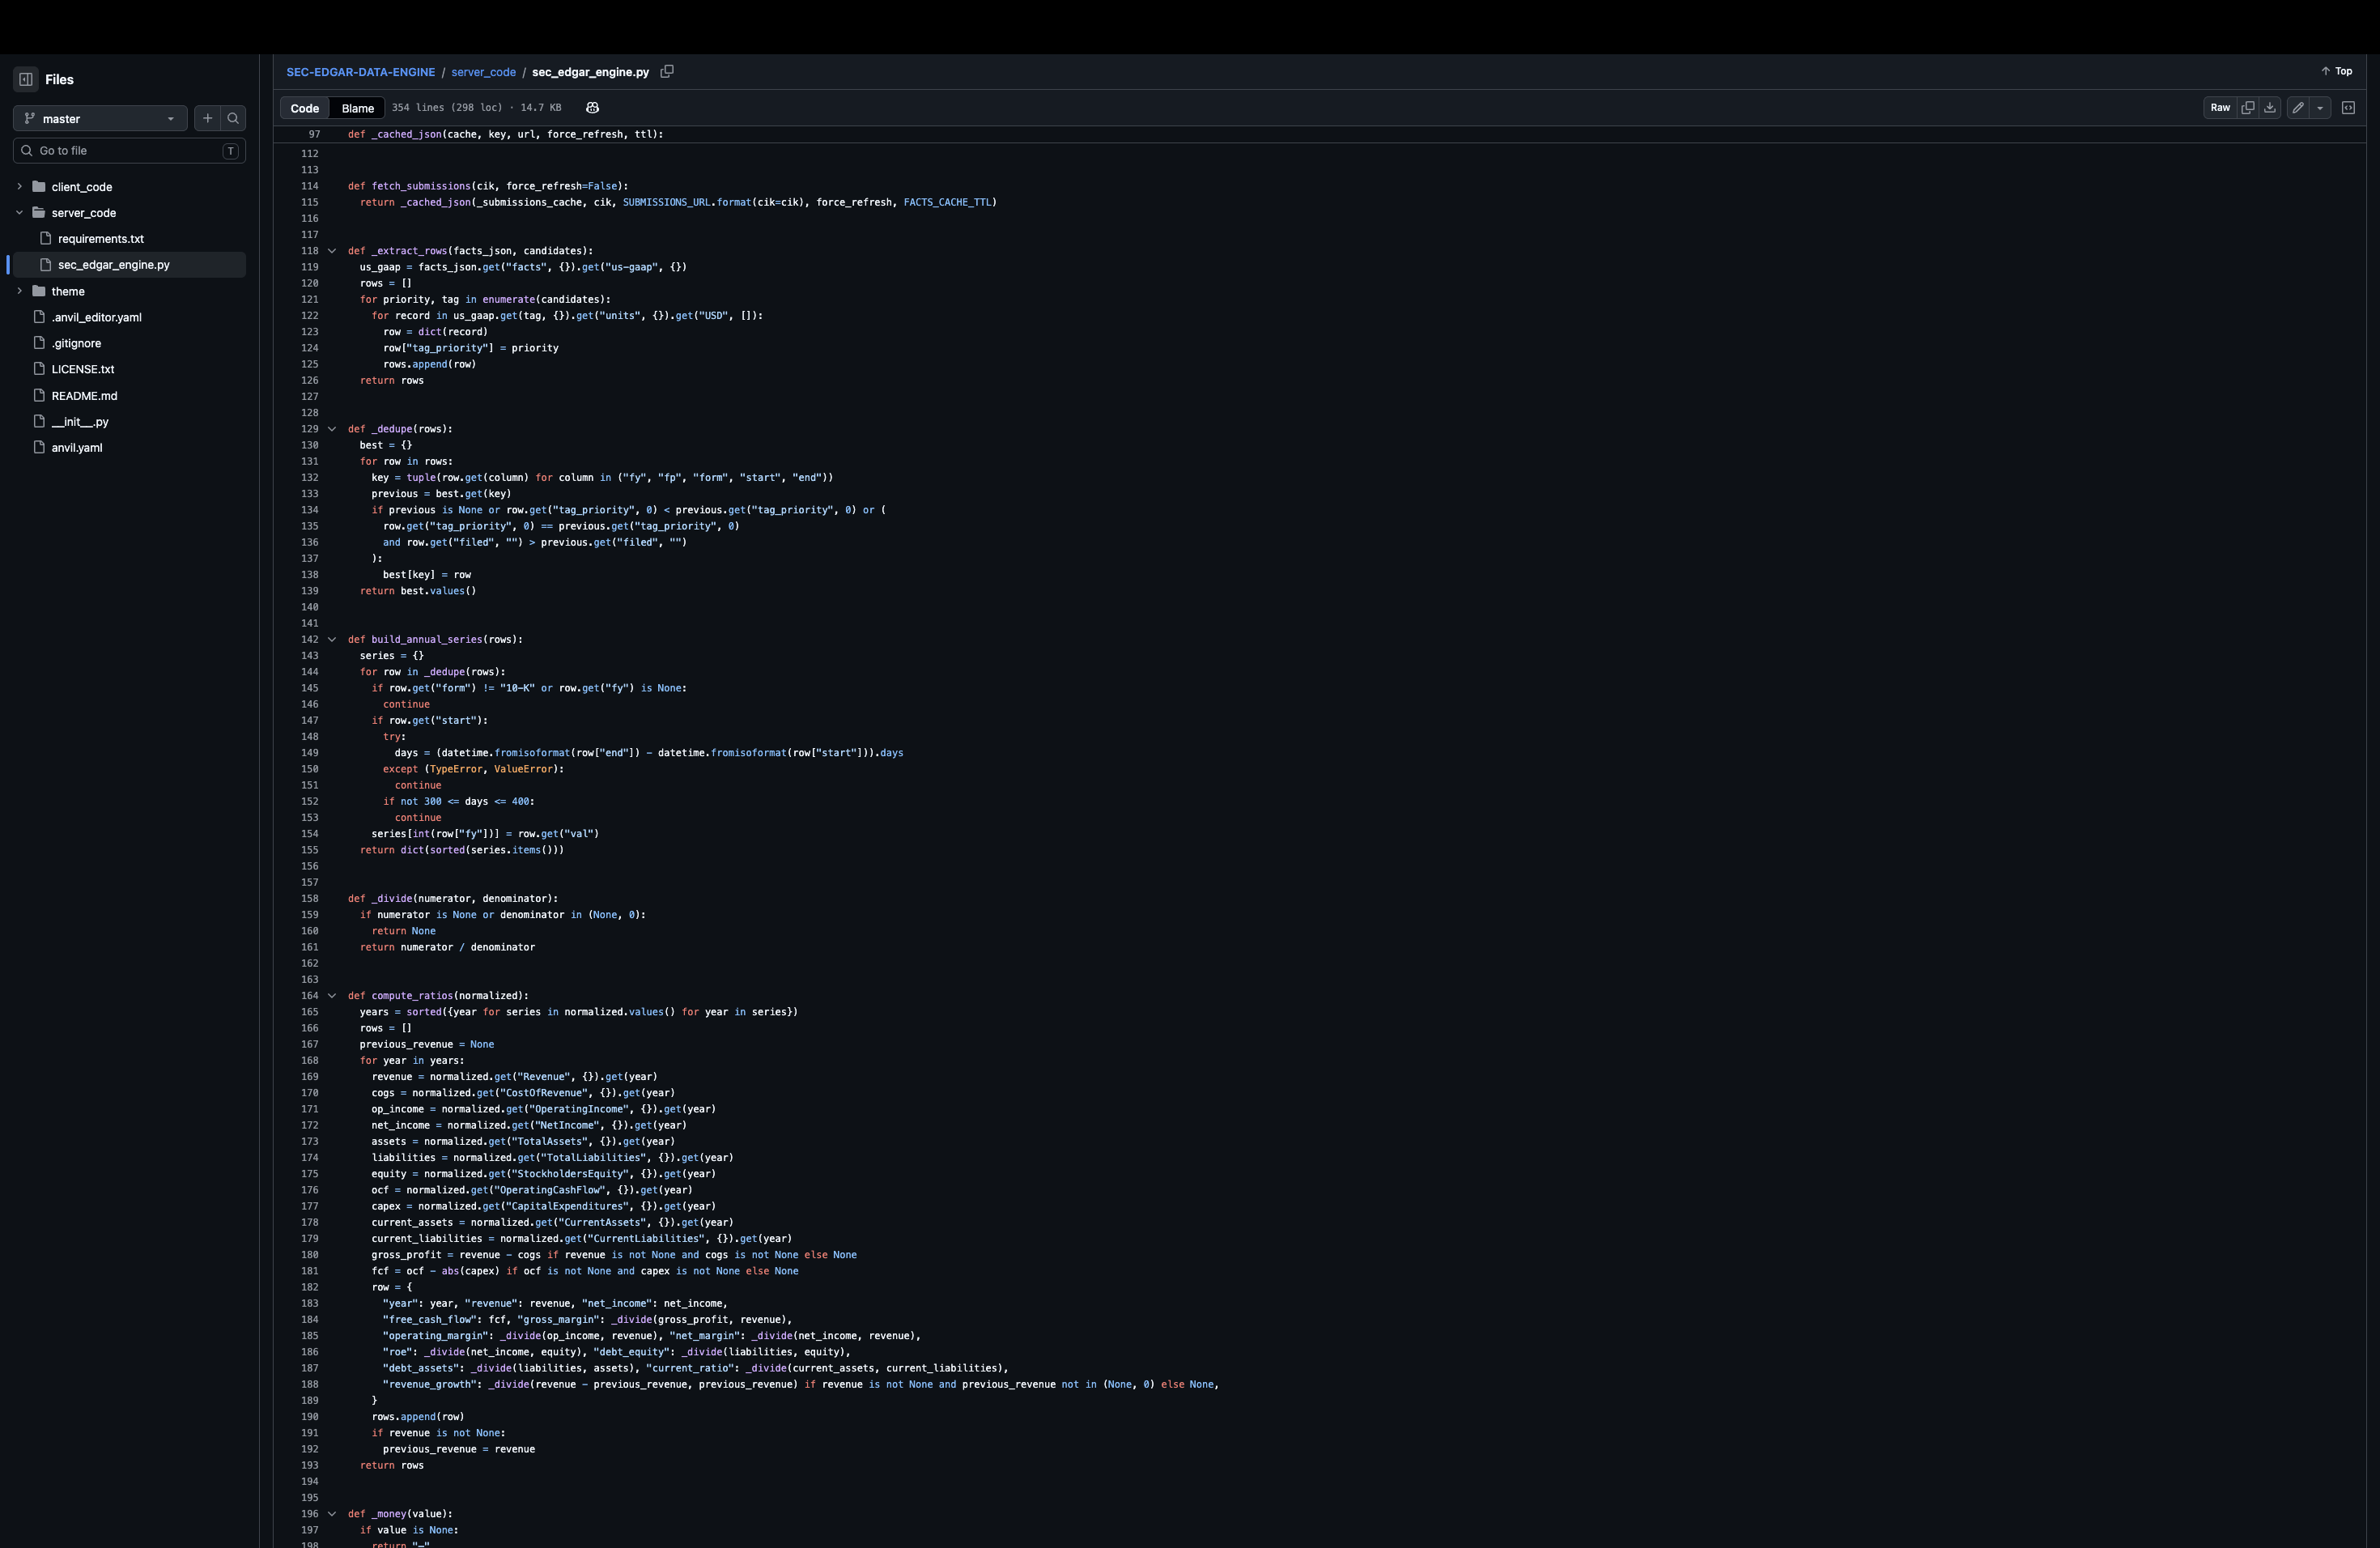
SEC Data Pipeline — Retrieves and processes public SEC data
-
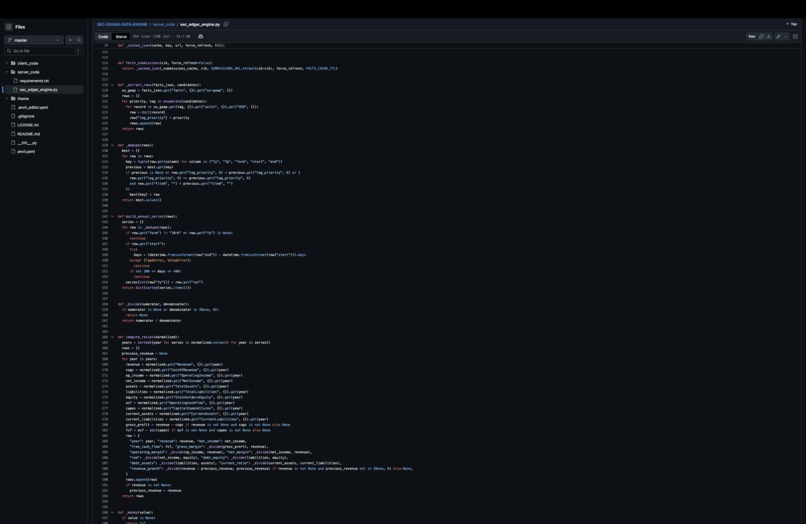
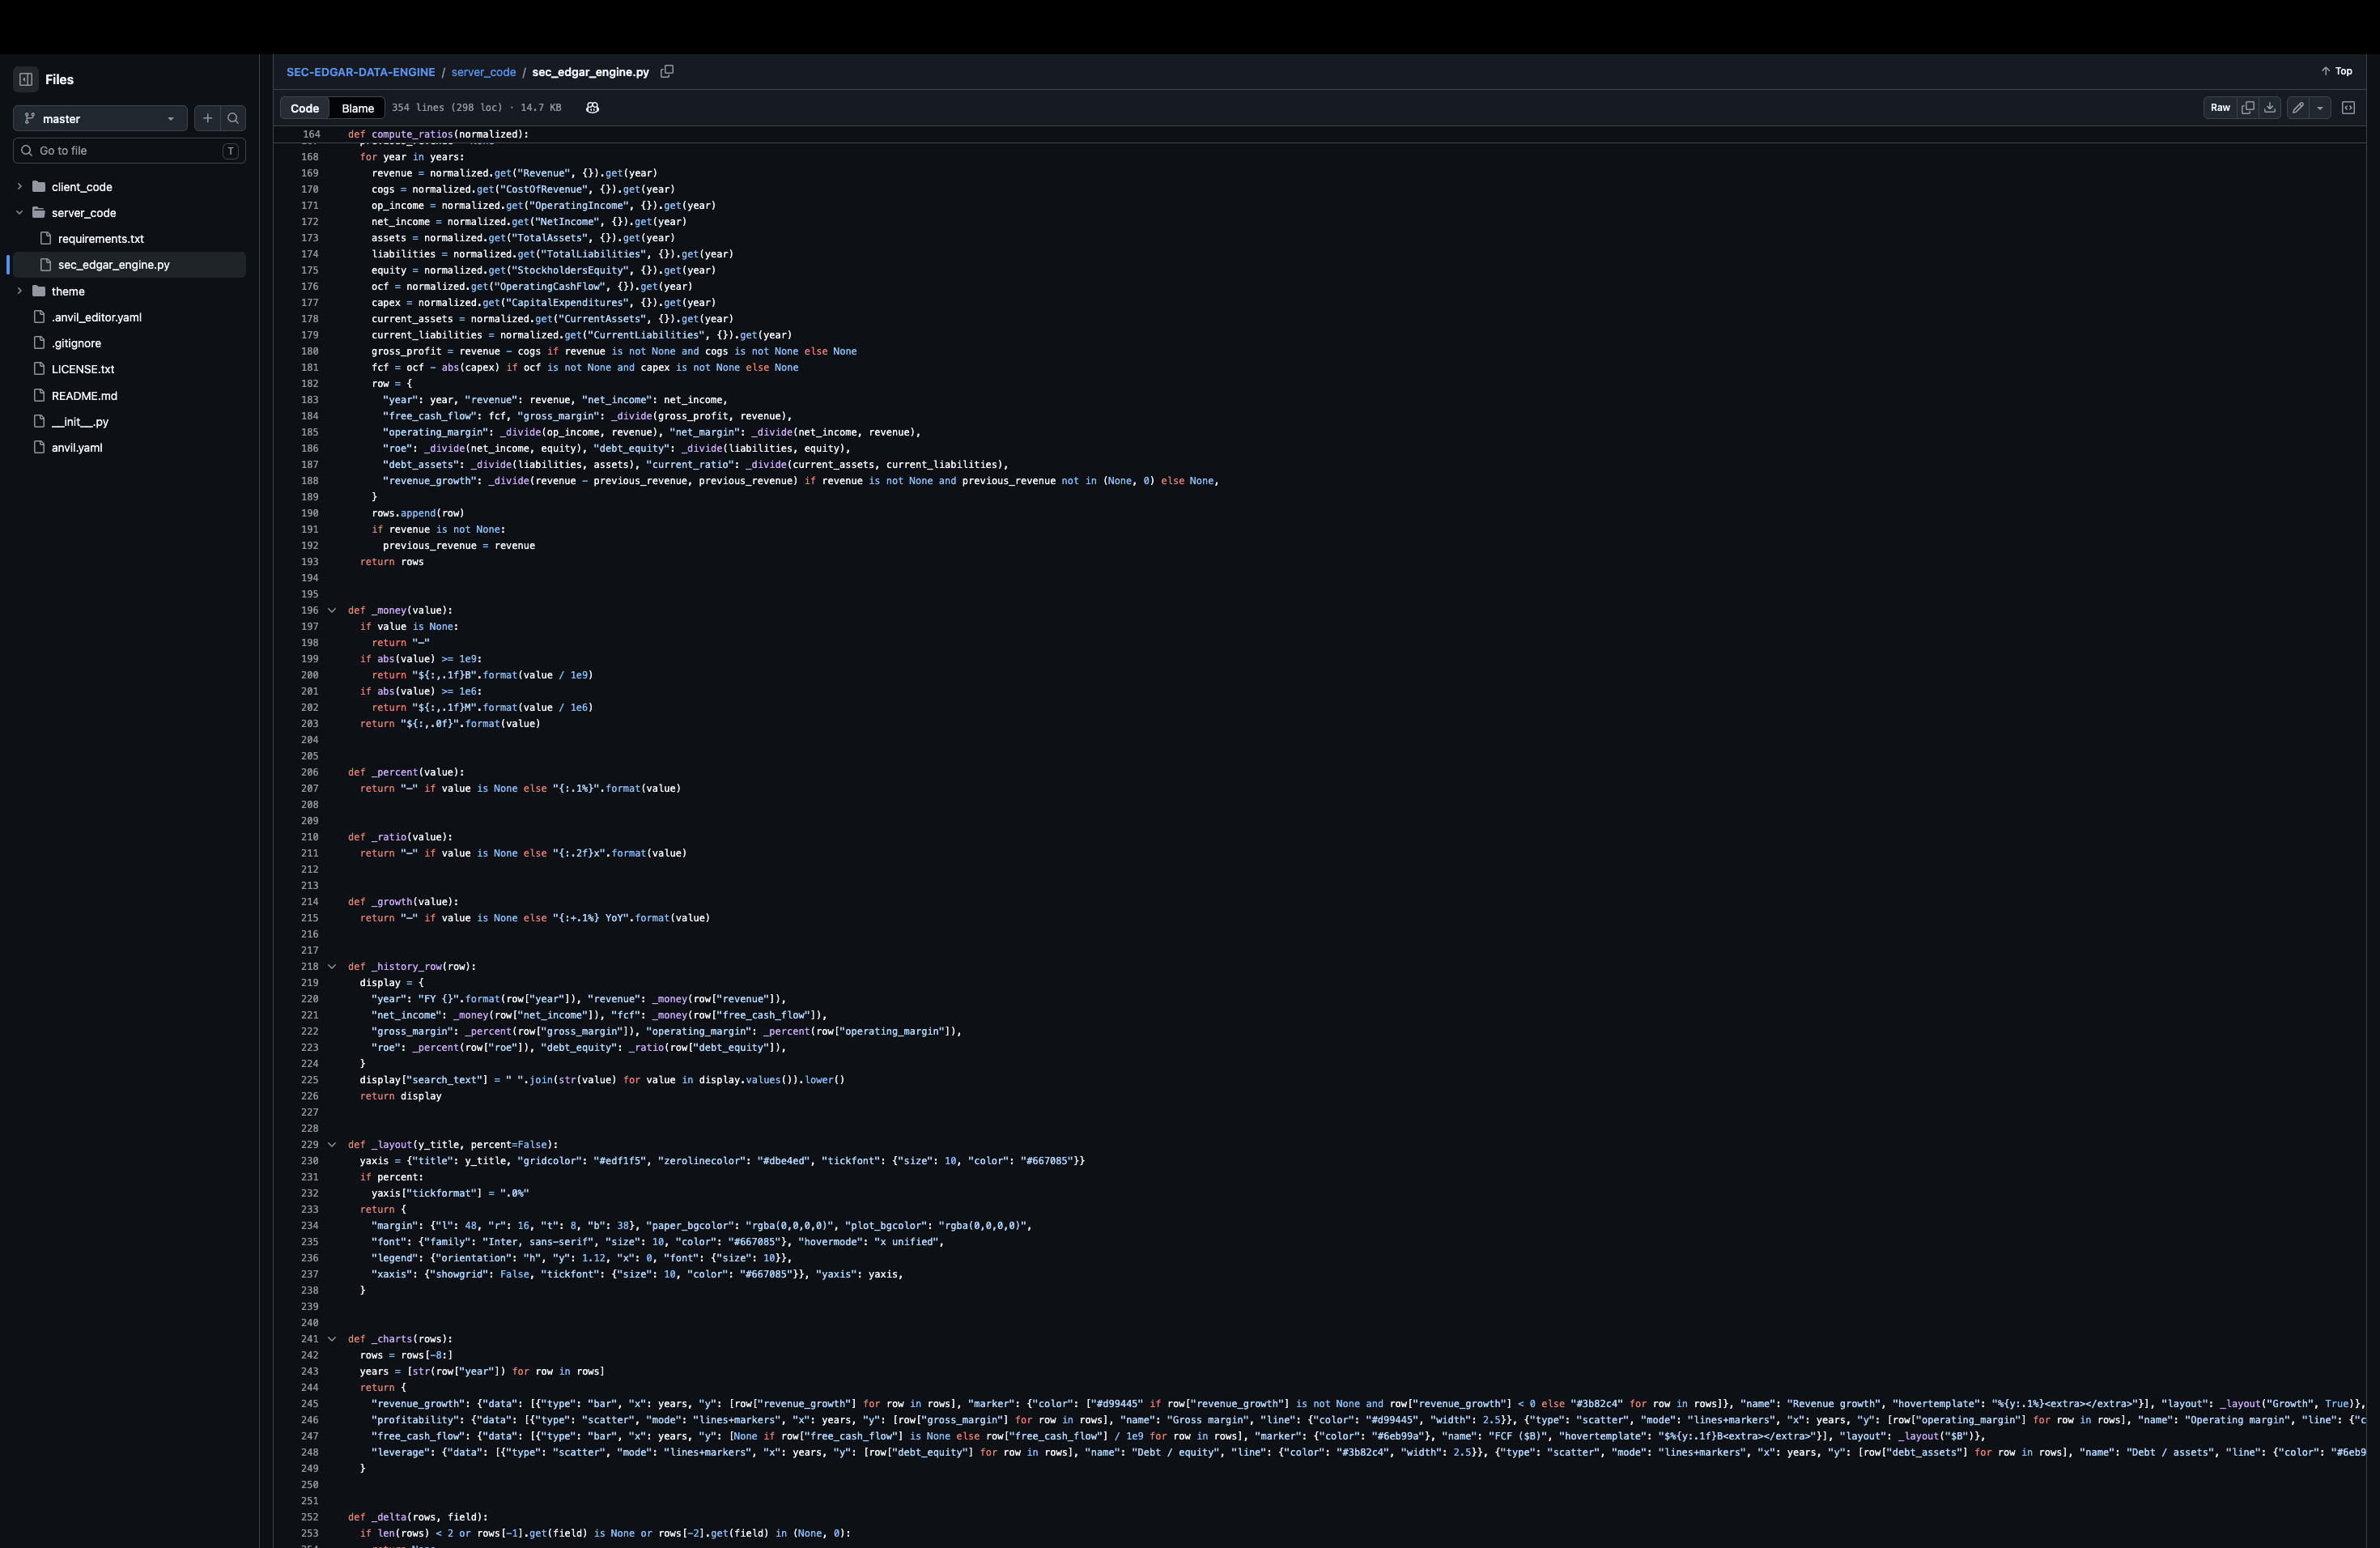
SEC Data Pipeline — Retrieves and processes public SEC data
-
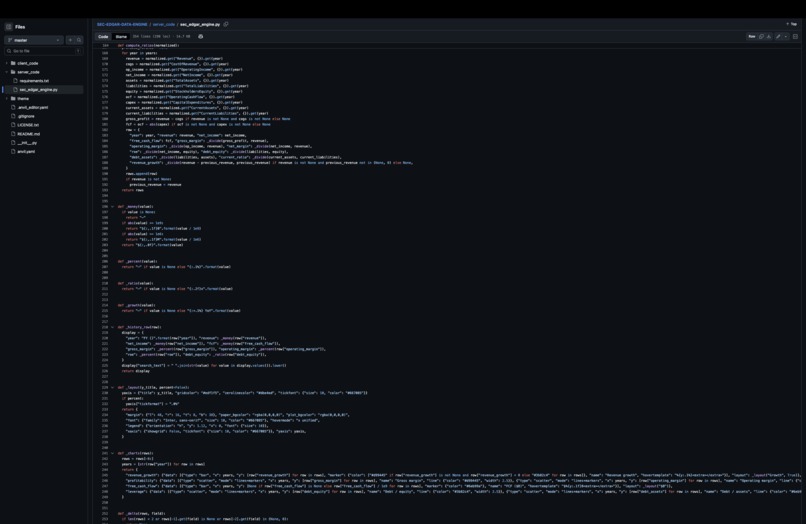
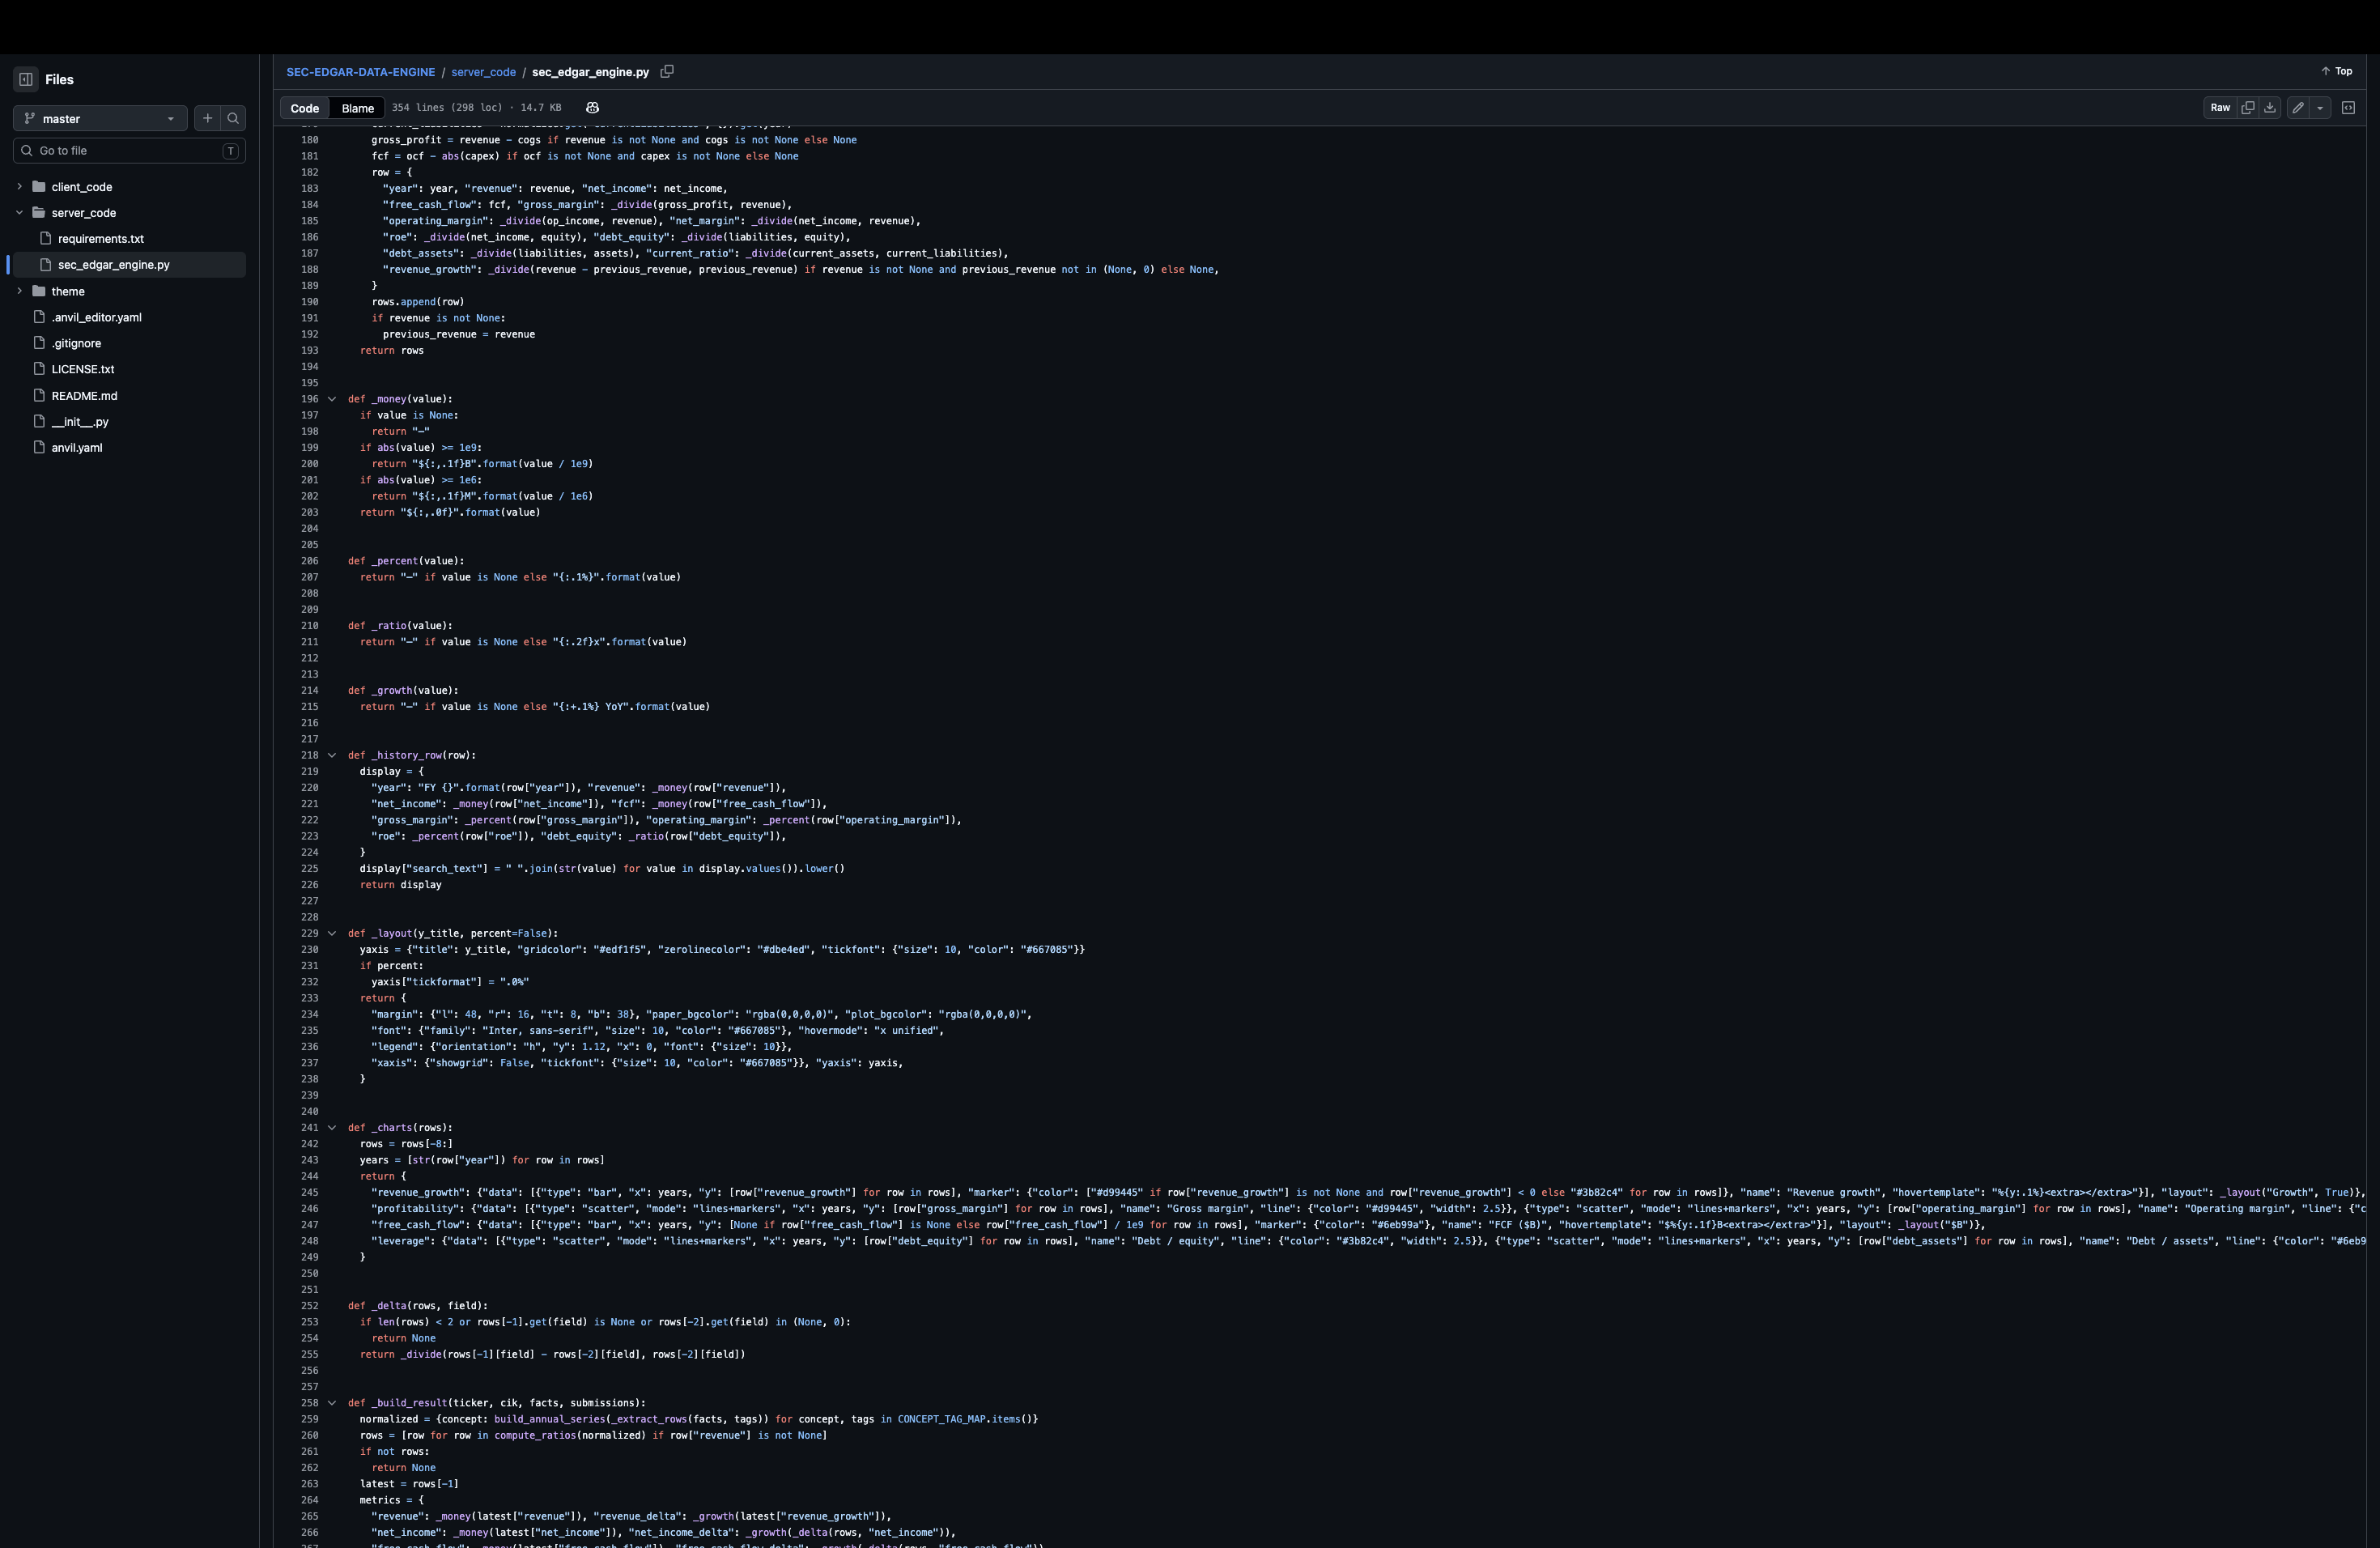
SEC Data Pipeline — Retrieves and processes public SEC data
-
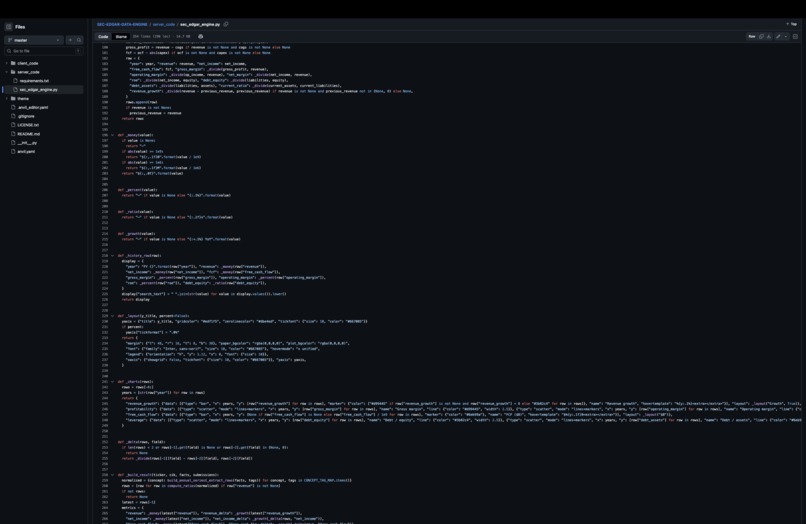
SEC Data Pipeline — Retrieves and processes public SEC data
-
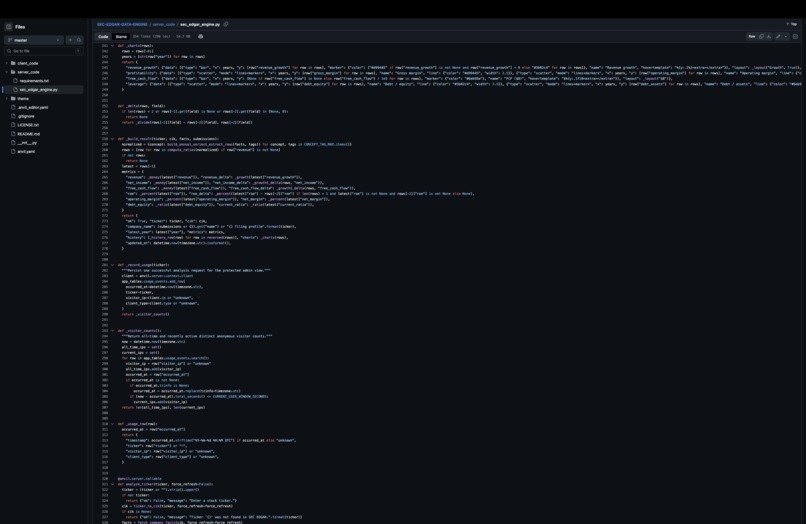
SEC Data Pipeline — Retrieves and processes public SEC data
-
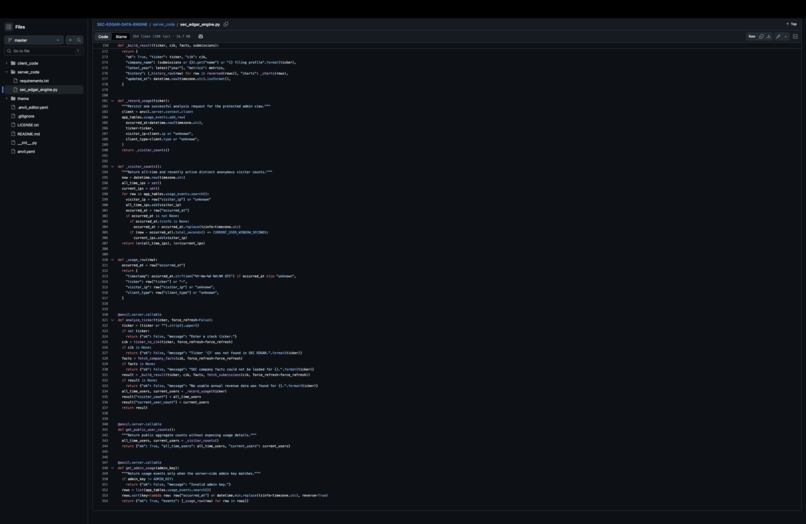
SEC Data Pipeline — Retrieves and processes public SEC data
Inspiration
I wanted to build a finance project that uses real financial data instead of relying on manually entered information or basic stock-price charts. I found the SEC EDGAR database and realized that it provides a large amount of public financial information directly from company filings. However, the raw data can be difficult to understand and work with, so I wanted to create a system that could turn it into useful financial insights.
What it does
SEC EDGAR Fundamental Data Engine allows users to enter a company ticker and analyze its financial information using data from the SEC.
The system retrieves and processes financial data and calculates metrics including:
Revenue Net Income Free Cash Flow Return on Equity Operating Margin Net Margin Debt-to-Equity Current Ratio
The results are displayed through an interactive dashboard with charts, financial history, and downloadable data.
How I built it
I built the project primarily with Python, using libraries such as Pandas, NumPy, Requests, and SQLite. The system connects to the SEC EDGAR API, identifies the company, retrieves its financial data, and processes the information into a consistent format.
I then built a Streamlit interface that allows users to enter a ticker and interact with the results without needing to work directly with the underlying code.
Challenges I ran into
One of my biggest challenges was working with raw SEC data. Companies can report similar financial information using different XBRL concepts and formats, so the data needed to be cleaned and normalized before it could be analyzed.
Another challenge was turning the original data-processing pipeline into a usable web application while keeping the backend organized and reusable.
Accomplishments that I'm proud of
I am proud that I turned raw public SEC data into a working financial analysis system. Instead of simply displaying existing stock information, my project actually retrieves, processes, and calculates financial metrics from SEC data.
I am also proud of creating an interactive interface that makes the results much easier to understand and explore.
What I learned
I learned how to work with APIs and real-world financial datasets, as well as how to clean and normalize data that is not always consistent.
I also learned more about financial ratios, XBRL, data pipelines, caching, and how to connect a Python backend to an interactive web application.
What's next for SEC EDGAR Fundamental Data Engine
My next goal is to add company comparisons, financial health scoring, additional risk indicators, and more advanced financial trend analysis.
I also want to make the dashboard easier for people without a finance background to understand while continuing to expand the types of financial data the system can analyze.


Log in or sign up for Devpost to join the conversation.