-
-
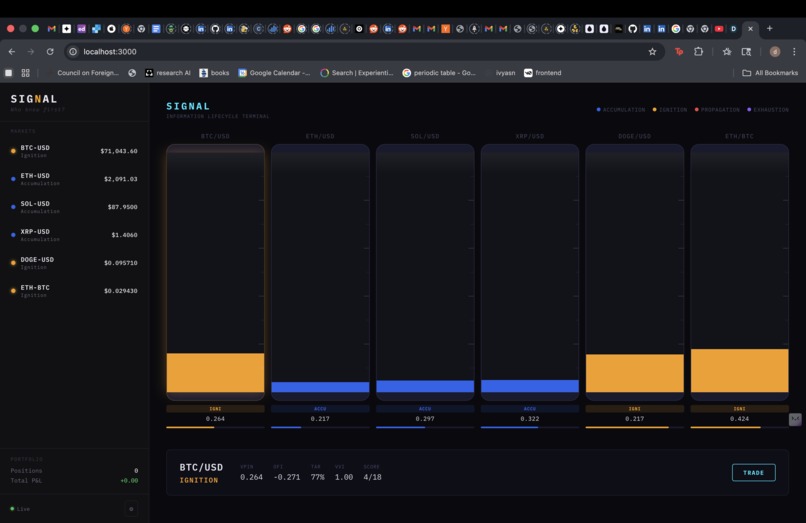
Home Page
-
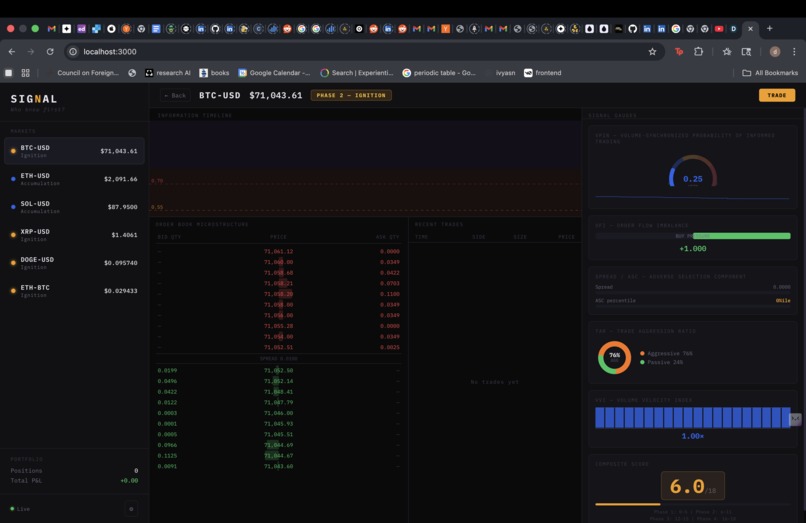
single market page
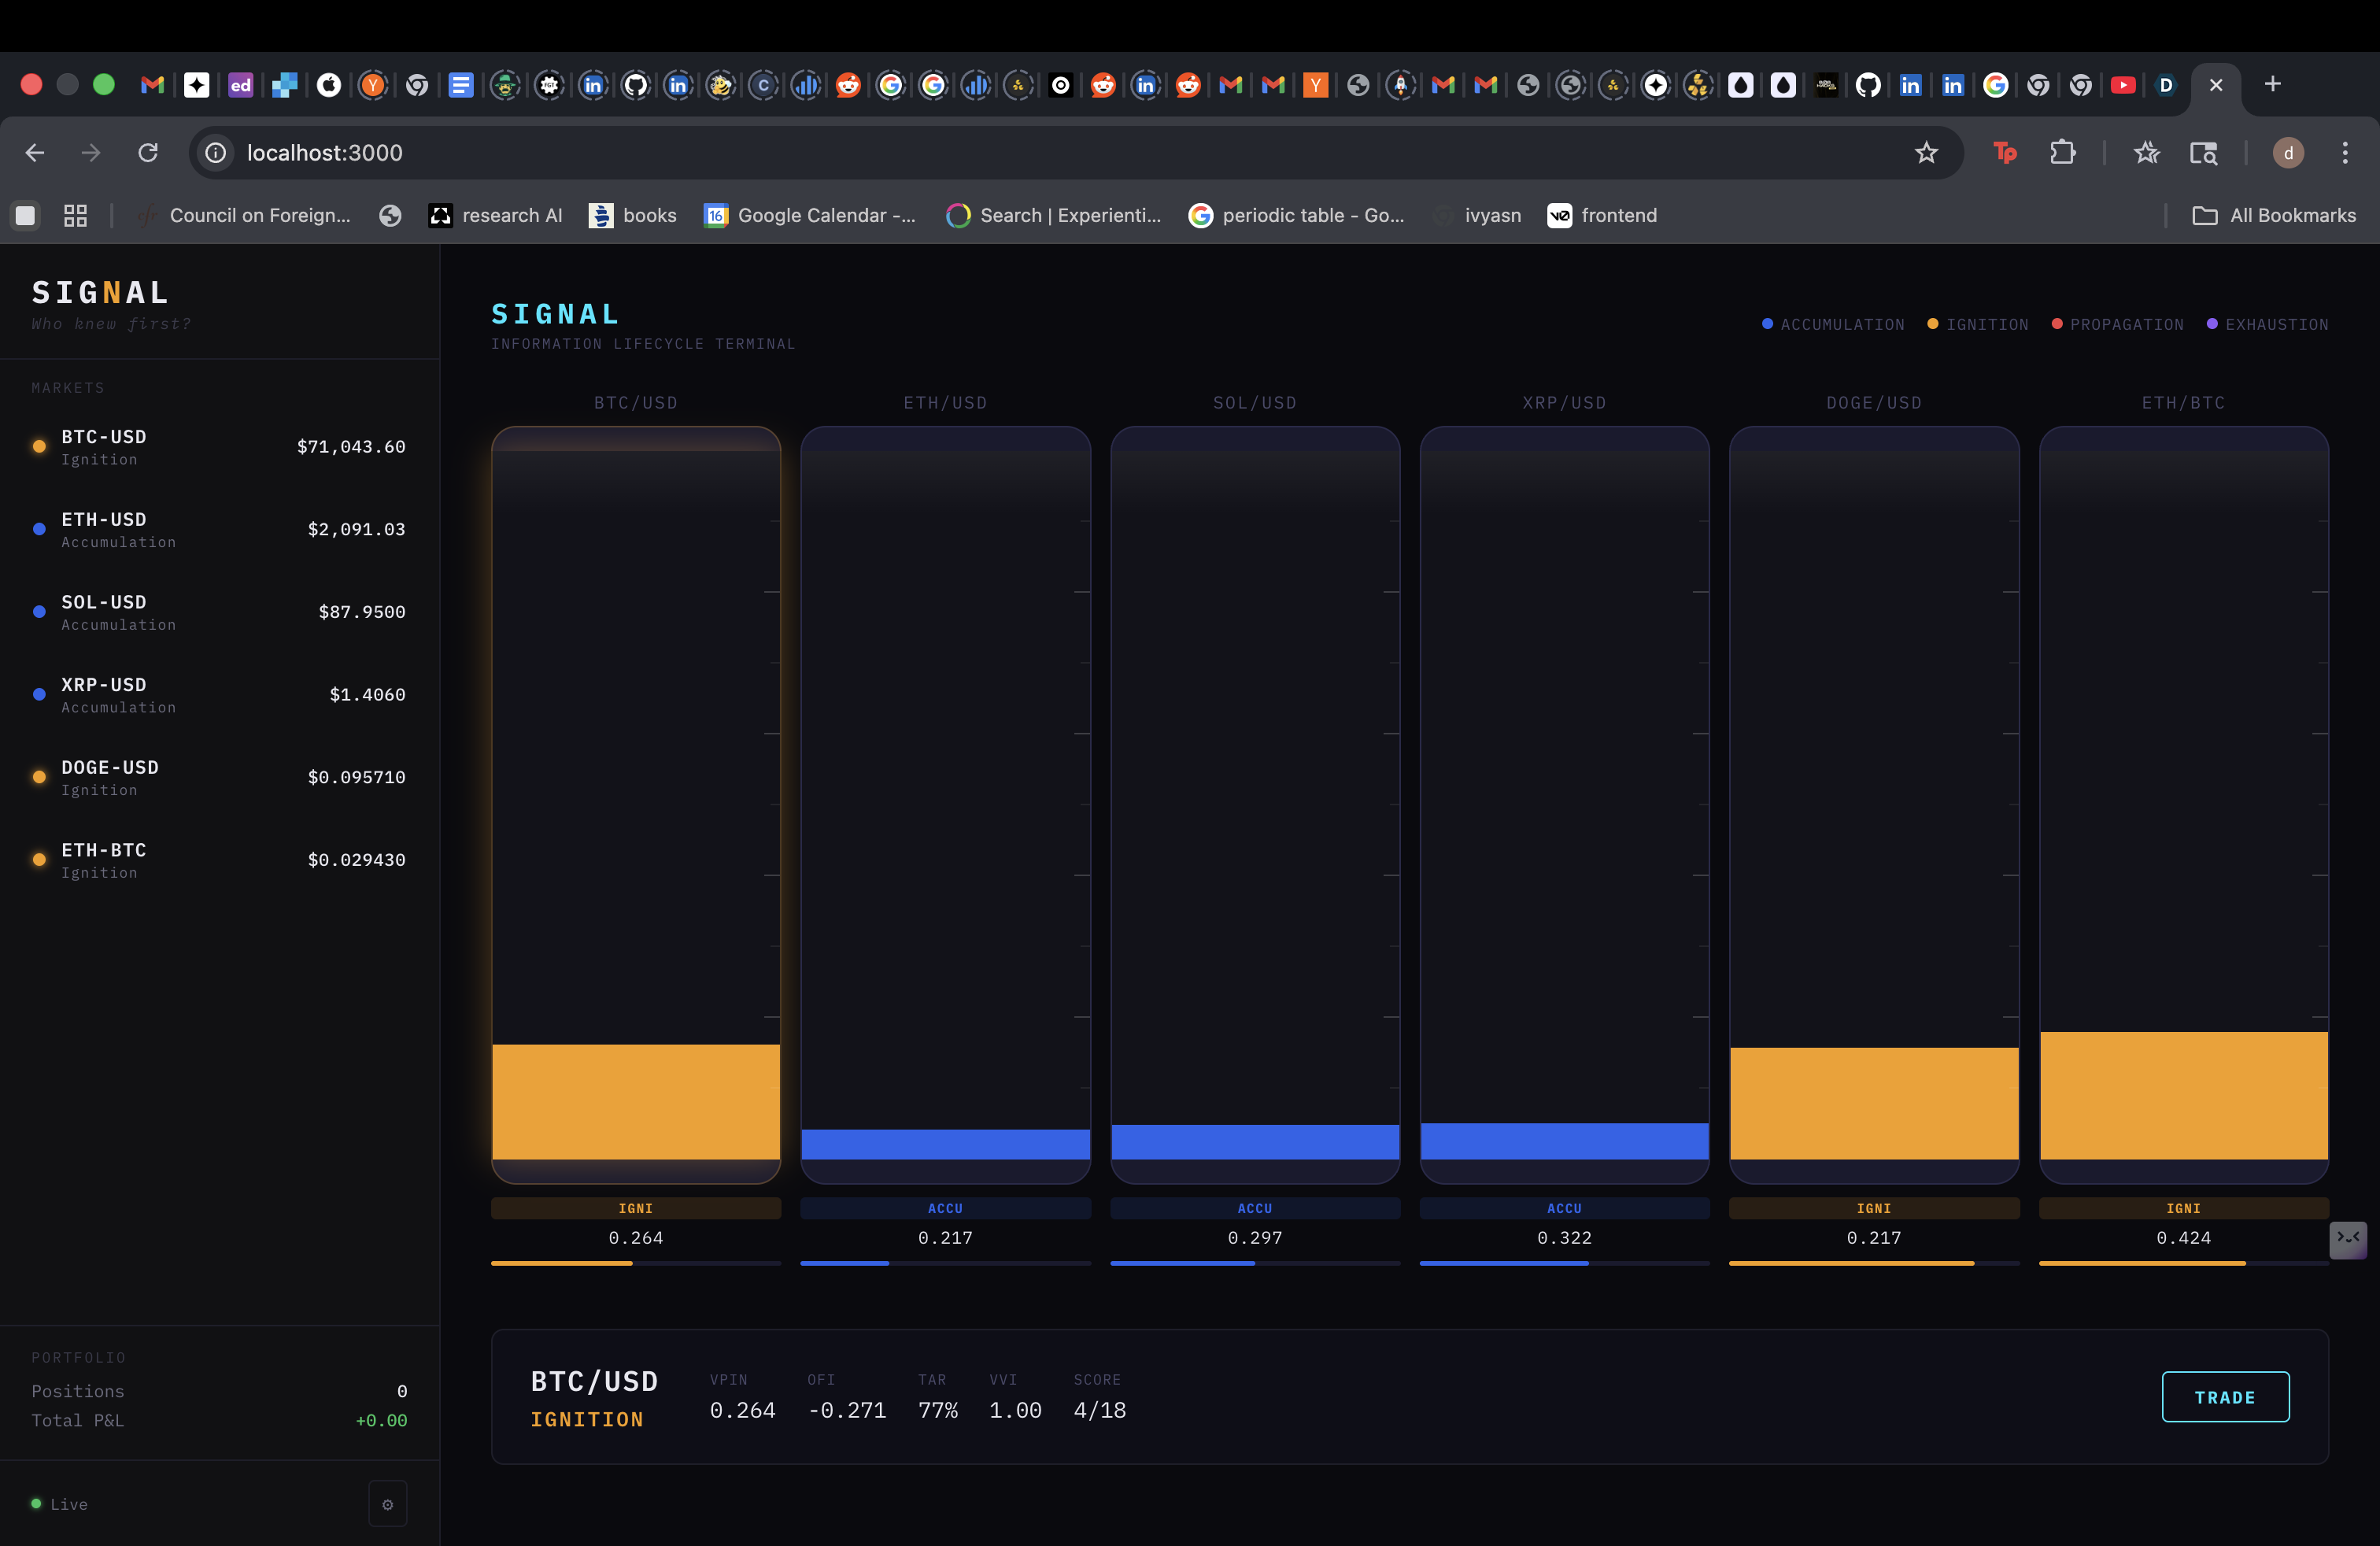
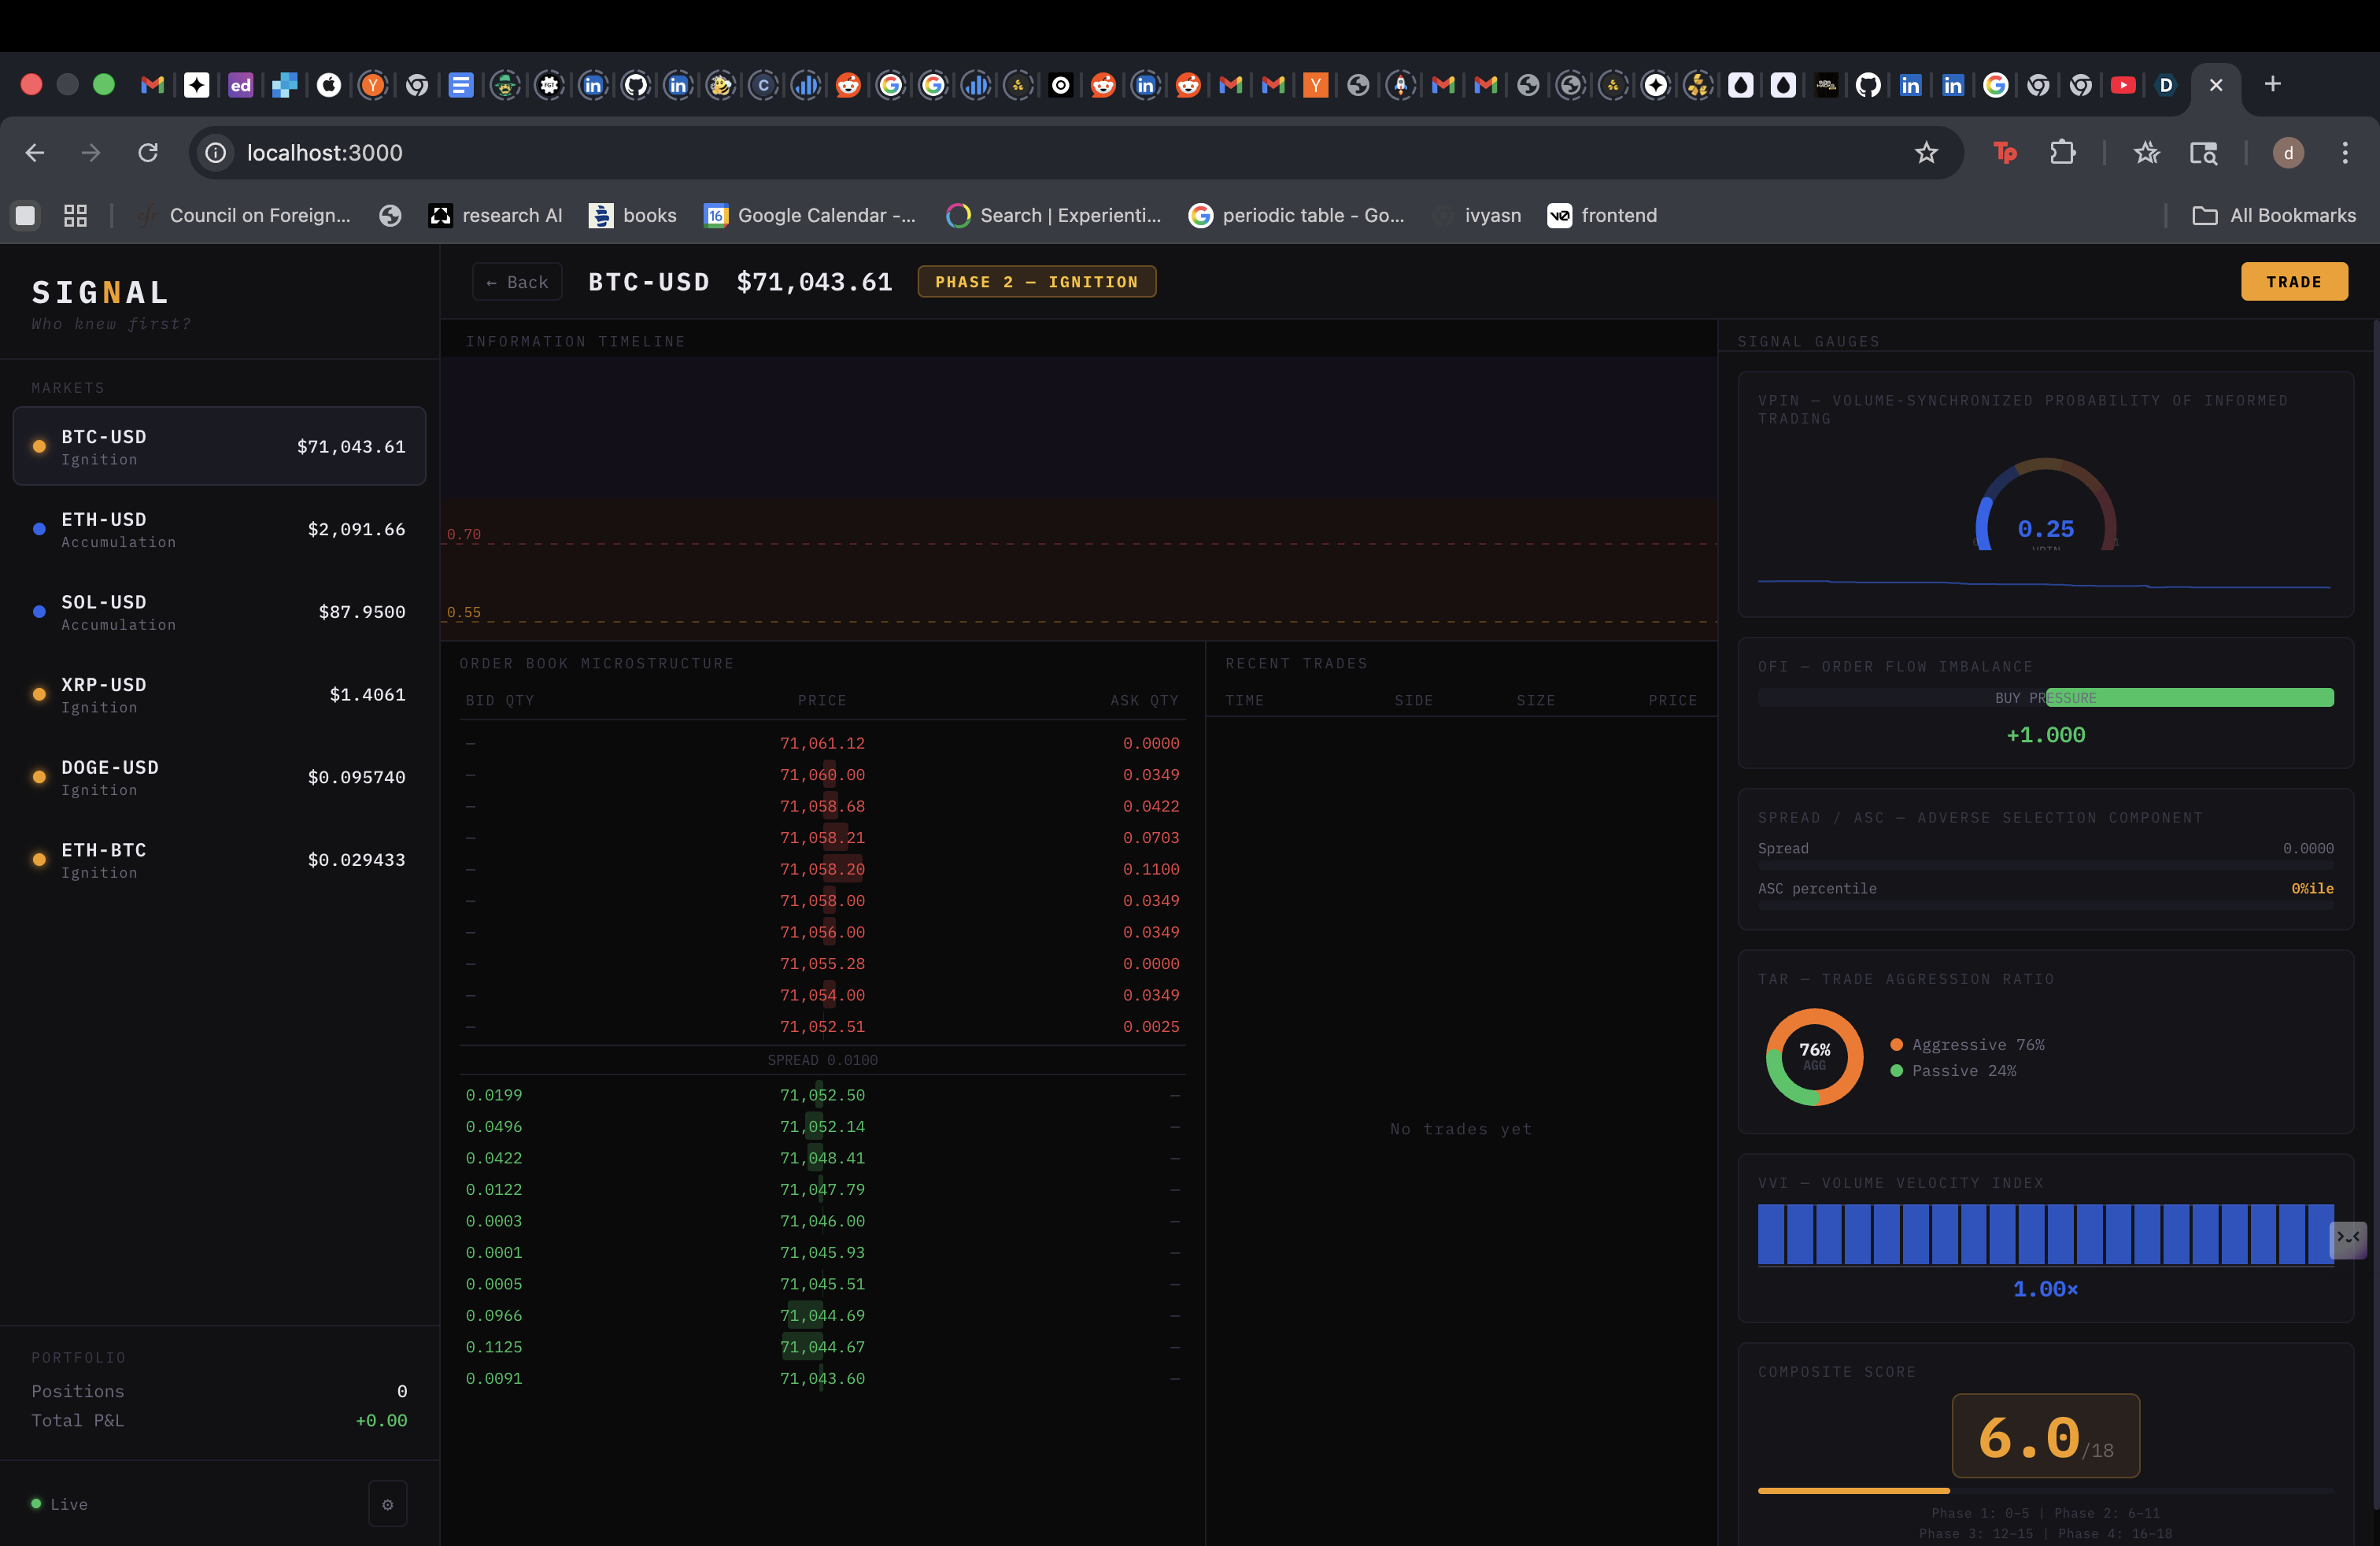
I built SIGNAL, a trading terminal that focuses on when activity is happening in the market rather than just showing price. Most trading platforms rely on price charts, which only show what has already happened. I was inspired by research in market microstructure that shows that order flow — who is buying and selling and when — often contains information before price fully moves. Professional trading firms use signals like order flow imbalance and VPIN to understand whether trading activity is coming from informed participants or from the crowd. I wanted to see what would happen if a trading interface was built around this idea.
The project shows markets as stages in an information cycle instead of candlestick charts. I classify activity into four phases: accumulation, ignition, confirmation, and exhaustion. Accumulation is when large traders quietly position themselves before information becomes public. Ignition is when aggressive buying or selling starts to push the market. Confirmation is when the price move becomes obvious and more people join in. Exhaustion happens when early traders start exiting as late traders enter. Instead of typing a price to place an order, users make simple decisions like riding the move, fading it, or waiting for the next phase.
To build this, I streamed live trade and order book data from the Liquid API. From this data I computed signals such as order flow imbalance, VPIN, and changes in the bid-ask spread. These signals are processed continuously in the backend to estimate which phase the market is currently in. The frontend then shows this as a simple timeline interface and allows the user to enter trades based on the current phase.
One of the main things I learned is how different trading feels when the interface focuses on information flow instead of price. It encourages traders to think about whether they are early or late to a move rather than trying to guess exact price levels. A major challenge was dealing with noisy market data, since microstructure signals can fluctuate quickly. We had to smooth the signals and test different thresholds so that phase transitions were stable enough to display in real time.
Built With
- docker
- google-cloud-run
- javascript
- liquid-api
- node.js
- react
- redis
- rest
- typescript
- websockets
