-
-

Seamless is a distribution manager that focuses on analyzing climate impact.
-
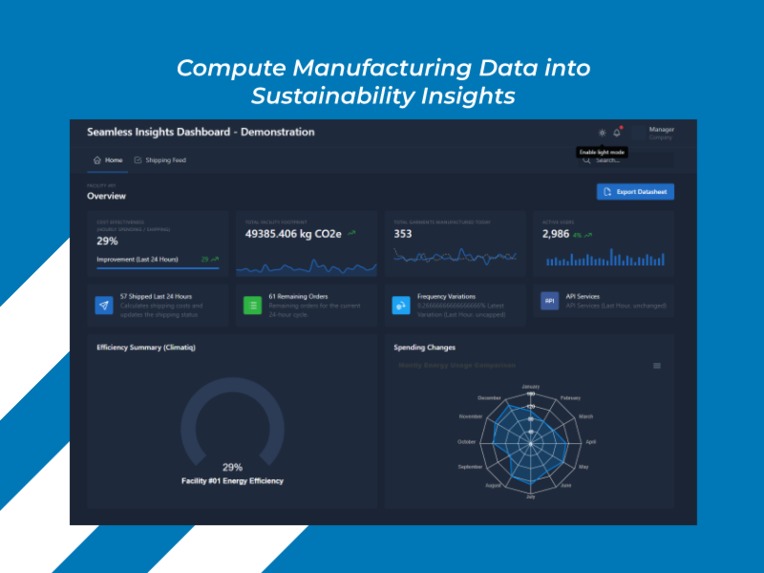
Seamless includes a feature-rich dashboard detailing every insight it collects.
-
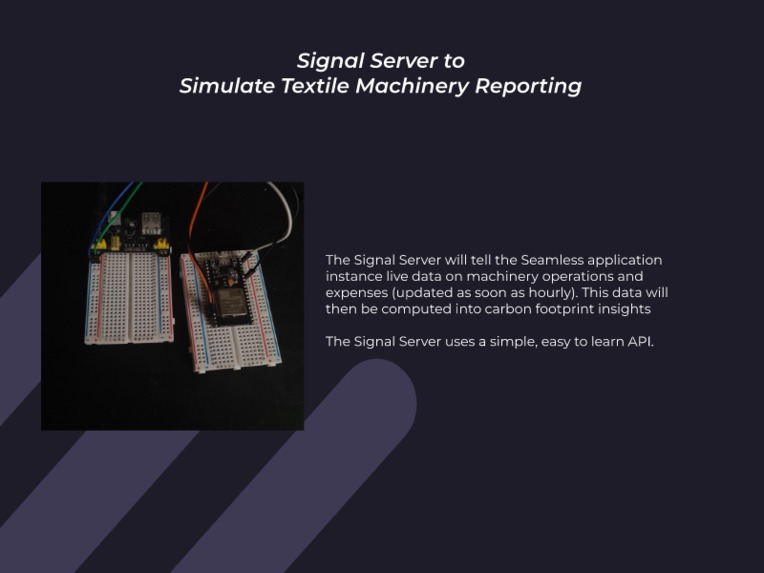
The Signal Server is used to simulate data from a textile facility, for the demonstration app.
-
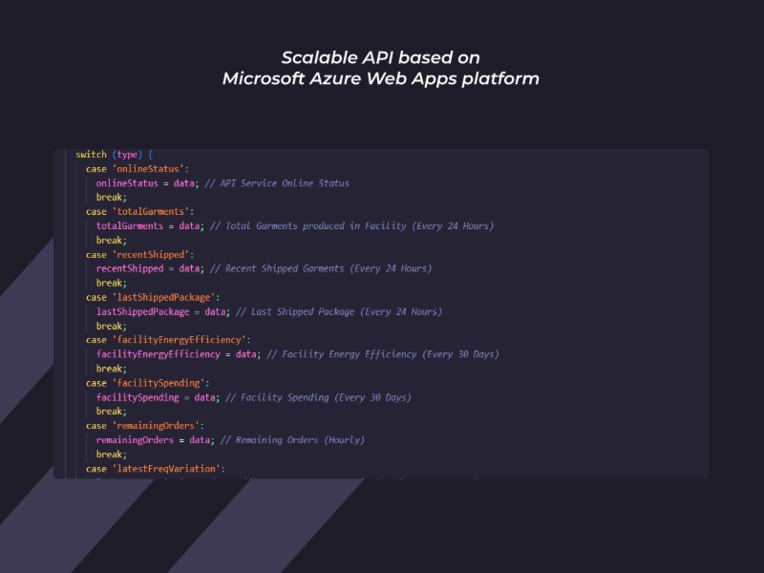
There is also an API that can be used to develop integrations in other software, making Seamless easy to add to an existing workflow.


See the Demo Now
(Leave Login Info Blank)
Introduction: The Problem
All textiles manufacturers use production line monitoring software to keep track of their products and shipments. However, very few of these keep accurate data on energy consumption and efficiency relative to energy usage. Many facilities can go weeks without receiving an environmental impact or sustainability report.
The Solution
Seamless attempts to amend this problem by estimating facility energy efficiency, and creating sustainability reports in real time.
What was created is a demonstration of how Seamless would operate in a real manufacturing environment. The data is sent from a "signal server" that I have built in my own home, and simulates what data could actually output from a real production line. This data is then computed to show energy efficiency, improvements over time, and a page-printable, live sustainability report.
Development
Seamless is built on Microsoft's Azure Web Apps platform. This allowed for a very streamlined development of the app, where one click lead to deployment and commits. The efficiency calculations are computed via Climatiq, and data relevancy is mentioned below.
The project includes a feature-complete dashboard, with analytics and data visualizations. Its defining feature is its emissions calculator functionality, which can take simple data from manufacturing plants and convert it into environmental impact and sustainability information.
All data is based on textile manufacturing sustainability reports from Sweden and Spain.
On Data...
The data used to calculate energy efficiency, average spending, and cost effectiveness are all sourced from Climatiq's emissions factors. These are reported from GHG Protocol, Exiobase, BEIS, and more. They can be considered some of the most accurate data in their fields, and are respectively updated by climatiq.
Every hour, random (reasonable) constants are generated for each facility. Based on how textile facilities in Sweden and Spain operate, numbers for machine energy consumption, human waste disposal, and maintenance costs are generated for calculation. These data are fed into Seamless' climatiq calculator configuration, which then updates the dashboard with insights.
The project demonstrates how simple data about manufacturing, such as the amount of product produced and the machine resources utilized, can be very simply calculated into an environmental impact report.
Production facilities already have data on how much they produce, and how much they spend on equipment. Now, without needing any additional information, they can compute their carbon footprint and impact report.
Organizations can use this information to keep track of their sustainability goals, or create new ones, based on their current trajectory. In the future, I would like to add predictive insights to how emissions may look in the future, based on the company's sustainability performance. These features would make it easier for business owners and facility managers to understand how they are affecting the environment, and more importantly, how to easily present this information in order to make change.
Sources
The Climatiq API was used to perform many calculations in relation to energy efficiency and spending.
The Tabler project was the basis of the admin dashboard.
Sweden and Spain textile manufacturing data sourced from the Exiobase project.


Log in or sign up for Devpost to join the conversation.