Inspiration The theme of this hackathon asked us to bridge the gap between data analytics and modern clinical medicine. While researching, I discovered a staggering statistic: up to 50% of patients fail to adhere to life-saving medications after hospital discharge. Often, this isn't a medical failure; it's a logistical one caused by Social Determinants of Health (SDOH)—such as a lack of transportation, living in pharmacy deserts, or language barriers. Hospitals collect this data, but it is often buried in static spreadsheets. Doctors and care coordinators simply don’t have the time to manually parse through raw data during a 15-minute consultation. I was inspired to build a tool that doesn't just display data, but actively translates it into actionable clinical care.
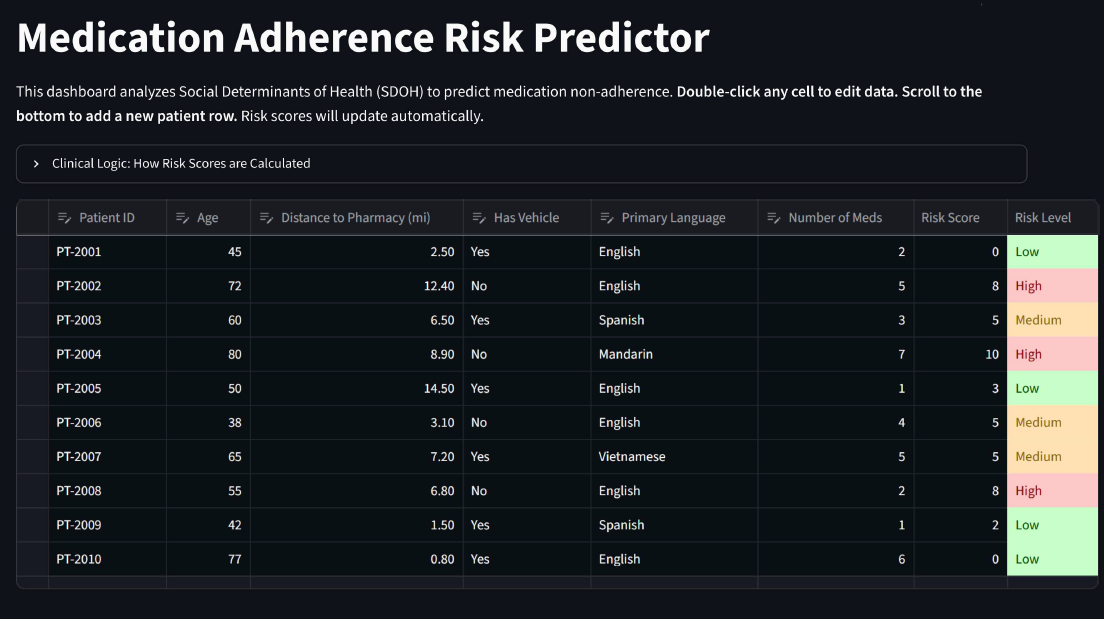
What it does The SDOH Care Dashboard is an interactive clinical web application. Data Ingestion: Hospitals can upload raw patient CSV files directly into the portal (or use the built-in synthetic data generator). Risk Stratification: The logic engine instantly analyzes the SDOH data and categorizes patients into High (Red), Medium (Yellow), or Low (Green) risk for medication non-adherence. Actionable Interventions: Instead of just flagging a patient, the dashboard generates dynamic buttons for the social worker (e.g., "Schedule Uber Health Ride" or "Print translated instructions") based on that specific patient's barriers. Interactive Triage: Clinicians can double-click and edit data directly in the dashboard, and the risk scores will automatically recalculate in real-time.
How I built it I built the application using Python, utilizing AI as a pair-programmer to help me rapidly write, format, and debug the code. Frontend/UI: I utilized Streamlit to rapidly build a clean, responsive, web-based clinical dashboard. Data Processing: I used Pandas to ingest CSV files, clean the data, and format it for the UI. Logic Engine: I developed a weighted algorithm based on standard SDOH risk factors. To ensure clinical transparency (avoiding the "black box" AI problem), I kept the logic strictly rule-based for this prototype. The baseline risk score calculation can be represented by the formula \( RiskScore = (D_{>5mi} \times 3) + (V_{no} \times 5) + (L_{nonEN} \times 2) \) where D is distance, V is vehicle, and L is language.
What I learned How to use Python's Pandas library for real-time data manipulation. How to manage application memory using Streamlit Session State. The importance of UI/UX in healthcare. Doctors suffer from "alert fatigue," so I learned how to design a minimalist, transparent interface that highlights only the most critical information.
What's next for the SDOH Risk Predictor EHR Integration: Connecting the dashboard directly to Epic or Cerner using SMART on FHIR APIs. Artificial Intelligence & Machine Learning: Upgrading the rules-based logic to a trained Random Forest Classifier that utilizes historical hospital readmission datasets.


Log in or sign up for Devpost to join the conversation.