-
-
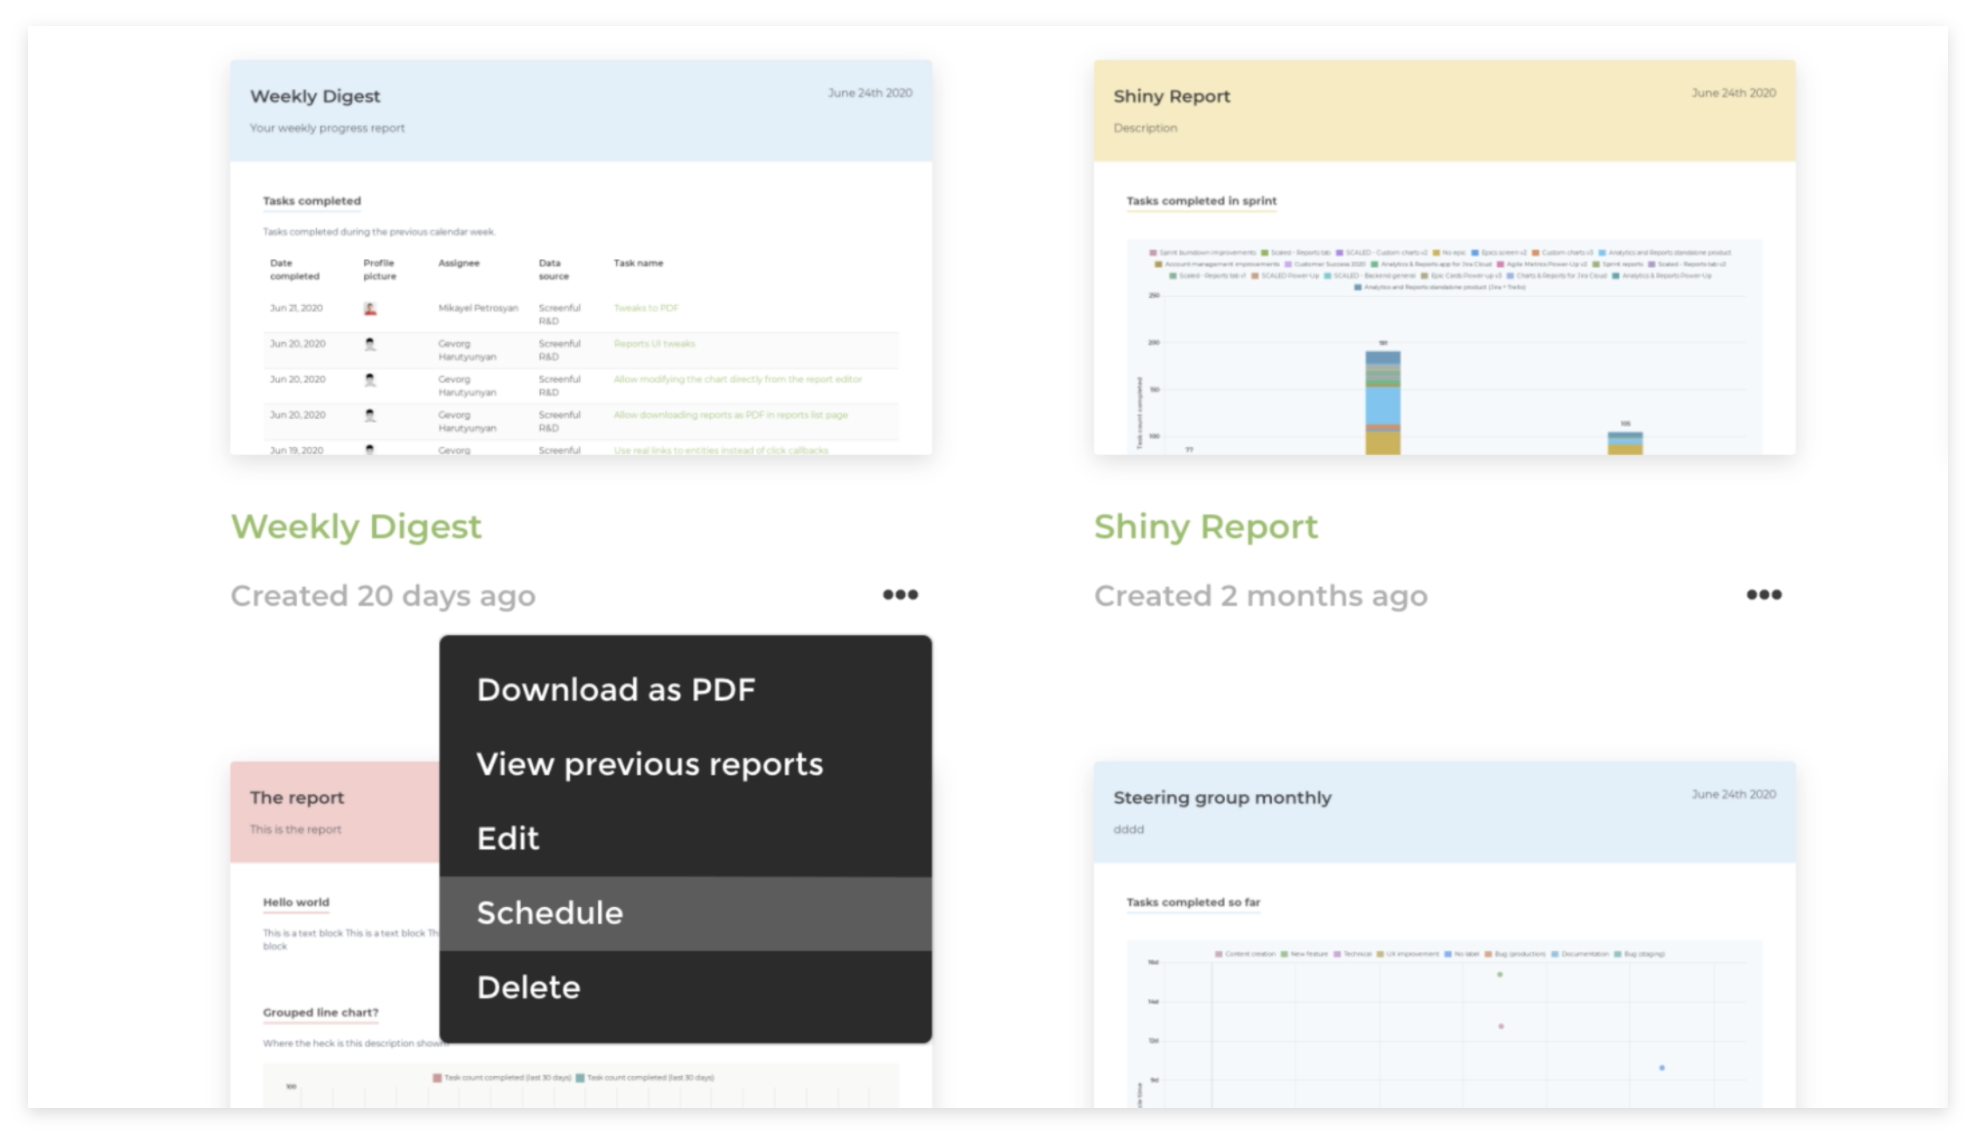
Share reports with colleagues via email or Slack
-
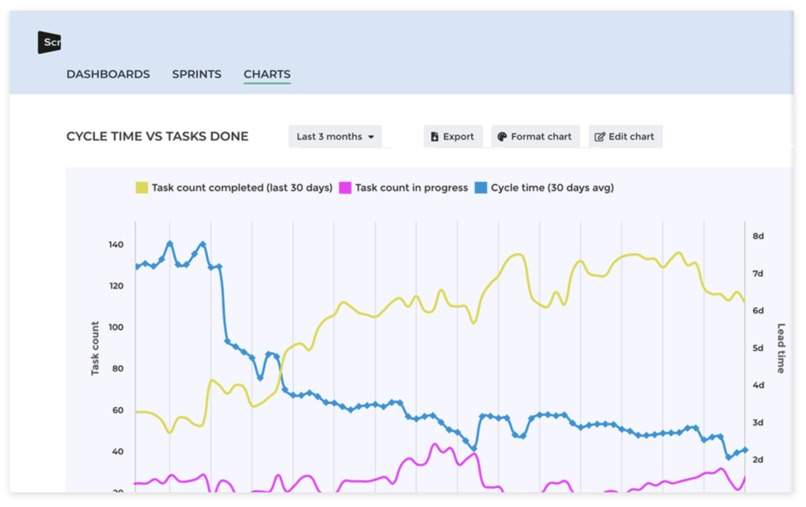
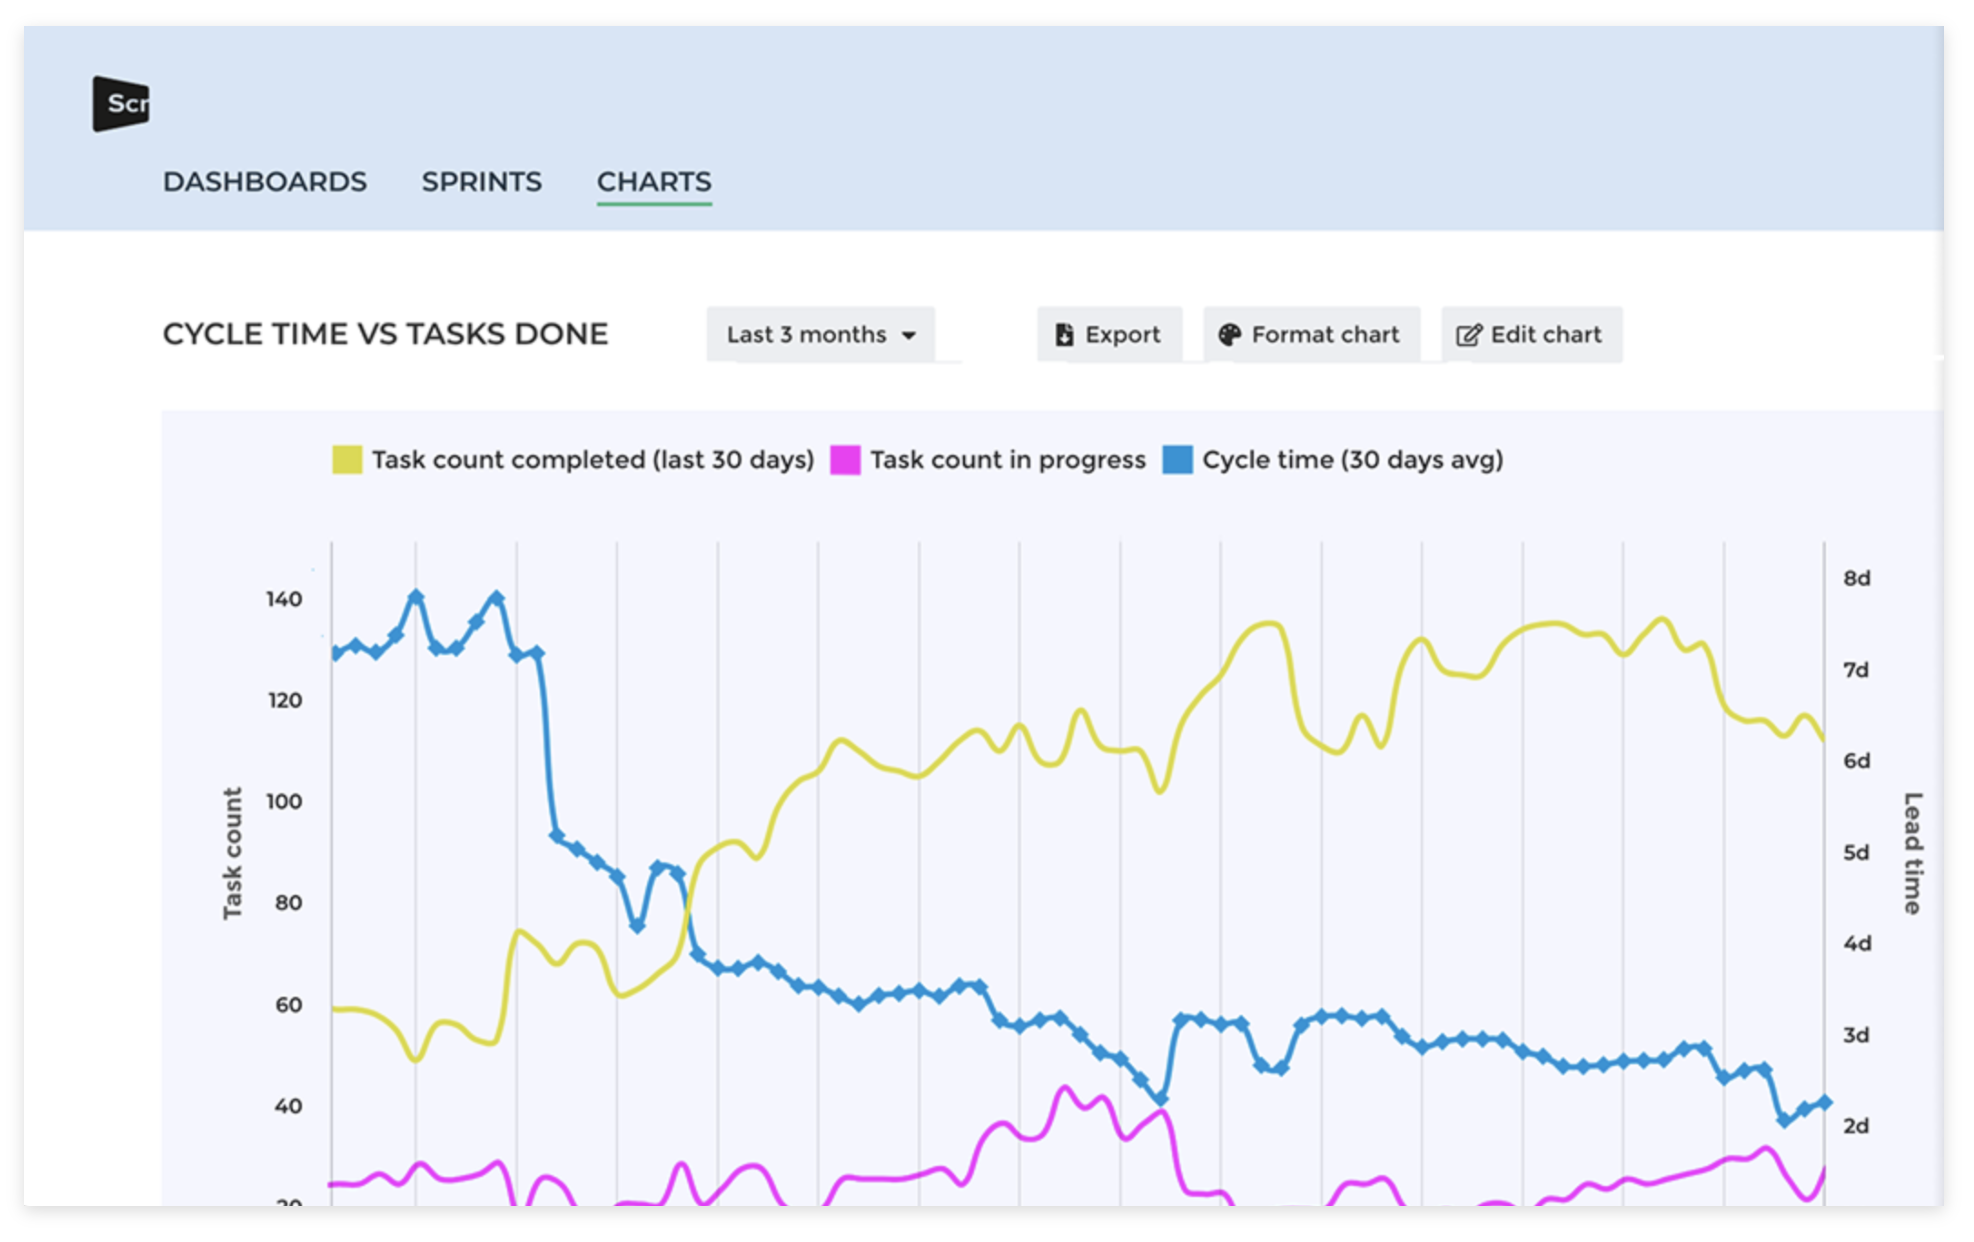
Create custom charts from Monday.com data
-
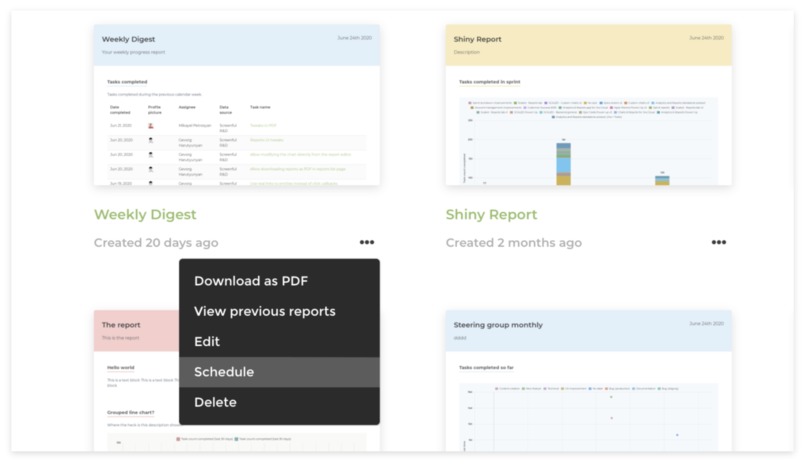
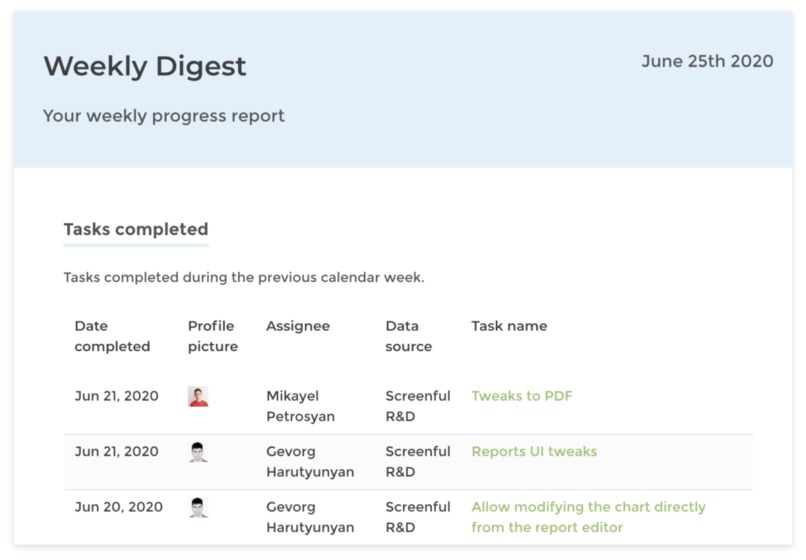
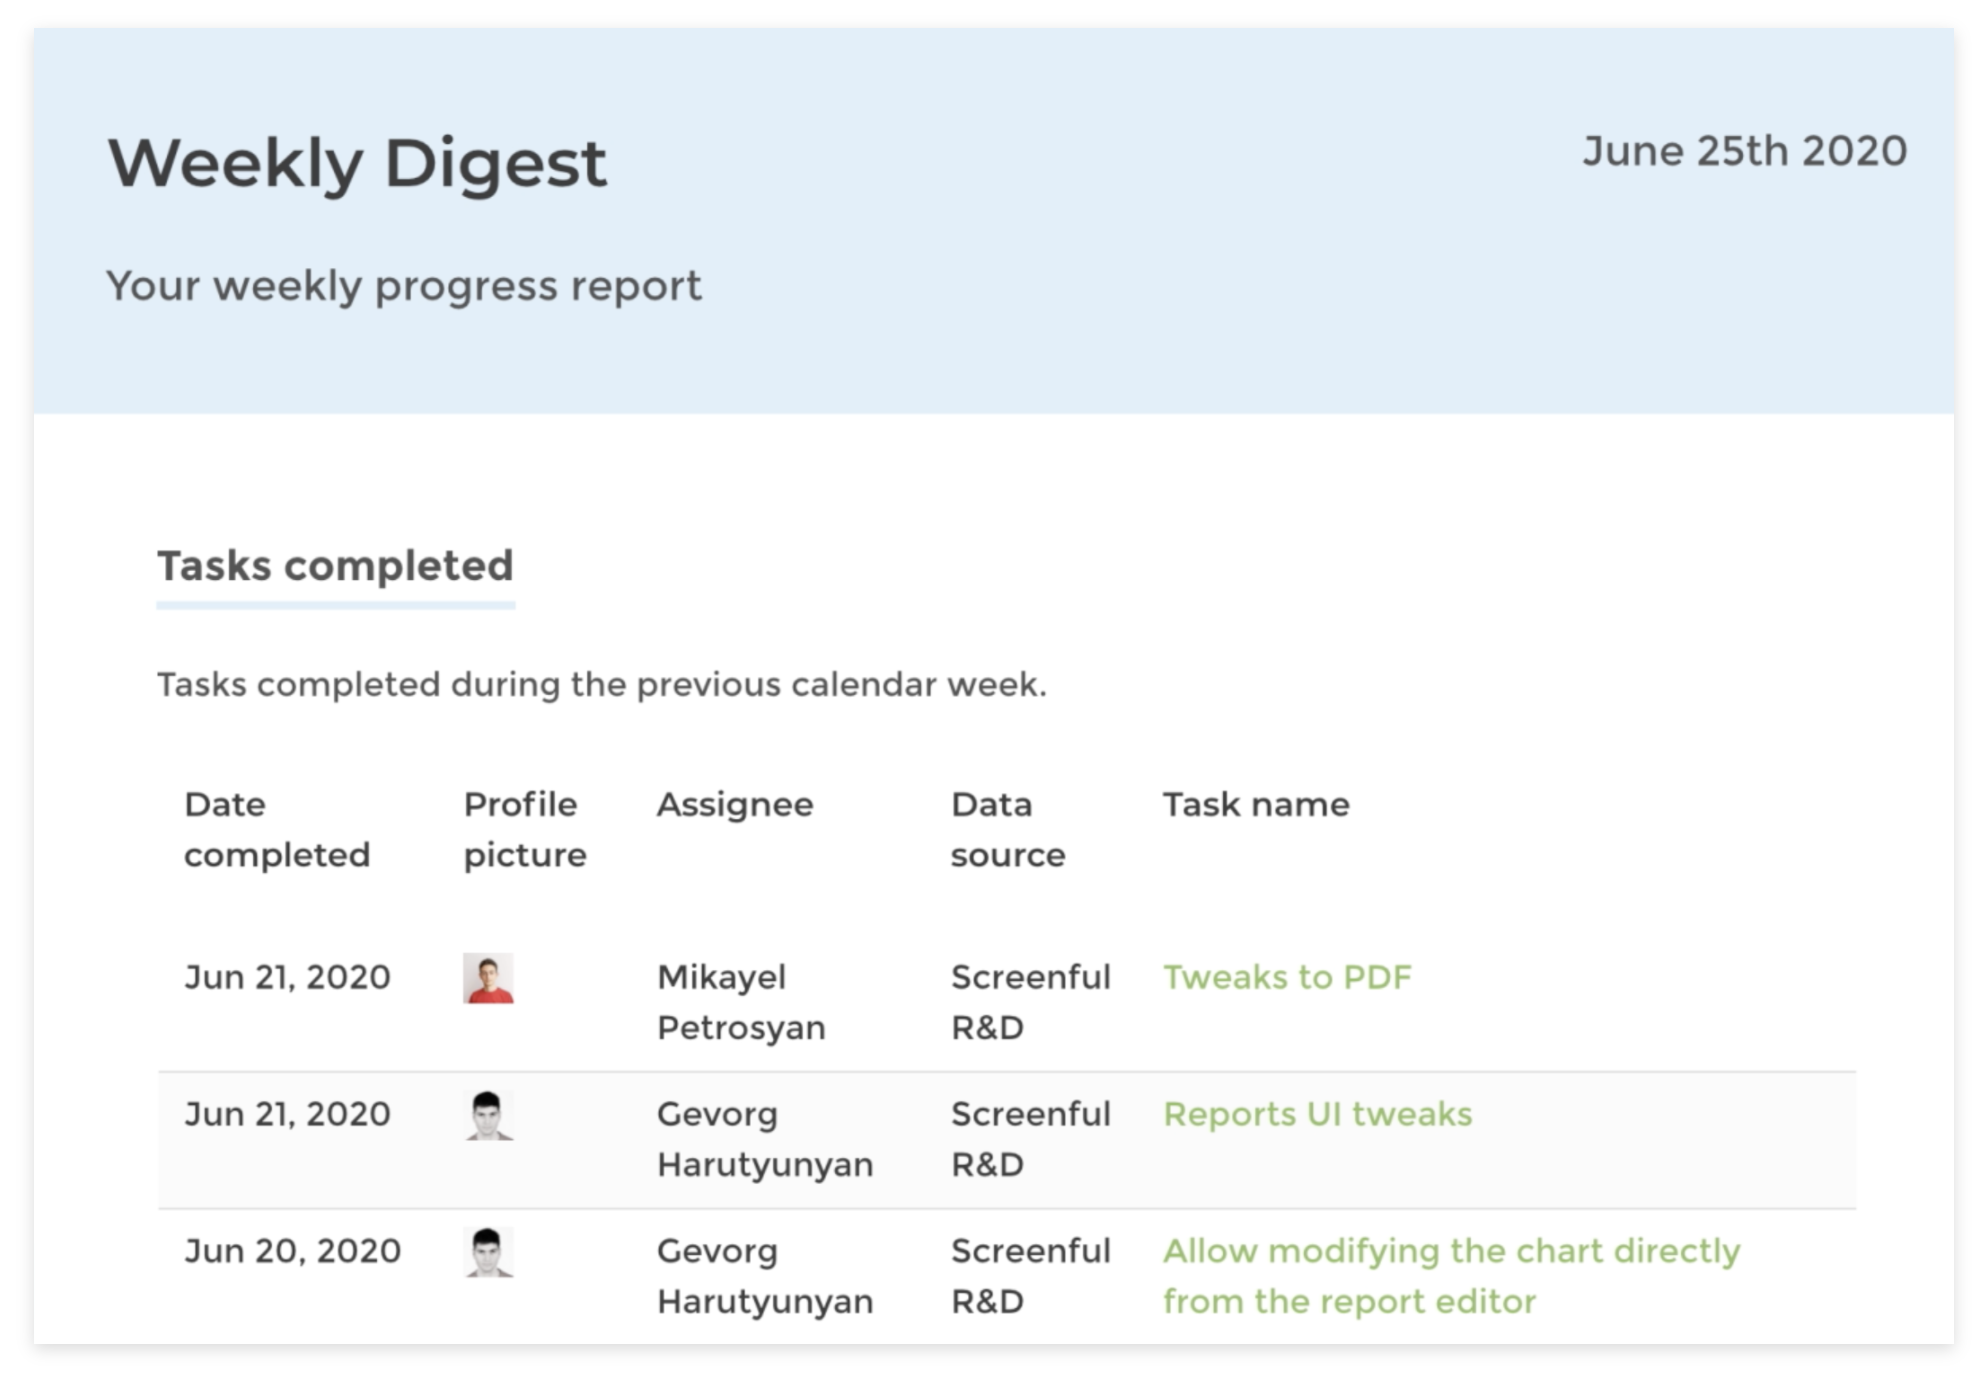
Schedule and share project status reports
Inspiration
Not everyone logs into task management tools on a daily basis. Developers do as they need to work on their tasks/tickets and log their work. But the managers higher up in the ladder tend not to log in as often. However, they still want to be kept in loop of how work is progressing. Screenful can provide that higher level overview delivered via a web browser, a mobile app, email or a chat tool such as Slack.
What it does
Screenful imports data from Monday.com and presents it in a visual interactive dashboards, charts and reports which can be easily shared with your colleagues.
How I built it
We built it using node.js, vue.js and quite a heavily customised set of charts.js charts
Challenges I ran into
Data analytics is a challenging domain overall as you deal with lots of data. Integrating with a new API brings new challenges. How fast can this API work and is it enough for our needs? Are we using this API the right way or are there some tricks we don't know? How is this platform evolving in the future? Those are some of the questions that came up.
Accomplishments that I'm proud of
We managed to build an easy to use reporting tool that helps you to understand how your team or organisation gets work done.
What I learned
It always takes longer than expected to bring a new product to the market. Not really a new insight but holds true again...
What's next for Screenful Reports
We'll be adding more layout options so you can e.g. create reports which has multiple columns in a section. We'll be adding more integrations options and more flexible report editor. Plenty of new stuff coming up!
Built With
- charts.js
- node.js
- vue.js


Log in or sign up for Devpost to join the conversation.