-
-
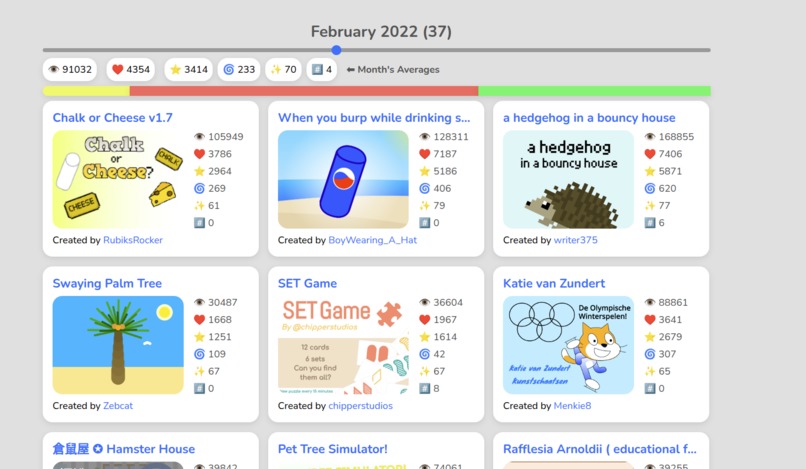
thumnail
-
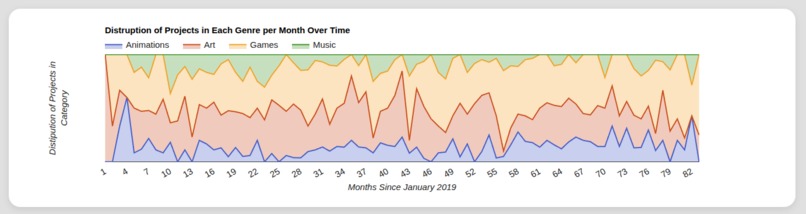
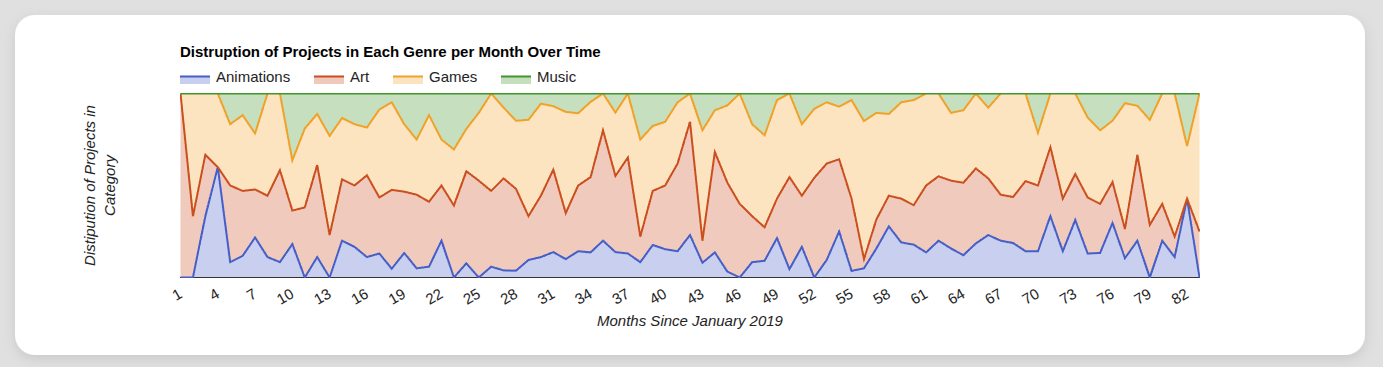
genres over time
-

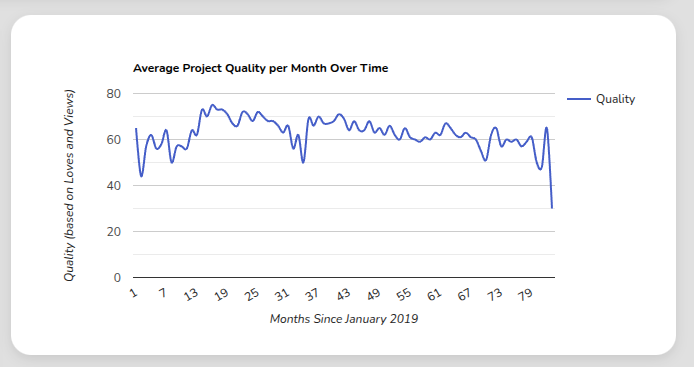
quality over time
-
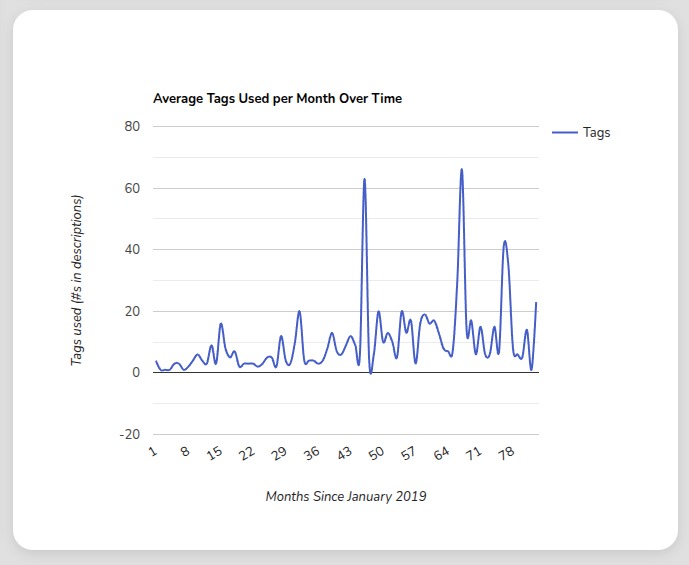
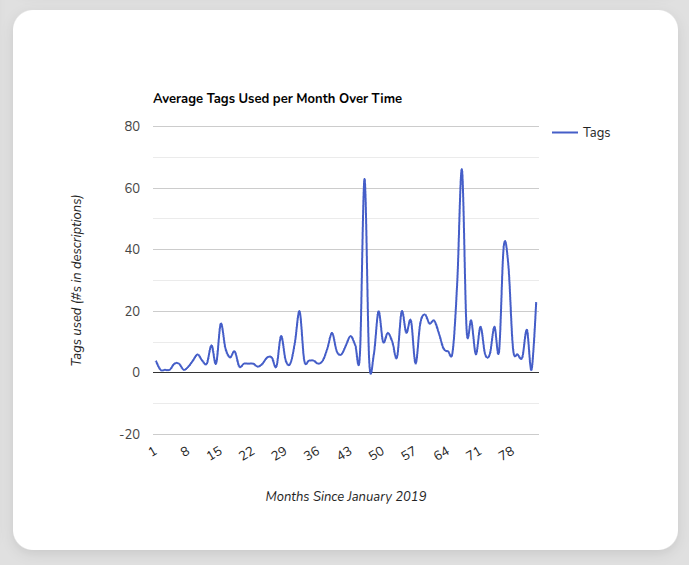
tags over time
-
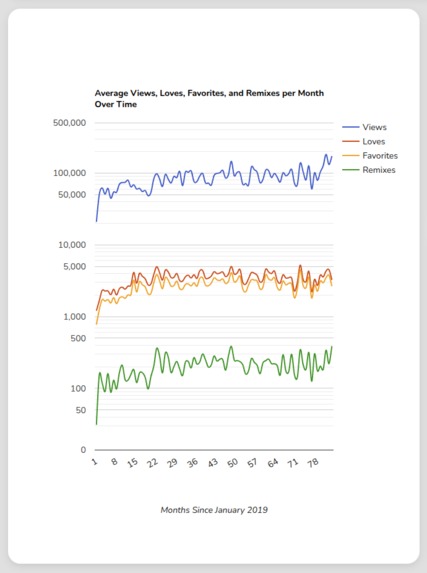
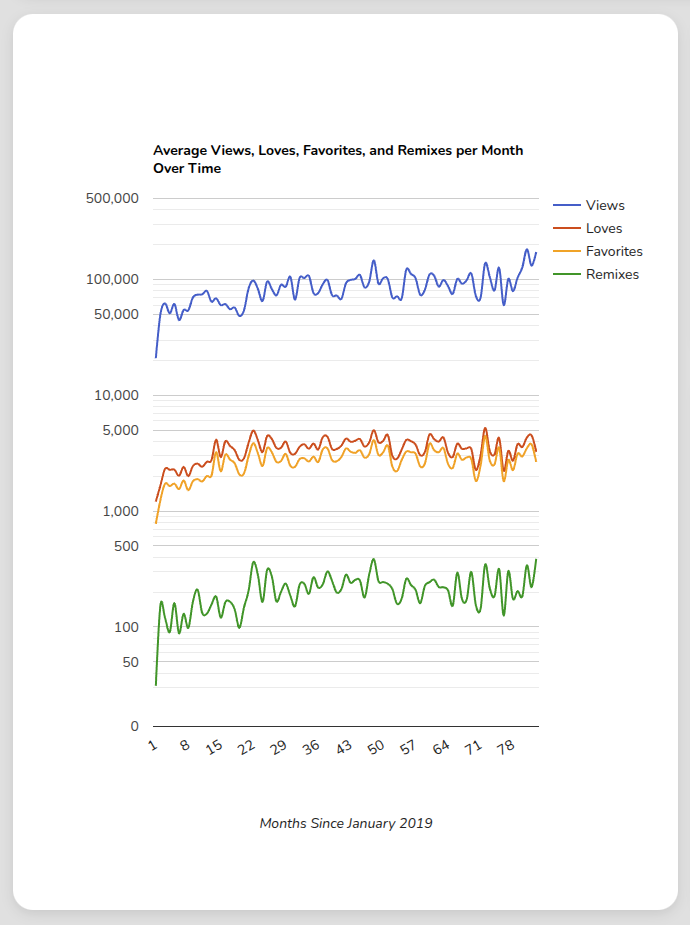
Views, Loves, Favorites, and Remixes Over Time
-
time machine

Inspiration
I really like using Scratch for prototyping games and small projects due to it's ease of use and I always see featured projects on the front page and was wondering what it takes to be featured.
What it does
You can look at how different genres change in popularity, how loves, favorites, and views change, how a calculated quality score changes (see How I built it), and how many tags it uses in it's descriptions.
How I built it
I gathered the data by making a python script to scrape a database of every featured project's ID, spanning several years. Then I had the script fetch data about each project from the Scratch API and save it to a JSON file. In the front end, I averaged all the stats per month and made the graphs. I calculated quality by running a linear regression for average views to loves ratios based on the amount of views and compared it to the actual quality to get a score that is normally 0-100. I found the genres by reading the descriptions and comparing it to keywords that correlate to each genre.
Challenges we ran into
At first, to model quality, I just averaged all the like to view ratios and compared expected to actual loves. But with this method it seemed to favored less viewed projects when I plotted quality to views.
 This is probably because of the effect where the more views you have, the less like to view ratio which is probably caused by it reaching a less niche audience and how people are more likely to like a project with less likes. To account for this, I made a linear regression on the ratios of loves to views over views and compared to to the actual ratio and got a much better looking function that would match the actual quality of the project better, it has a general upward trend that matches how you would expect a better project to have more views.

Accomplishments that I'm proud of
I'm proud of how I learned to use the Google Charts library to get good looking graphs in my website that are somewhat interactive, letting you move your mouse and see the data points. I'm also proud of the CSS I did to make it look good and modern; I hate CSS so getting something that looks good is a nice feeling. It also works on multiple screen sizes which is something I often struggle with.
What I learned
I learned how to use the Scratch API to gather data. I learned how to use Google Charts to add graphs to a website. I refreshed my much neglected JavaScript, HTML, and CSS skills. I learned how to use pandas for data analytics, scikit-learn for linear and polynomial regression, matplotlib for graphs, and ScratchAttach for the Scratch API.
Analyzing the Data
So it turns out there are almost no trends in genres of the projects over time except art gets a little less popular and games gets a little more, which is a little unexpected. but there is a trend in views, loves, favorites, and remixes which all go up slightly over time. The quality also seems to be going down over time, which is interesting. The tags used goes up over time which might be correlated to the quality going down because a lower quality project needs more tags to get popular.
Built With
- css
- google-chart
- html
- javascript
- matplotlib
- pandas
- python
- scikit-learn
- scratchattach

Log in or sign up for Devpost to join the conversation.