-
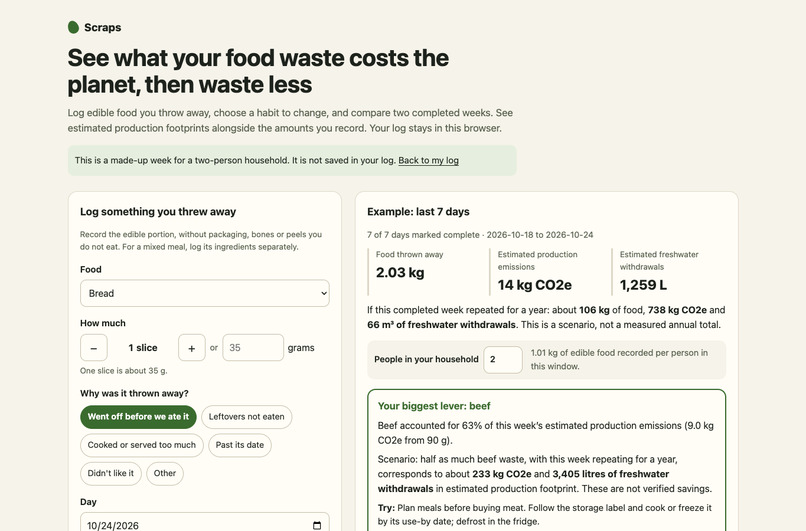
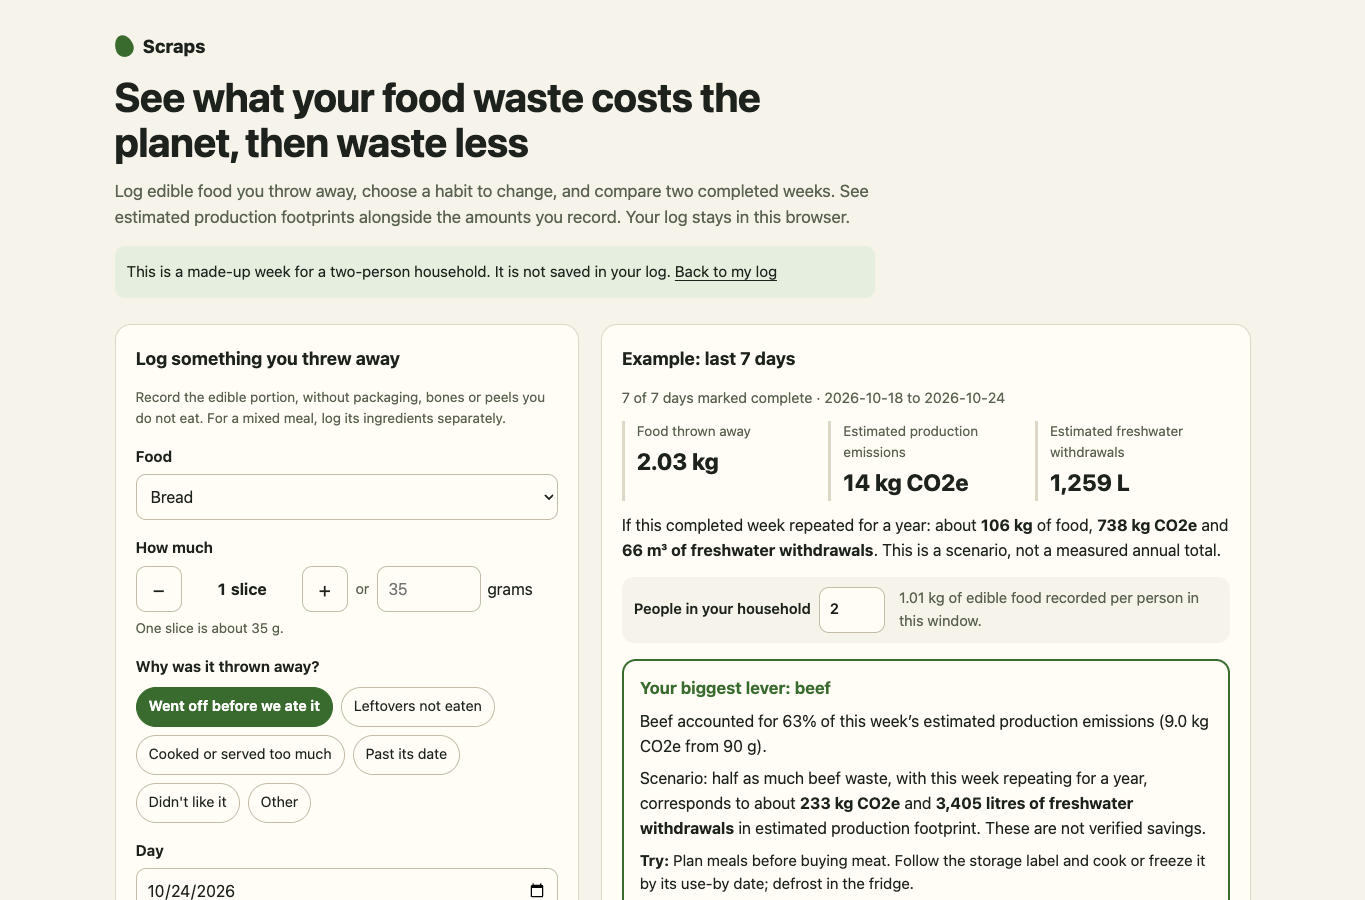
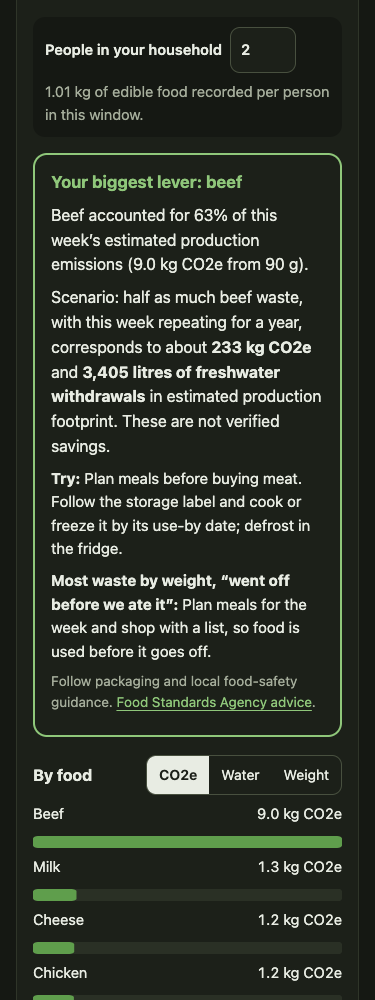
Made-up example: 2.03 kg recorded. Production footprints use global averages. The example is not saved in your log.
-
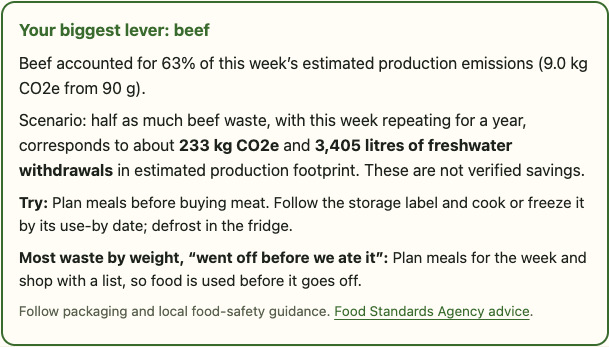
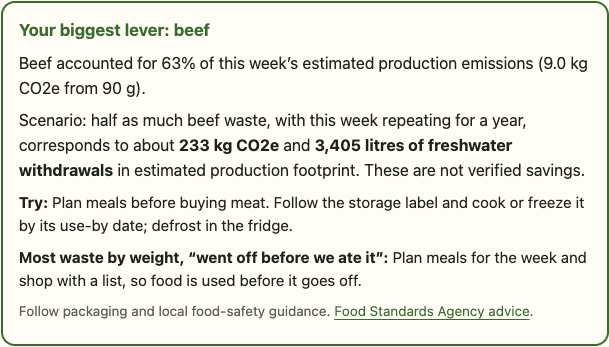
The annual half-waste figure is a conditional scenario, not verified savings.
-
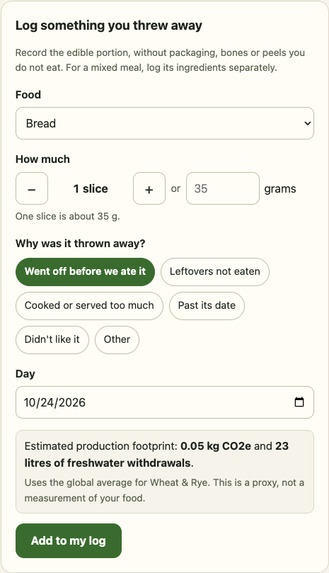
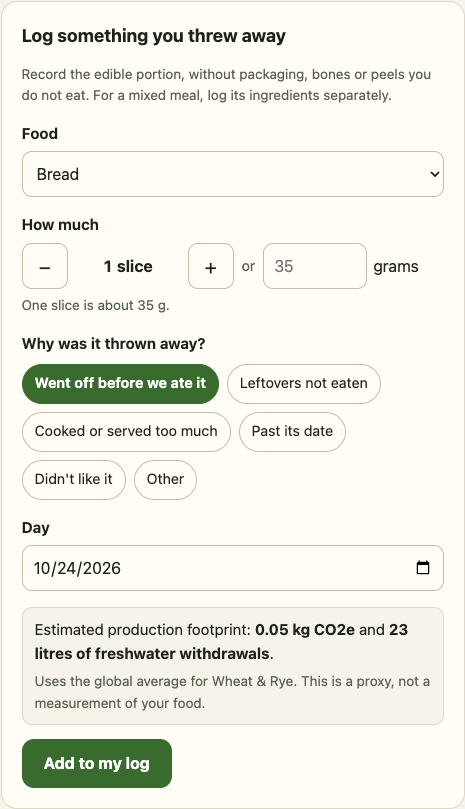
Record edible portions and see the proxy category and assumptions before adding an entry.
-
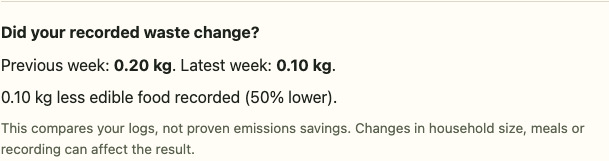
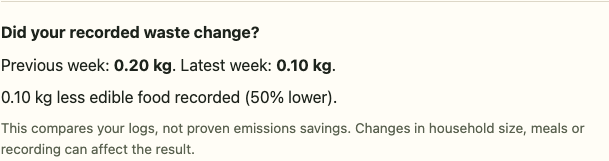
Fictional demo: 200 g in one completed week, 100 g in the next. This describes logs, not proven environmental impact.
-
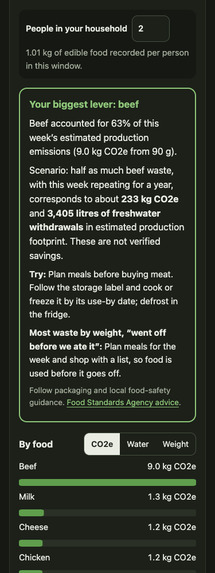
Current phone view in dark mode, using the made-up example.
What Scraps does
Scraps helps households, shared flats and student kitchens record edible food waste and choose a habit to change. Log food in grams or familiar portions, see its estimated production footprint, and compare two fully recorded weeks. The log stays in the browser.
Why food waste
Households generated about 631 million tonnes of food waste in 2022, according to the UNEP Food Waste Index Report 2024. Its household estimate includes inedible parts. Scraps tracks edible portions, so it does not score a household against UNEP's 79 kg per-person annual average.
Small amounts can matter differently. The app uses global production averages from Poore & Nemecek (2018), via Our World in Data. Weight, greenhouse gas emissions and freshwater withdrawals are separate views, helping a household see which food to focus on.
Try it
- Open the live app and choose Show a made-up example week. This two-person example totals 2.03 kg and about 14 kg CO2e in estimated production emissions. It never replaces or saves over your own log.
- Find the food with the largest estimated emissions. In the example, beef leads; switch the chart to Weight and milk comes first.
- Choose Back to my log. Record the edible portion of food thrown away, using one of 29 food choices. For mixed meals, enter the ingredients separately. The form names the dataset category and any cooked-weight conversion.
- Mark each day complete after recording all its waste, including days with none. Unchecked days stay missing data. Adding or removing an entry reopens that day.
- After 14 completed days, compare the latest seven with the preceding seven. The app shows changes in recorded weight, estimated production emissions and freshwater withdrawals. Where the weight baseline is nonzero, it also shows the percentage change. Open See what changed by food to inspect both increases and decreases; choose emissions, water or weight to rank the changes.
Watch the October 30 captioned walkthrough. The 85-second recording shows the current app through 11 checked scenes: opposing weight and emissions changes, food-level contributions, reload persistence and recovery from a deliberately injected invalid record. All inputs are fictional. The damaged row is a local test fixture, not real data loss, and no household benefit is claimed.
Environmental impact and its limits
Scraps connects a record to a practical next step: identify a high-footprint food, try a storage or portioning change, then compare completed logs. Recommendations follow the food group and the reason responsible for the most waste by weight. Food-safety reminders link to the UK Food Standards Agency; packaging and local guidance still apply.
The app has not demonstrated a real-world reduction in waste or emissions. A lower logged weight can reflect fewer meals, a different household size or different recording habits. Its comparison reports the logs, without claiming causation.
A reproducible fictional case shows why the metrics are separate: enter 1,000 g of bread in the previous week and 100 g of beef in the latest week, then mark all 14 days complete. Weight is 90% lower, while estimated production emissions are 8.38 kg CO2e higher and freshwater withdrawals are 502.9 L lower. The food breakdown shows both the increase for beef and the decrease for bread. This is a calculation check, not evidence of a household benefit. Both weeks use the same global-average factors.
Annual projections appear only after all seven days are marked complete. They assume that week repeats for a year. The half-waste scenario uses the same assumption and global production factors; it is not verified savings. The made-up example illustrates the calculation only.
How it works
- React, TypeScript and Vite serve a static page. No account, upload or analytics is required. A Content Security Policy blocks application network connections; the hosting service still receives normal page requests.
- Global mean greenhouse gas and freshwater-withdrawal factors come from Poore & Nemecek (2018), as published by Our World in Data. They estimate production through retail, excluding cooking at home, the journey home and disposal.
- Food choices use proxy categories: bread and pasta use Wheat & Rye, beef uses Beef (beef herd), and fish uses Fish (farmed). A particular product may differ substantially.
- Cooked rice, pasta and pulses are converted to an approximate dry weight by dividing by 2.8, 2.4 and 2.5. These are assumptions, not measurements of a specific meal.
- The log is stored locally. Invalid or duplicate stored rows are excluded with a warning, and original malformed data is retained for recovery. Affected dates are reopened for checking. If a discarded row has no valid date, all completion marks are reopened. Missing entries need to be replaced before those days are marked complete again. A failed save is visible. Browser storage can still be cleared or become unavailable, and there is no account sync.
Validation
The current version passes 38 unit tests and 11 browser tests on the production build. Coverage includes calculation boundaries, invalid dates and rows, recovery of stored data, example isolation, incomplete weeks, zero baselines, completed-week comparisons, reloads and storage failure.
A recovery test starts with a damaged row in an otherwise completed two-week log. The affected day reopens, annual scenarios stay hidden, and no percentage reduction is shown. After the missing amount is entered and the day is marked complete again, the comparison returns. The original damaged data remains available for recovery.
New comparison checks reconcile food-level changes to each metric total, retain cooked-weight conversions and suppress comparisons when a day reopens. Tiny nonzero values are shown as below the display threshold rather than zero; equivalent portions are treated as unchanged despite floating-point roundoff.
Browser checks also cover keyboard submission and disclosure controls, phone-width overflow, light and dark modes, and axe accessibility scans with no reported violations in the tested states. These checks verify software behaviour, not environmental outcomes.
What changed during development
An incomplete log can look like a low-waste week. Explicit completion marks make the distinction visible. A household benchmark also needs the same measurement scope, so the app now reports edible-food weight per person in the current window instead of comparing it with UNEP's broader annual total. The example has its own temporary state to keep it out of personal records.
The October 30 update closes a gap in that distinction: a discarded stored record can no longer leave its day marked complete. Tests also cover duplicate IDs on different dates and records whose dates cannot be recovered. Valid history, including dates that appear to be in the future after a clock change, stays intact.
The same update extends the two-week comparison beyond weight. A smaller amount of higher-footprint food can increase estimated emissions, so the app now reports each metric separately and lets the user inspect the foods behind a change.
Credits and disclosure
Built during Green Shift Hacks 2026, beginning October 22, 2026. The initial project was built with Claude (Anthropic); Codex (OpenAI) assisted with the October 24 improvements, tests, recording script and documentation, and the October 30 recovery fixes, footprint comparisons, tests, walkthrough and text updates. The example data and walkthrough inputs are fictional.
Data: Poore & Nemecek (2018), Science 360(6392), via Our World in Data (CC BY 4.0); context from UNEP's Food Waste Index Report 2024. Libraries and tools: React, TypeScript, Vite, Vitest, Testing Library, Playwright and axe-core. The current walkthrough is captioned and has no narration.
Source code and local setup, MIT licensed.
Built With
- axe-core
- github
- our-world-in-data
- playwright
- react
- typescript
- vite
- vitest
