About the project
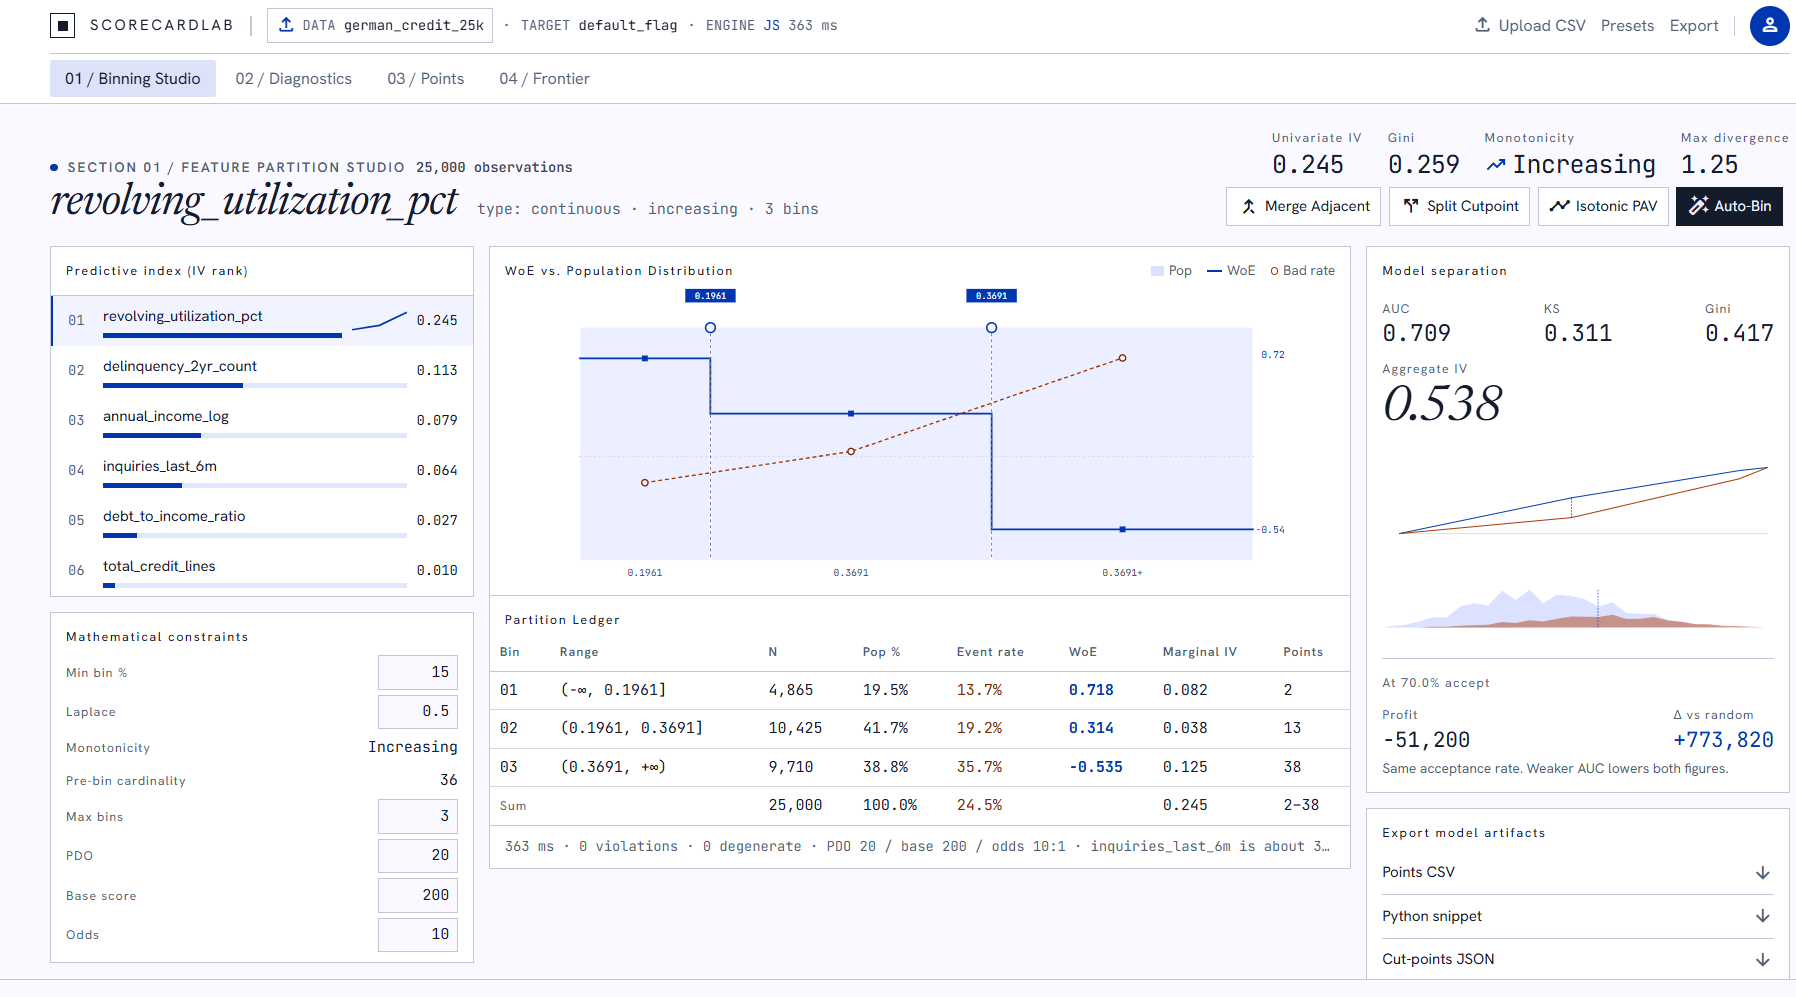
ScorecardLab is a browser-based tool for building a monotonic Weight-of-Evidence scorecard. You load a binary dataset, adjust numeric cut-points by hand, and export a usable points table -> all without leaving the tab or opening a notebook.
Inspiration
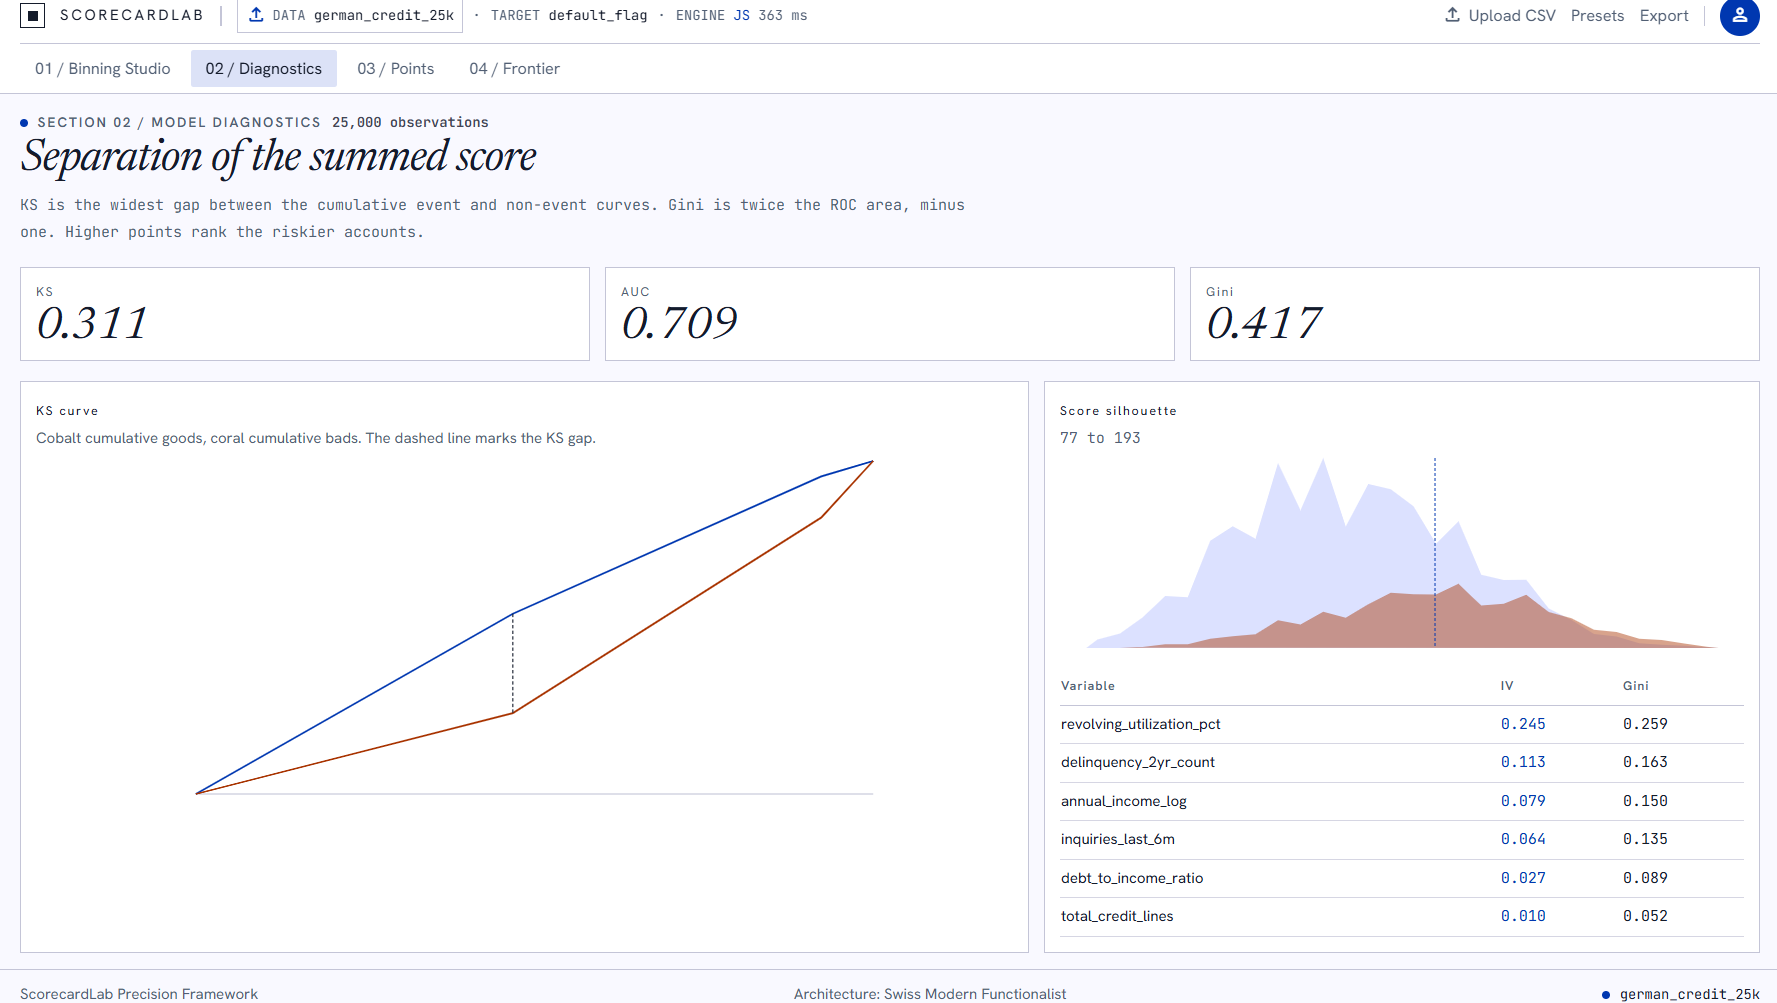
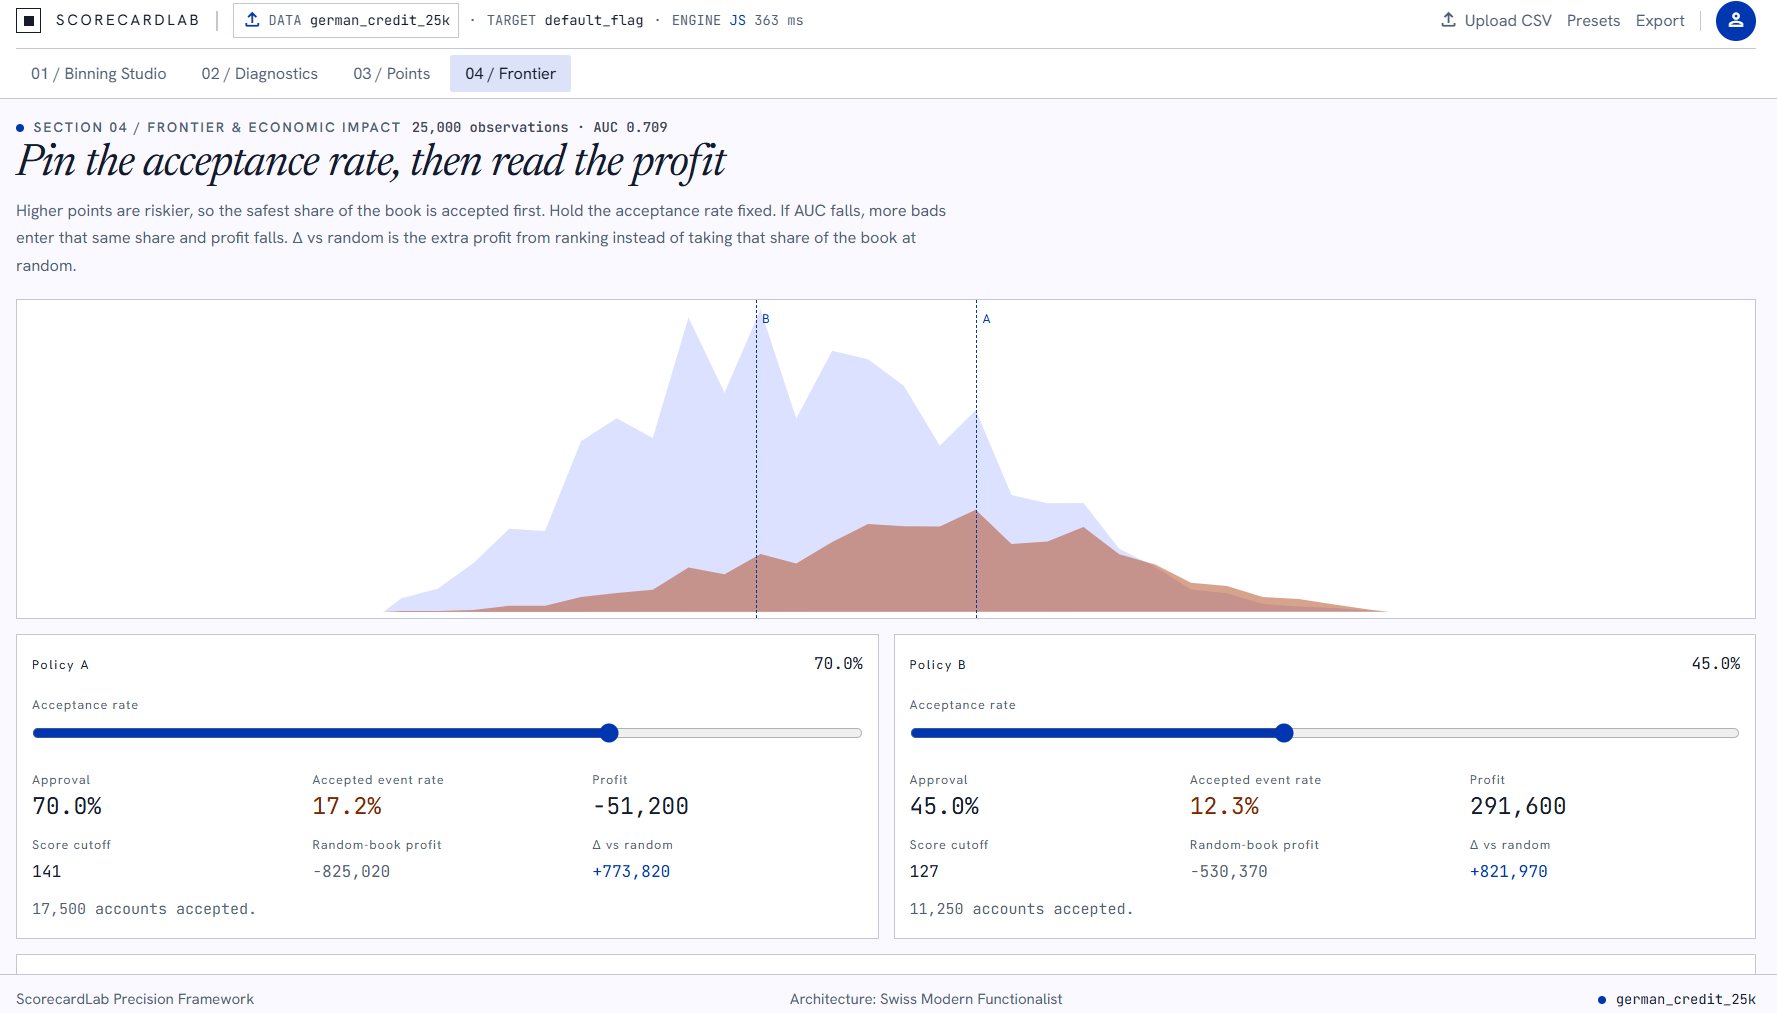
Building scorecards usually means jumping between notebooks, spreadsheets, and custom scripts. The slow part is rarely the math; it’s the loop of “change a cut, check that the event rate stays monotonic, recompute points and separation, repeat.” I wanted a place where that loop felt immediate: drag a boundary, see the curve stay legal, and watch KS, Gini, and AUC update together. The economic frontier view came from the same need -> once you have a score, you still have to decide where the threshold sits and what it costs.
How I built it
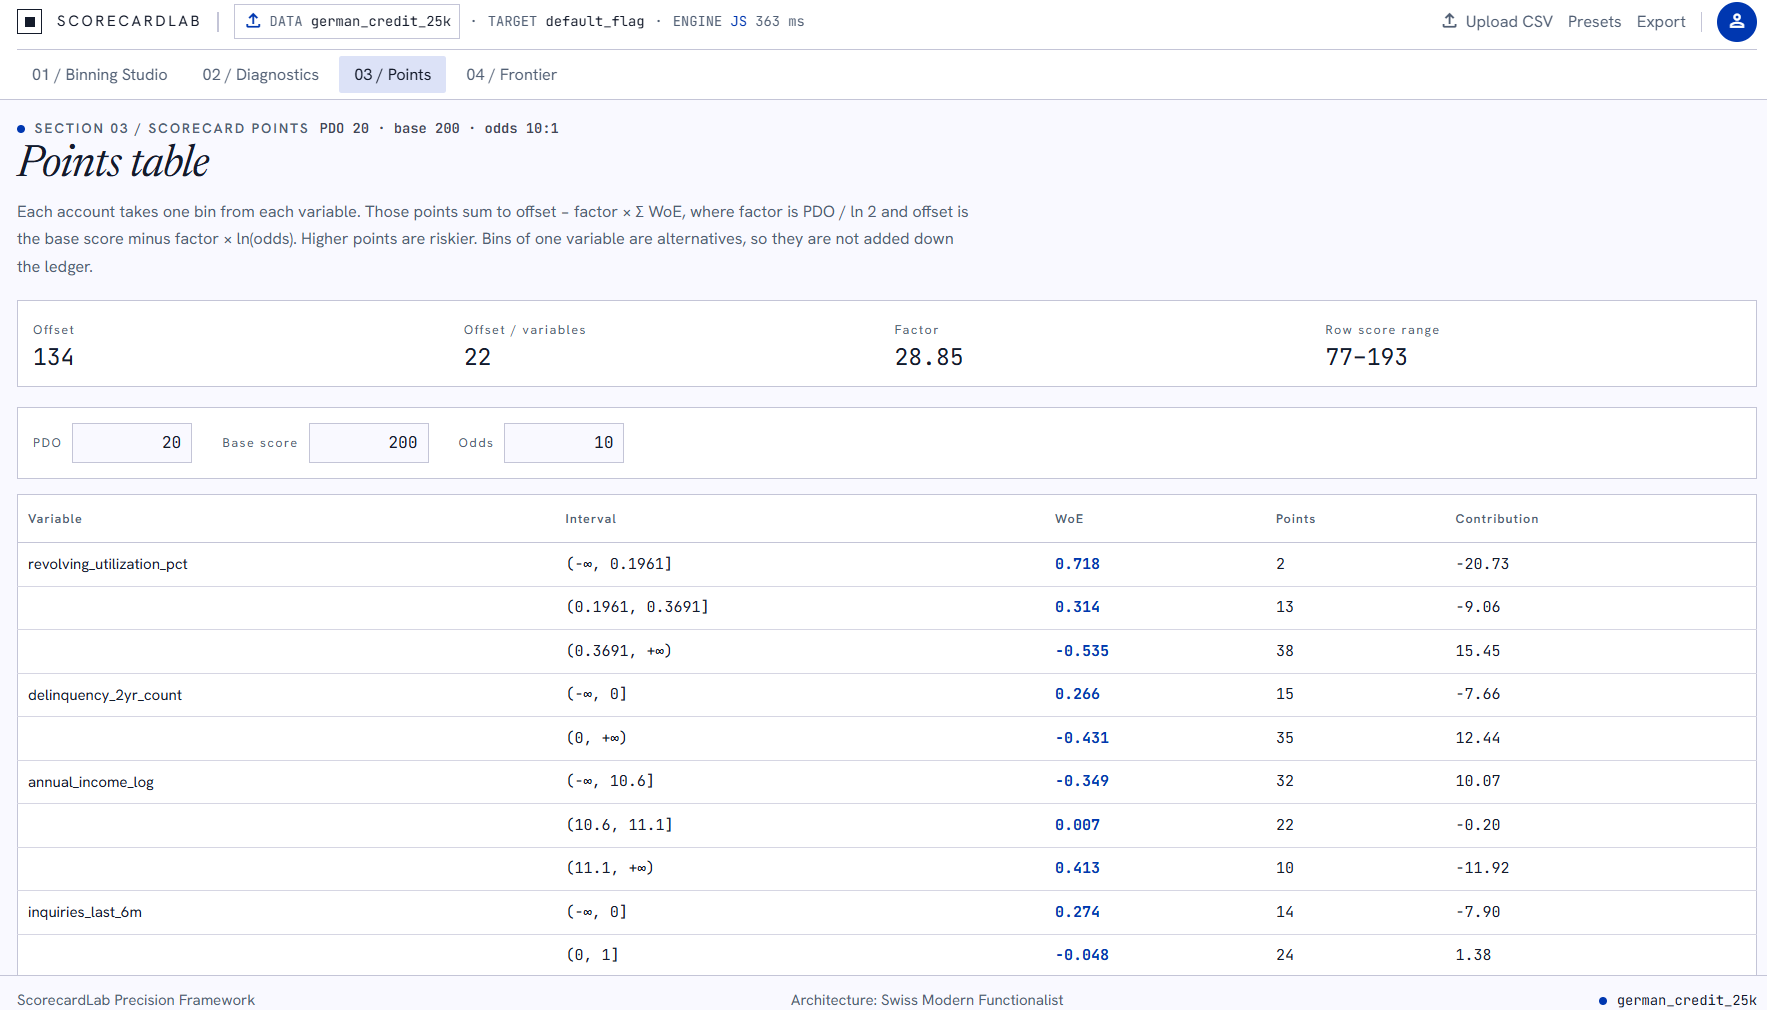
I started with the Devpost Learn Skill Pack. The skills walked me through scope, PRD, and spec before any real code, which kept the project from ballooning. The result is a Vite + React + TypeScript app that runs entirely in the browser. A small TypeScript engine handles pre-binning, pool-adjacent-violators for monotonicity, merge/split constraints, and the scorecard statistics. Dragging a cut projects onto the nearest legal partition so the event-rate sequence cannot break. The same model feeds Binning Studio, Diagnostics, Points, and the Frontier & Economic Impact view.
Challenges
The hardest part was making the drag feel both free and constrained. A cut has to move, but the resulting bins must stay monotonic and above the minimum size. Getting that projection fast enough that the chart and ledger update without lag took the most iteration. Scaling points by PDO and base score without invalidating the existing cuts was another place where the math and the UI had to stay in sync. Keeping the whole thing a proof of concept (top six variables, numeric only, no backend) was a constant discipline -> the skills helped by forcing the boundary early.
What I learned
Planning before writing code actually shortens the build when the agent is involved. The monotonicity constraint turned out to be the product’s identity more than any single chart. And a scorecard that only shows separation is incomplete; the economic view is what makes the threshold decision concrete. I finished with a working first draft I can reopen the next time I need a quick scorecard without spinning up a notebook.
What’s next for ScorecardLab
The current version is a focused proof of concept: numeric features only, top six variables, everything in the browser. Next steps that would make it more useful without changing the core idea: Categorical variables -> support non-numeric columns with the same monotonicity and points logic. More than six features -> let the user choose which variables enter the scorecard instead of hard-capping at six. Save and load sessions -> export/import the full binning state so you can resume a card later. Larger files -> keep the same math but add a simple Web Worker or optional backend path for datasets that feel heavy in the tab. Threshold recommendations -> use the economic frontier numbers to suggest a starting cutoff instead of only visualizing it. The drag-to-monotonic-bin loop stays the center. Everything else is just making that loop usable on more real datasets.
Built With
- javascript
- python
- react
- tailwind
- tailwind-css
- typescript
- vite


Log in or sign up for Devpost to join the conversation.