-
-
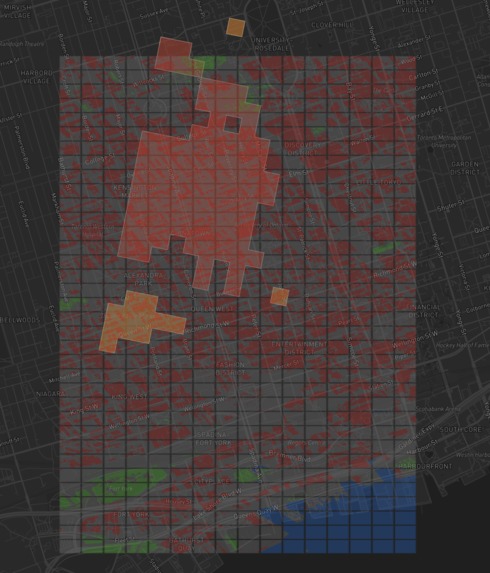
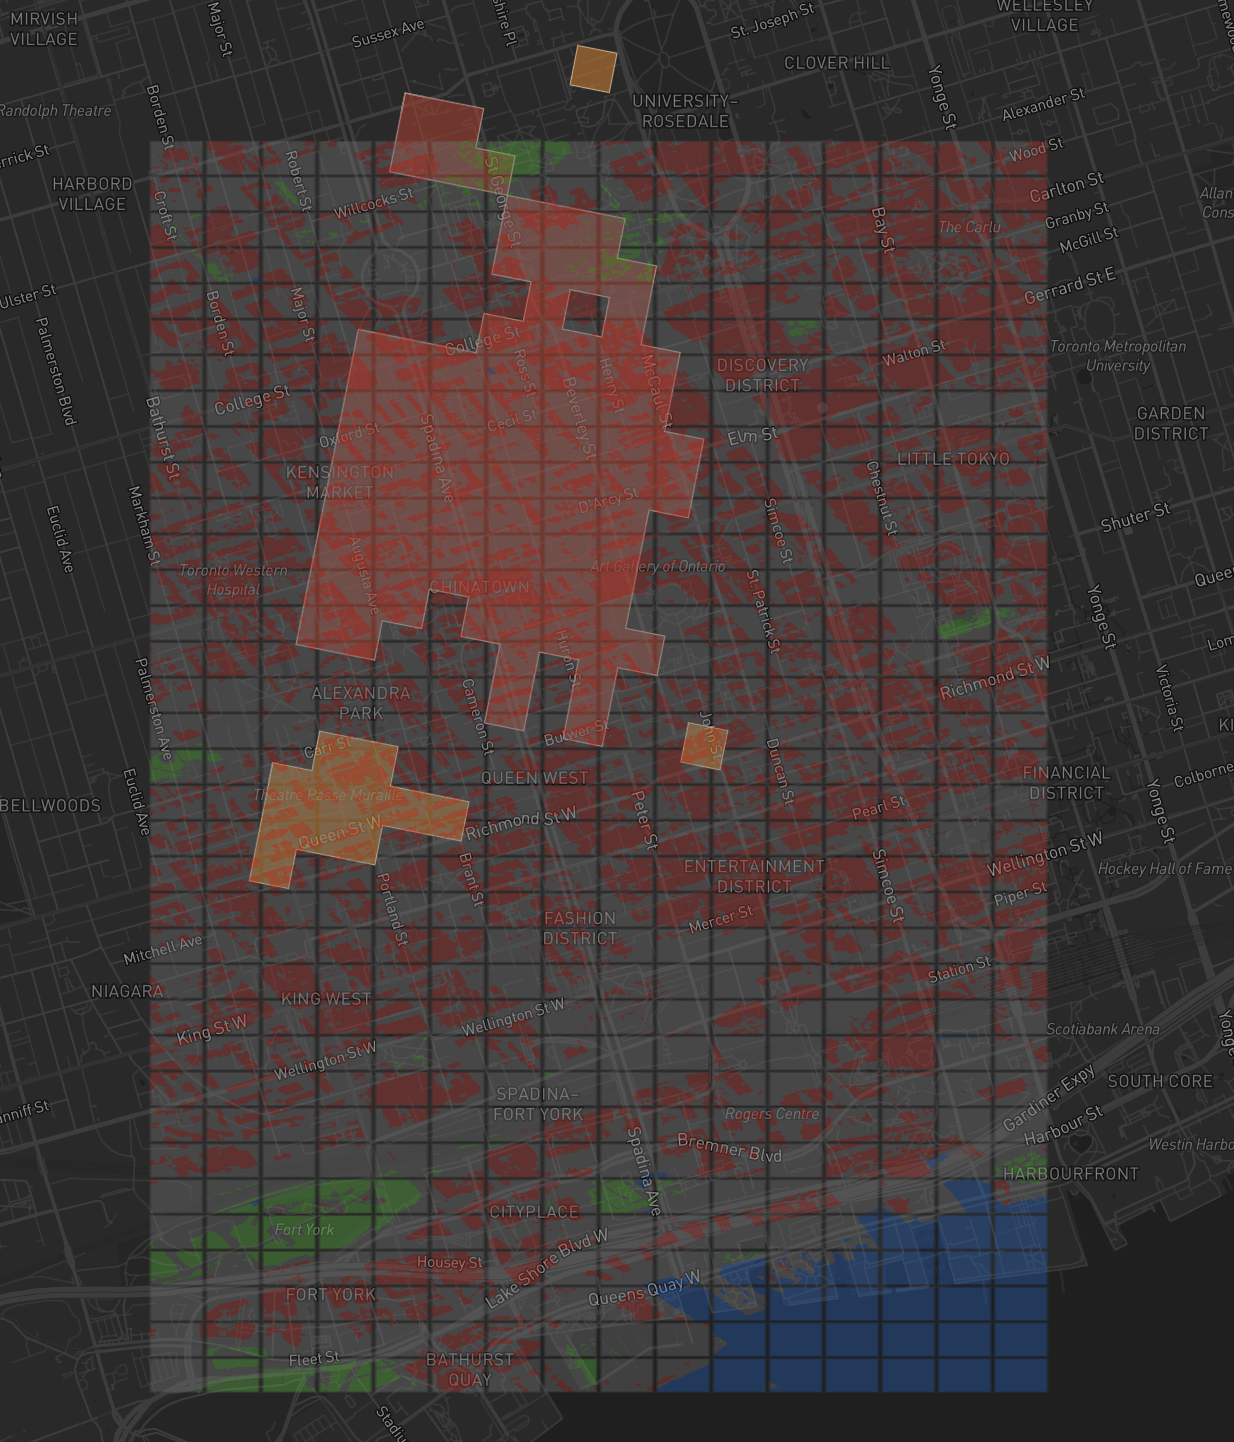
Image of Map when code is Ran
Inspiration
We came across the concept of urban heat islands, a phenomenon where dense city infrastructure traps heat, making urban areas significantly warmer than surrounding rural regions. Realizing this directly impacts public health and city planning, we built Scorched to give metropolitan planners and municipal governments an actionable tool to combat it, whether that means strategically planting trees, adjusting infrastructure, or redesigning urban zones.
https://share.vidyard.com/watch/diz51PuMthcKkrNx6Ck6r1
What it does
Scorched detects and visualizes urban heat islands across Toronto using satellite imagery, GIS data, and machine learning. It maps heat severity by zone and uses Gemini AI to generate plain-English recommendations for city planners to act on.
How we built it
We pulled orthophoto satellite imagery from ESRI and thermal data from Landsat via Google Earth Engine. We ran CV segmentation using SegFormer to classify land cover, combined it with StatCan and OSM GIS data, and trained an XGBoost model to predict relative heat per 100m grid cell. The backend runs on Vultr (FastAPI + object storage), the frontend is Next.js with Mapbox GL JS, and Gemini API generates the zone recommendations.
Challenges we ran into
Processing the sheer volume of grid data from ESRI's satellite imagery was brutal. Accumulating enough clean, sufficient data across thousands of grid cells to get accurate model results was our biggest bottleneck.
Accomplishments that we're proud of
After struggling with data volume and quality, we achieved a 400% increase in prediction accuracy once our pipeline was fully integrated. Getting the full stack, satellite imagery → ML inference → live map → Gemini summaries , working end to end in under 36 hours was something we're genuinely proud of.
What we learned
We learned CV segmentation and inference pipelines, XGBoost model training, Gemini API integration, and how to leverage Vultr for running scripts, storing data, and powering live map zones. We also got hands-on with Mapbox GL JS for geospatial visualization, honestly pretty neat.
What's next for Scorched
The current demo covers a specific region within Toronto. Next steps are expanding coverage nationwide across Canadian cities, and eventually building it into a real tool municipal governments can integrate into their urban planning workflows.
Built With
- fastapi
- gemini-api
- geopandas
- google-cloud
- google-earth-engine
- mapbox-gl-js
- next.js
- osmnx
- pyarrow
- python
- segformer
- shapely
- typescript
- vultr
- xgboost


Log in or sign up for Devpost to join the conversation.