-
-

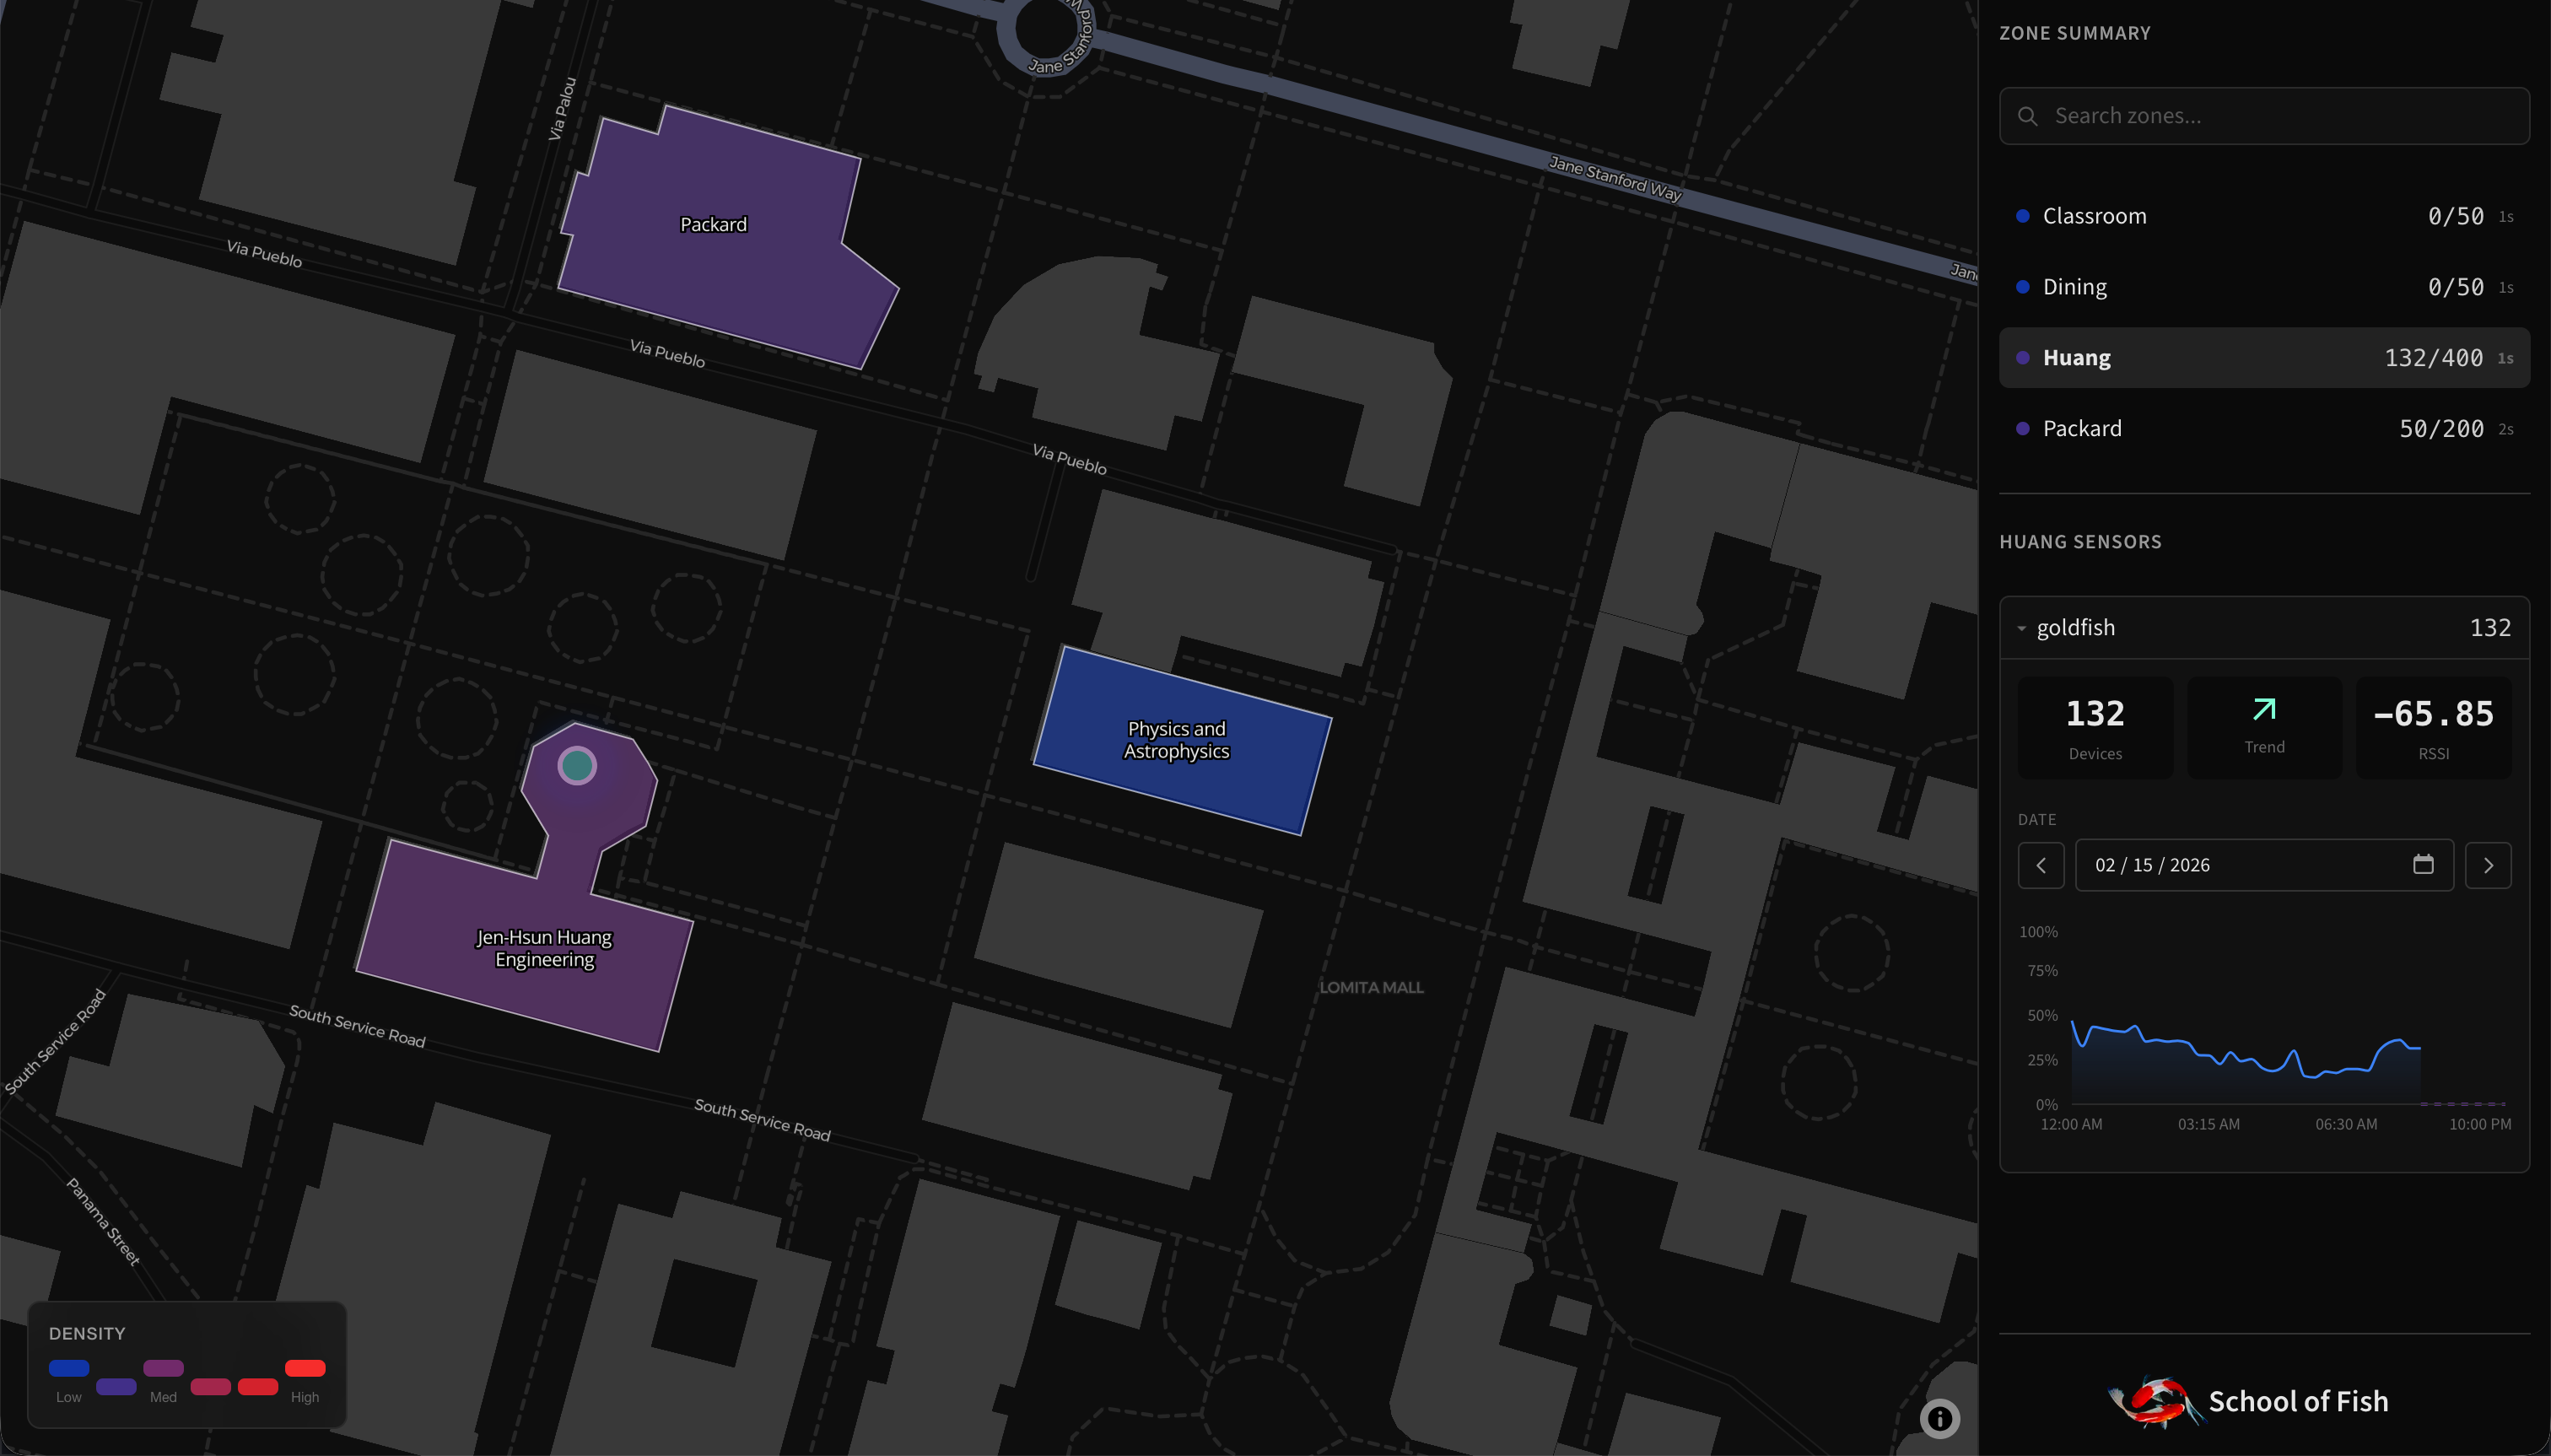
interactive map
-
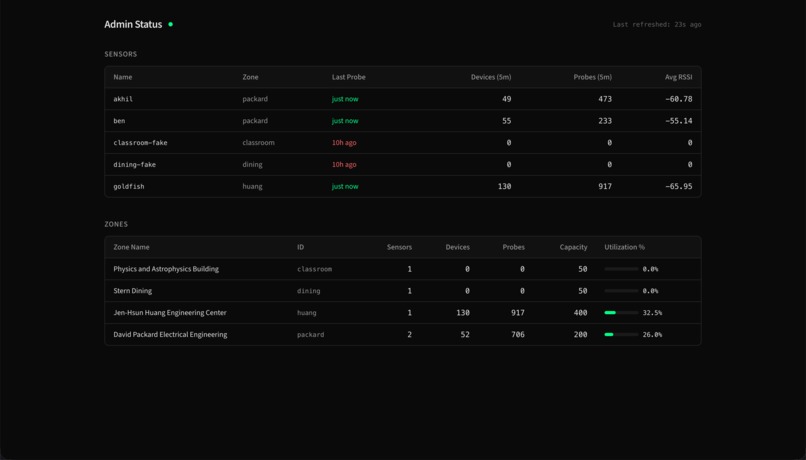
admin view
-
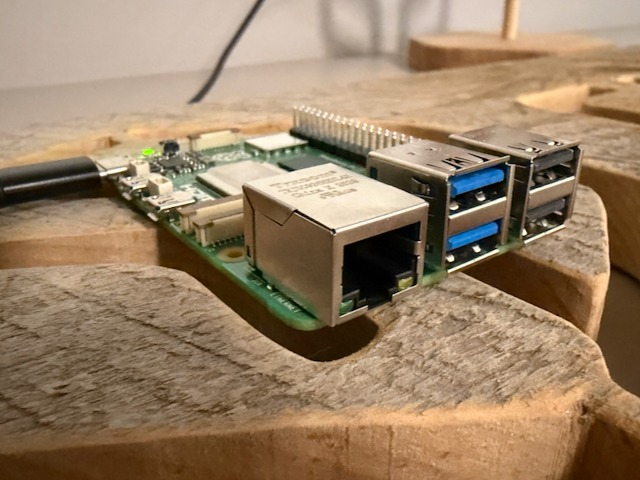
raspberry pi monitoring device


Inspiration
We’ve all been there: you desperately need to find a quiet place to study, but every room is taken.
The Vision
Our project, School of Fish, is designed to solve this. It works by placing inexpensive Raspberry Pi-based devices in each classroom and study room. These devices analyze the nearby Bluetooth, or more specifically Bluetooth Low Energy, signals emitted from occupants’ devices (phones, laptops, headphones, smart watches) to estimate the number of occupants in the room. Furthermore, by feeding this data through forecasting algorithms and machine learning models, we can accurately predict when a room is most likely to be vacant days in advance.
One benefit of using Bluetooth signals over a computer vision-based solution is that it’s inherently anonymous. The only data we can get out of a Bluetooth signal is a 36 character long randomized identifier, and these are often rotated as frequently as every 15 minutes.
Each device communicates with a central ingest API, periodically reporting the number of signals detected in a given room. These signals are stored in a database and plotted on an interactive map. This allows students to find available study spaces all across campus.
Because it’s 2026, School of Fish also implements an MCP server. This allows interacting with School of Fish data through your favorite AI agents such as Poke, Claude, and Openclawd. Along with accessing the data, it works really well with calendar integration for scheduling study sessions at optimal times.
For campuses, the data our systems provide can help them to determine which buildings on campus they need to expand or bring more attention to. It can also be used to analyze trends in time spent studying and correlations with student mental health during particularly stressful periods.
How we built it
School of Fish consists of four main components: the site monitoring devices, ingest API, interactive map, and MCP server. The ingest API, written in Go, is responsible for collecting data from each device across a college campus. This data is stored in a PostgreSQL database using the TimescaleDB and PostGIS extensions for aggregating temporal and efficient spatial querying.
The interactive map and admin panel are a Next.js app written in TypeScript. The map uses OpenStreetMap imagery and GeoJSON data extracted from Stanford’s campus map to overlay accurate and interactive heatmaps of each building and its tracked study areas. When a study room is selected, a time-series graph is displayed showing historic and forecasted (future) occupancy based on data from days and weeks prior. These predictions are calculated using Holt-Winters seasonal forecasting which works best with our limited dataset.
The on-site monitors are completely passive devices with software written in Python that periodically scan for nearby Bluetooth Low Energy Devices with a signal strength above a certain threshold. The data is then sent securely over a Tailscale VPN to the ingest API.
The MCP server provides agents with advanced querying capabilities of current and forecasted traffic around campus. We opted to create a general AI integration over a custom one which allows our project to integrate with agents that people already use. This also enables working in tangent with their other integrations such as calendar management.
Challenges we ran into
The main challenge for this project is that forecasting requires a large amount of historical data. We opted to use weekly seasonality for our forecasting, which means it will recognize weekly trends such as a class that only meets on Monday afternoons, and it won’t influence the forecast of Tuesday afternoons. However, in order to perform forecasts this way, we would need at least two weeks of prior data, which obviously isn’t possible in a 36 hour hackathon. For the sake of demonstration we synthesized historic data based on the 24-ish hours of data collection we were able to perform during the hackathon.
Originally, we planned to track the volume of WiFi packets as a means of measuring the number of people in a room, however, we found that this method was very dependent on the environment (e.g. access point setup, firewalling). Bluetooth Low Energy, which is emitted by the vast majority of modern consumer electronics, was a far more accurate way to measure human presence since it can be readily picked up without dependence on network configuration.
Accomplishments that we're proud of
Ben - One of the coolest moments of the hackathon was getting the BLE sensors working. We took many walks with our laptops outside away from the buildings just to watch the number of nearby devices drop to zero, and immediately jump back up when we walked back near the buildings.
Akhil - My favorite moment was waking up Saturday morning after my laptop had been collecting real data all night and seeing the gradual drop off at night and massive influx of devices at 9AM.
What we learned
- Bluetooth may not be the best data transfer protocol, but its widespread use makes it a simple and anonymous metric for room occupancy.
- Accurate data forecasting is incredibly complex and requires a lot of raw data.
- AI can be, but is not a guaranteed speed boost in writing code. Writing code with AI is a path that has many traps you can fall down. For example, we completely rewrote the UI after AI skipped over major UX red flags.
What's next for School of Fish
There are so many ways this could be expanded and integrated into students’ lives:
- Automatically booking a room using the college’s booking system
- Automatically finding study rooms that fit into the schedules of students working on a group project
- Determining the average turnaround time for a study room
- Siri/voice assistant integration, “Hey Siri, find me an open study room”
Additionally, it could also be used in settings beyond college campuses:
- Tracking how busy restaurants are
- Tracking attendance at event venues
Built With
- ai
- bluetooth
- data-science
- go
- machine-learning
- mcp
- nextjs
- postgresql
- python
- raspberry-pi
- timescaledb
- typescript

Log in or sign up for Devpost to join the conversation.