-
-

Image_of_the_Dashboard
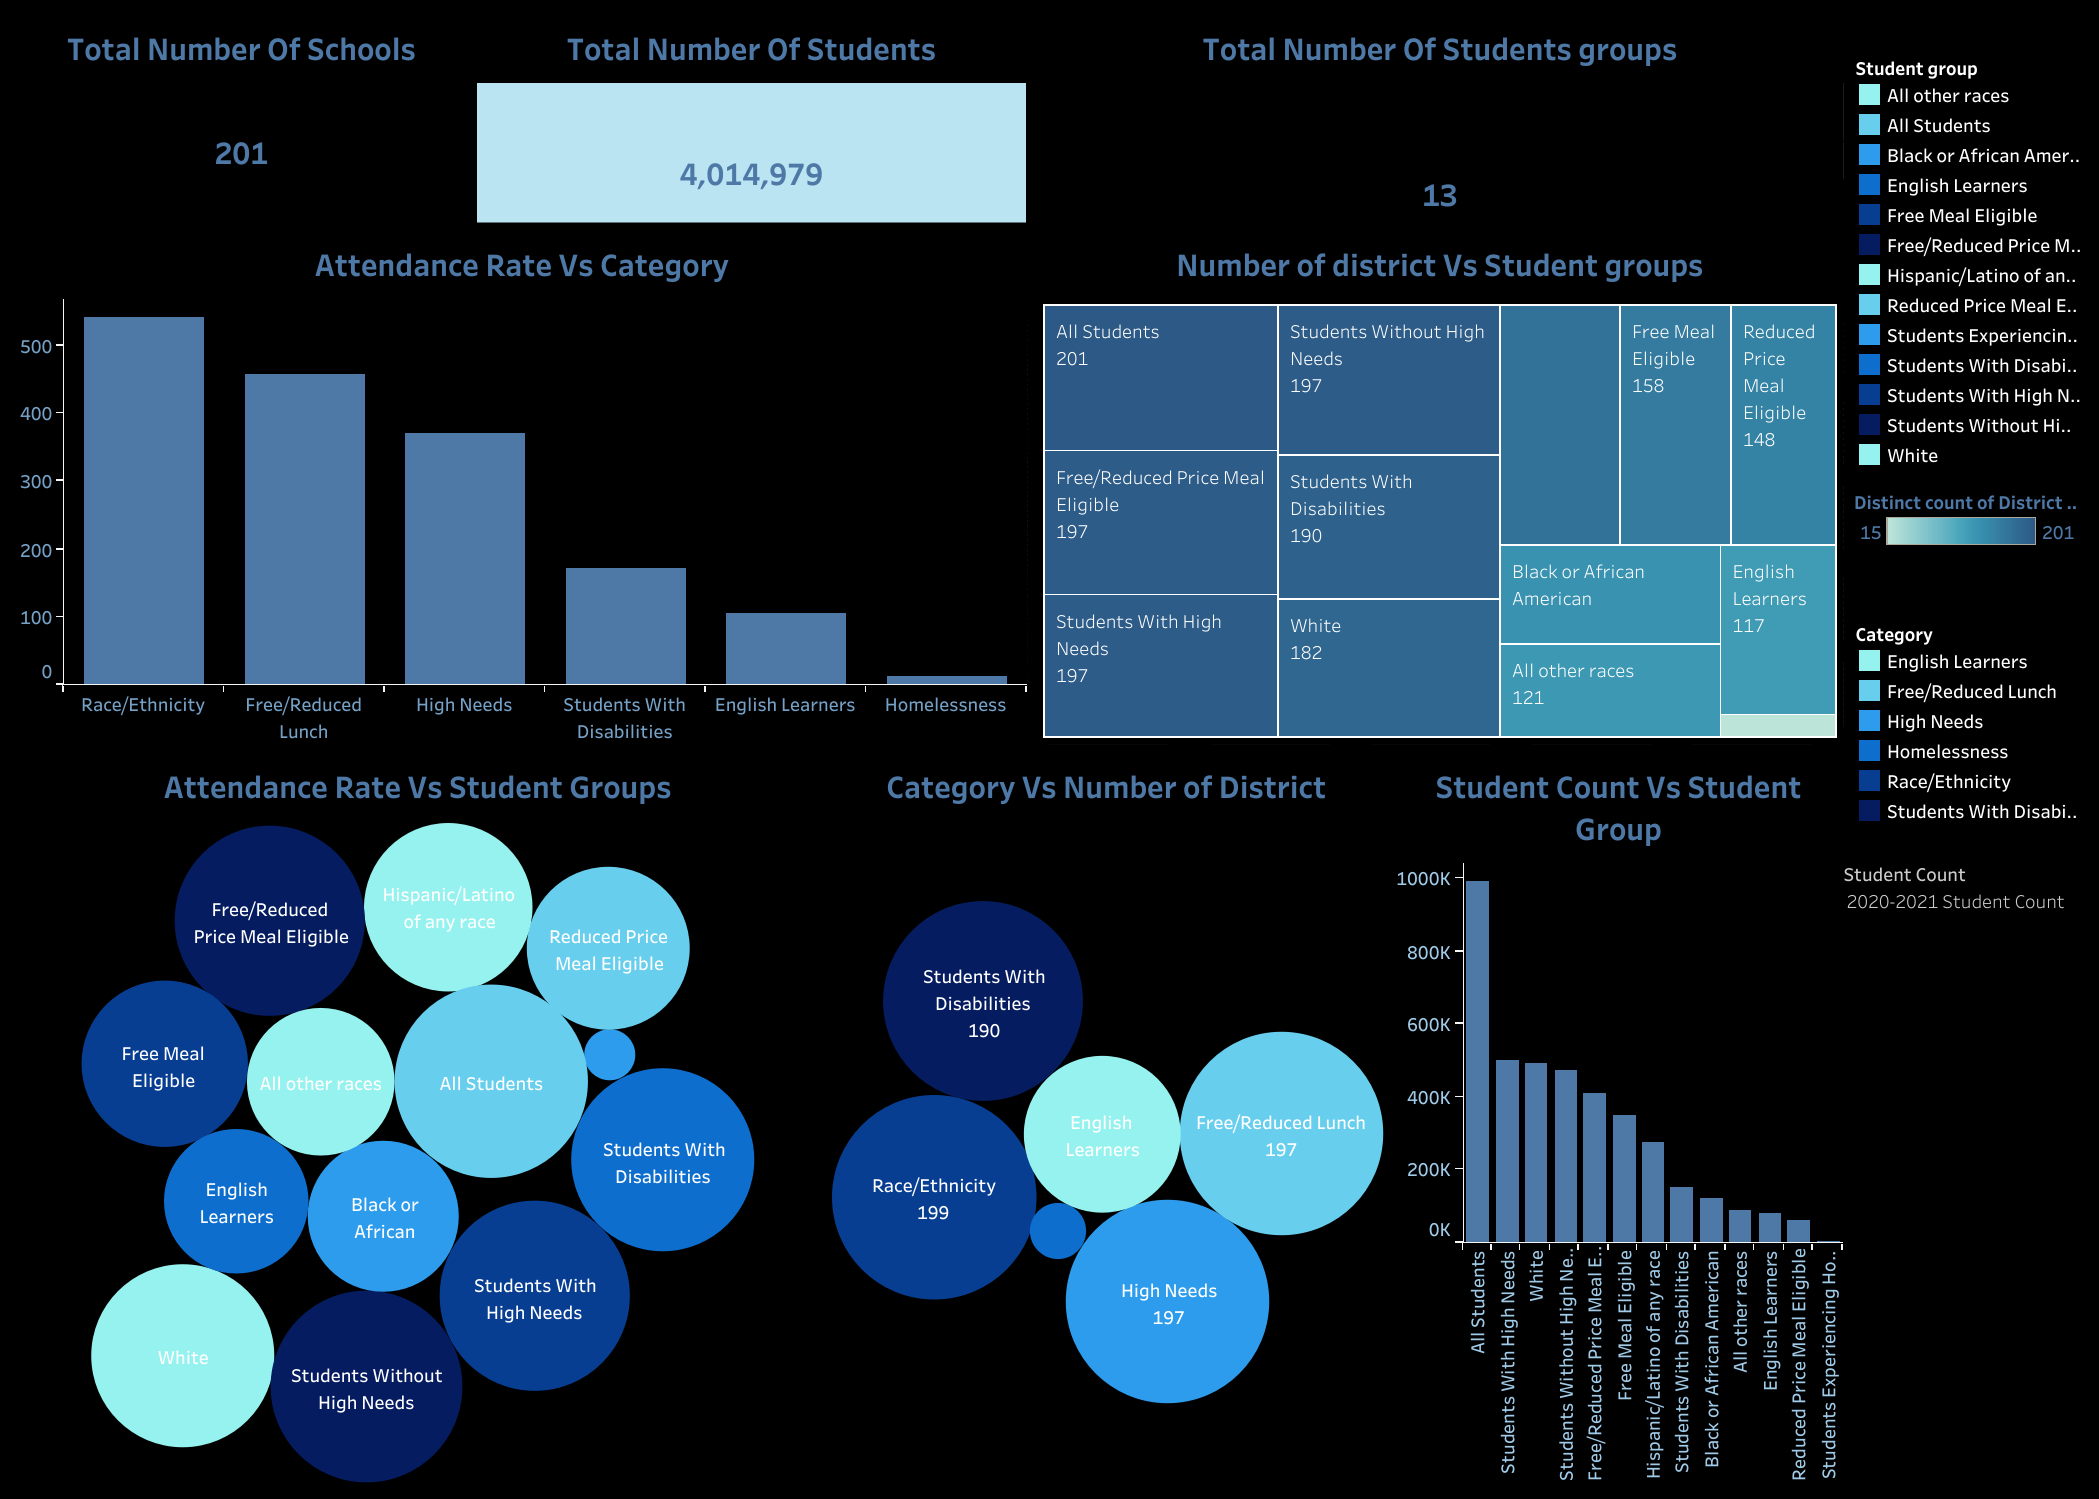
The dashboard i created provides insights into student groups, the number of schools, attendance rates, and the total number of students each year within a district.
Challenges Faced:
1). Integrating multiple datasets from various sources to ensure accuracy and consistency in the dashboard. 2). Addressing data quality issues, such as missing or inconsistent data entries, to maintain the reliability of the dashboard. 3). Designing an intuitive user interface that effectively communicates key insights while ensuring accessibility and ease of use for stakeholders. 4). Optimizing dashboard performance to handle large datasets and provide real-time updates as new data becomes available. 5). Overcoming technical challenges related to Tableau functionality and data visualization techniques to achieve the desired analytical outcomes.

Log in or sign up for Devpost to join the conversation.