-
-
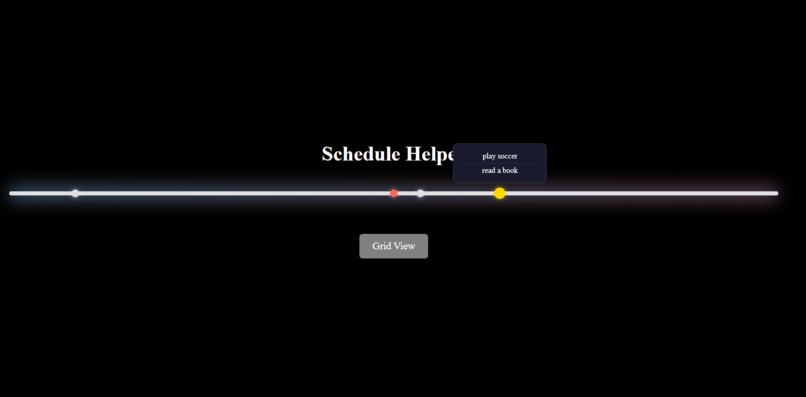
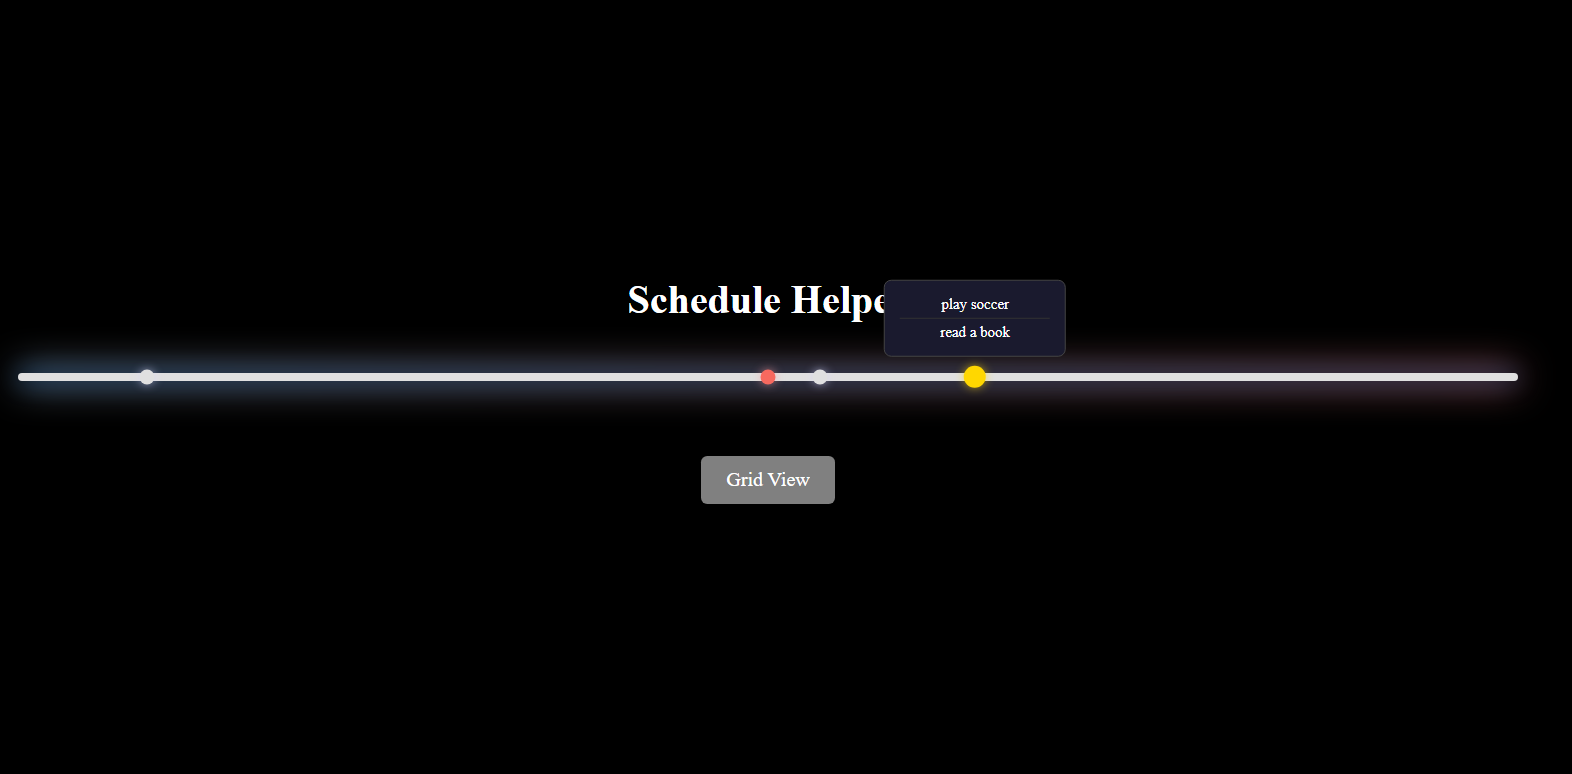
main page
-
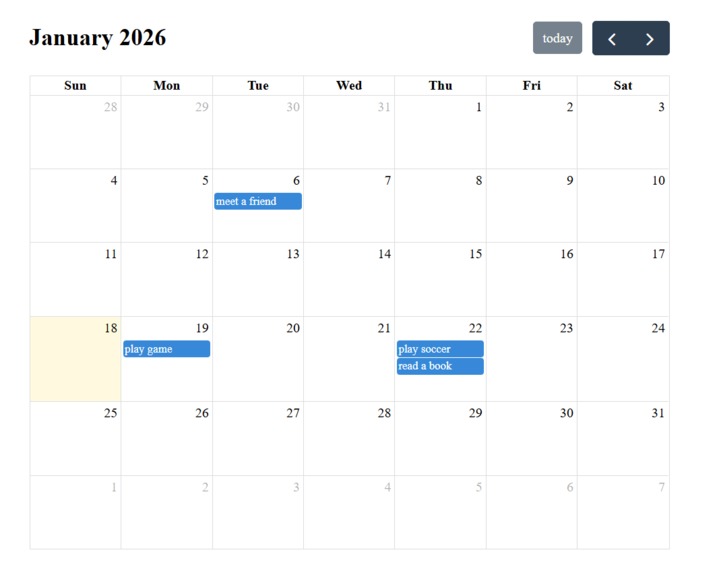
calendar page

Inspiration As a student juggling multiple courses and deadlines, I often found myself overwhelmed by scattered schedules. Traditional calendar apps show dates, but they don't give you that intuitive sense of "how close is this deadline, really?" I wanted a visual timeline that shows events relative to today — making it easier to feel the flow of time. What it does Schedule Helper provides two views:
Grid View: A traditional calendar powered by FullCalendar for adding and managing events Timeline View: A horizontal timeline centered on today, showing events within ±2 weeks as dots
Key features:
Today is marked with a red dot Multiple events on the same day appear as a glowing yellow dot Hover over any dot to see event titles in a tooltip
How I built it
Pure HTML, CSS, and JavaScript (no frameworks) FullCalendar library for the grid view localStorage for persistent event storage Custom CSS animations for the gradient glow effect on the timeline
Challenges I faced
Date handling: JavaScript's Date object and timezone quirks caused events to appear on wrong days. Fixed by explicitly parsing dates with 'T00:00:00'. Grouping same-day events: Had to restructure the rendering logic to group events by date before creating dots. Timeline scaling: Getting the dot positions to align correctly with the timeline boundaries required careful calculation of pixels-per-day.
What I learned
How to work with localStorage for client-side persistence DOM manipulation for dynamic, data-driven UI The importance of visual feedback (hover effects, color coding) for UX

Log in or sign up for Devpost to join the conversation.