-
-
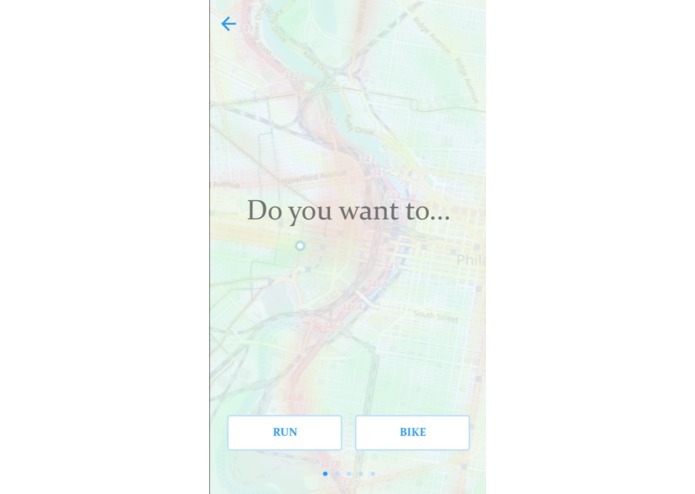
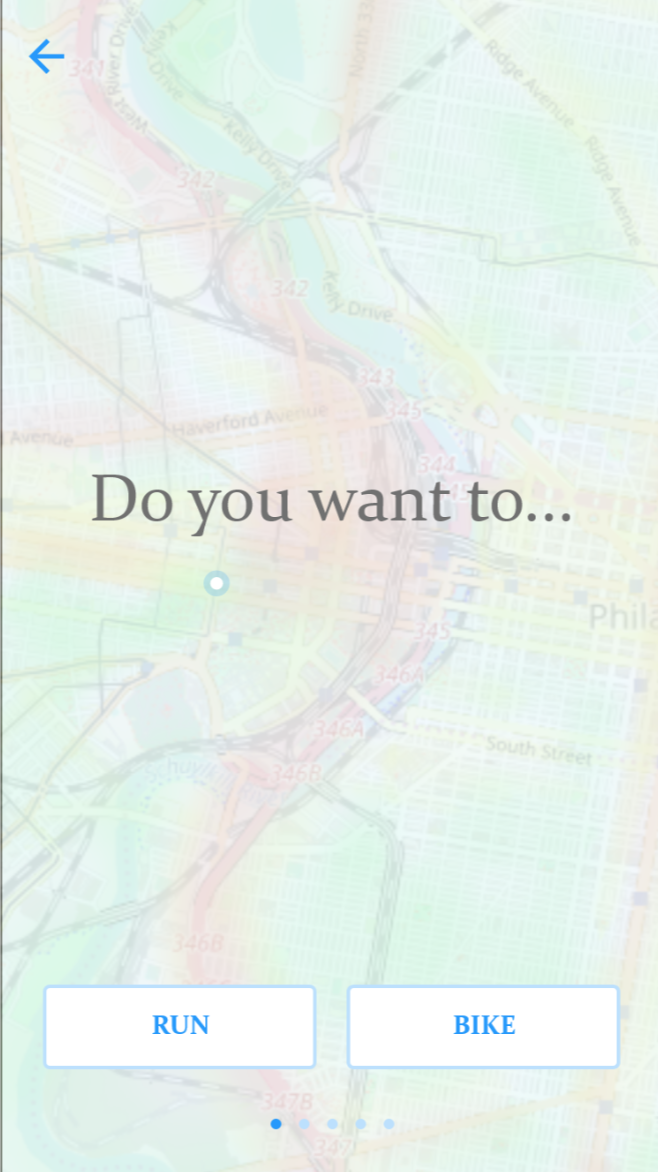
Chatbot
-
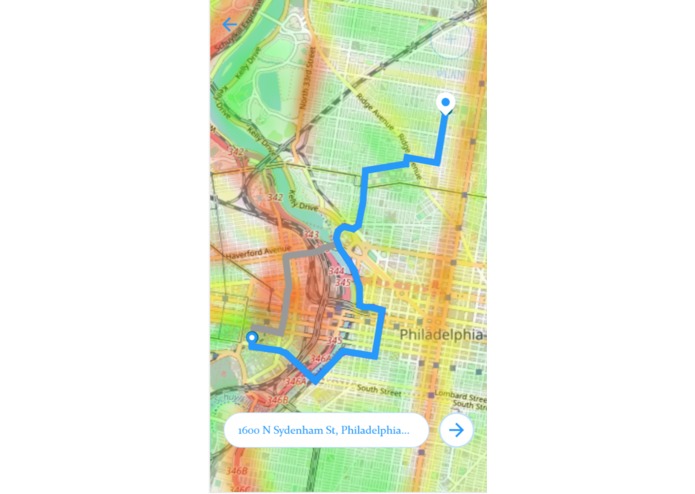
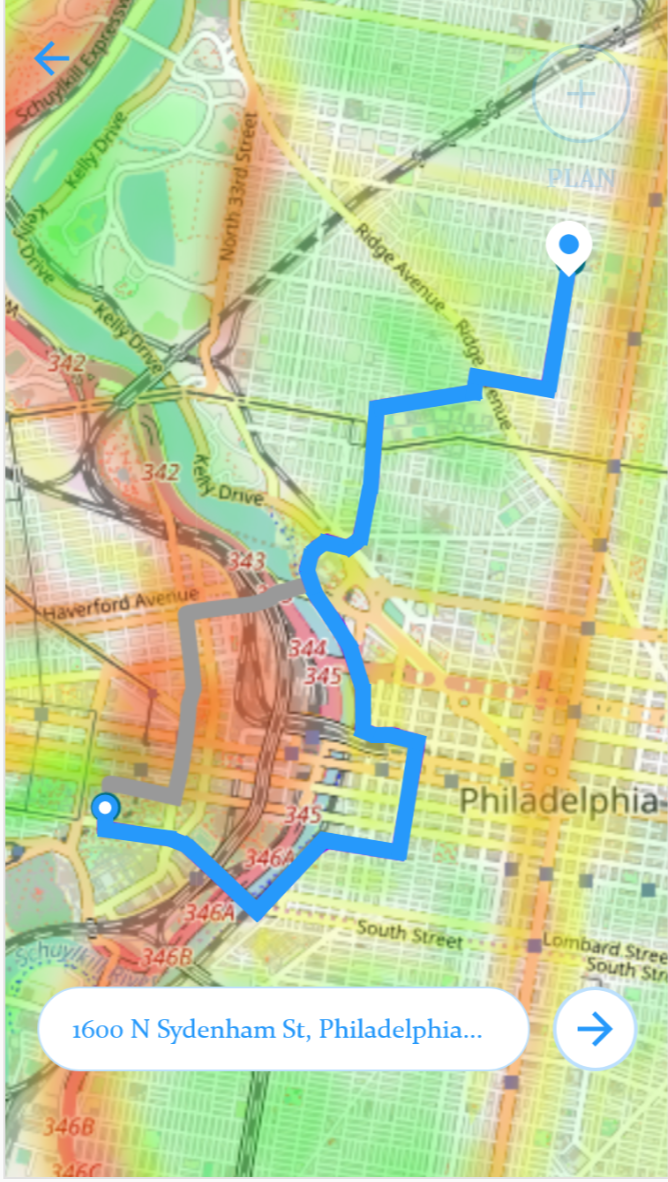
RouteOptions
-
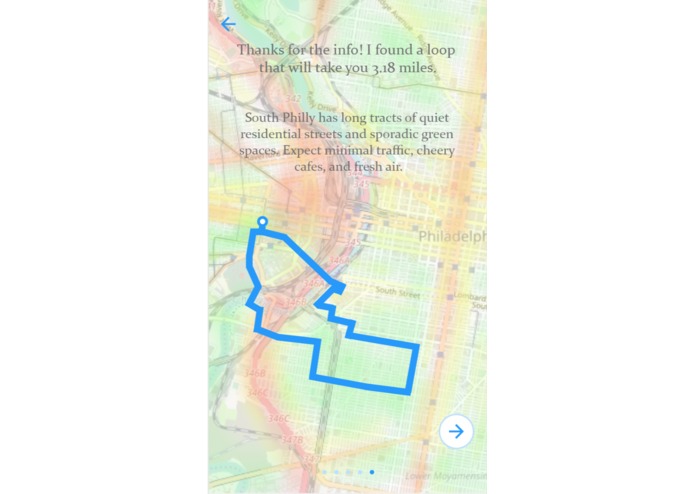
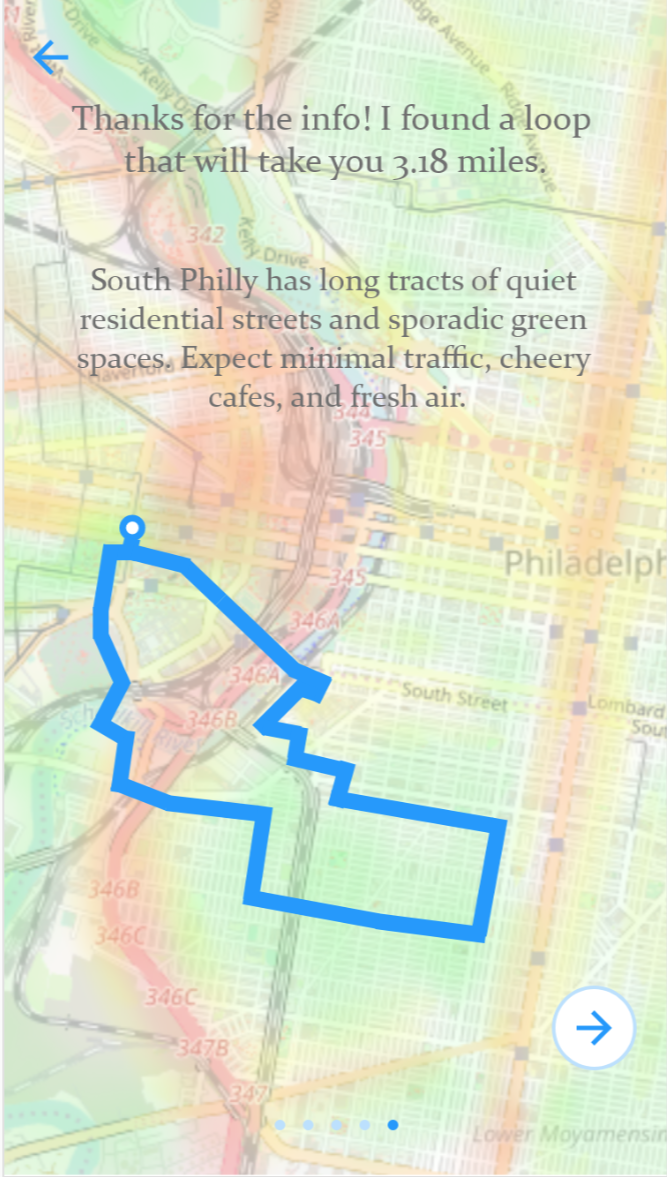
Exercise suggestion
-
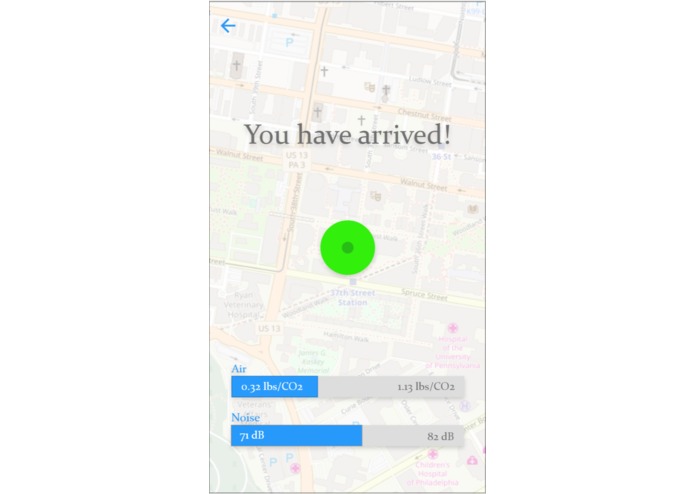
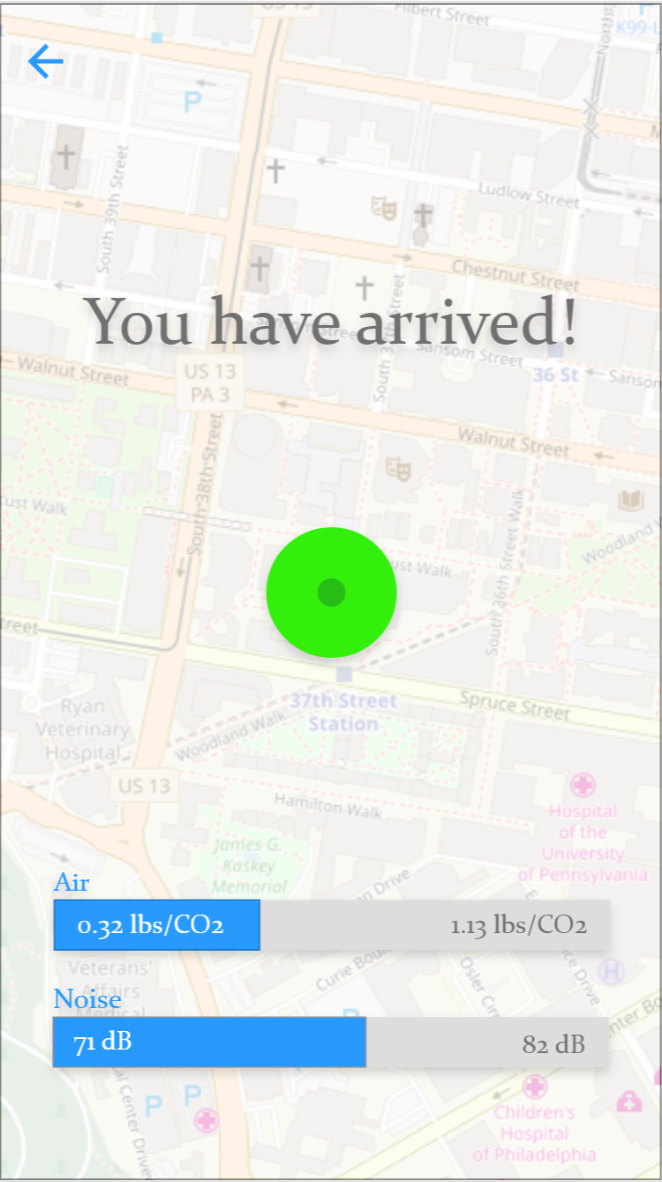
You've arrived
Scenic
30 second pitch
A non-linear navigation model for exercise that maximizes air quality and reduces noise pollution. Sometimes it's not always about getting there fast. Want directions that take an extra 10 minutes, but cut your air and noise pollution intake in half? We've got your Scenic route.
Story
Everyday, John and I ride our bikes to campus. We're both new to the city and finding a pleasant route is not always easy. Noise, air quality, and traffic all cause stress. Noticing a lack of solutions on the market, we came up with a better solution. From our conversations, Scenic is born.
Technical approach
The following is our idealized algorithm. Given time constraints, our focus was on a thoughtful conversation around the story and what the Scenic app would look like.
Building a non-linear routing algorithm is a multi-step process. First, we need to learn about our user. Relying on a chatbot conversation based on-boarding process, we get to know our user's preferences. Are you okay with a 10% longer route? How about a 30% longer route? Do you usually bike, or are you a runner? This data is stored and then later used in our route ranking algorithm.
At the root of all navigation models is a graph of road vectors. For our application, we use OpenStreetMap (OSM) data loaded into a PostGIS enabled Postgresql database to satisfy this requirement. Next, our routing algorithm requires consuming a collection of historical sources for route segment classification and scoring. Relatively weighting these data sources allows us to compute a Scenic score and create a grid index in Postgresql. Then, at the time of navigation, we run a search that optimizes routes based on our historical grid Scenic scores and returns the top 20 route options. Before returning results to the user, we query live data sources (traffic, AirNow.gov, etc.) to create a secondary on-the-fly ranking of the top 20 routes. Once this ranking computation is complete, we send the top 3 route options to the user's client app.
Once the user selects a route, we navigate the user either directly in their app, or via their Apple watch, Garmin, or Android Wear device. At the end of the trip, we show a visualization comparing how much air and noise pollution they avoided.
This model works well for developed countries and for cities with a rich network of accessible sensors. For developing countries (often areas where we see some of the worst pollution) this default ranking algorithm falls short. Fortunately, we have a novel solution. As we develop road segment scores in data-rich locales, we feed common trait data into a neural net classifier, allowing us to create a classification model for cities with low-fidelity data. This approach allows us to create Scenic scores for cities around the world.
Data sources
- Google traffic API
- Open Street Map (OSM)
- road width
- road type
- road direction
- Darksky.net
- Current temp
- Current wind vector
- Expert users
- uploaded known routes (segmented to help classify each road segment)
- IoT city sensors
- Microphones
- Air quality
- Machine learning
- Classification trained on other cities with rich data sources
- AirQualityNow.com
- PM2.5, PM5 levels
- Here.com
- Fastest route
- Map baselayers
- Open-elevation.com
Built With
- css
- express.js
- here.com
- html
- iot
- leaflet.js
- node.js
- postgis
- postgresql
- react
- typescript


Log in or sign up for Devpost to join the conversation.