-
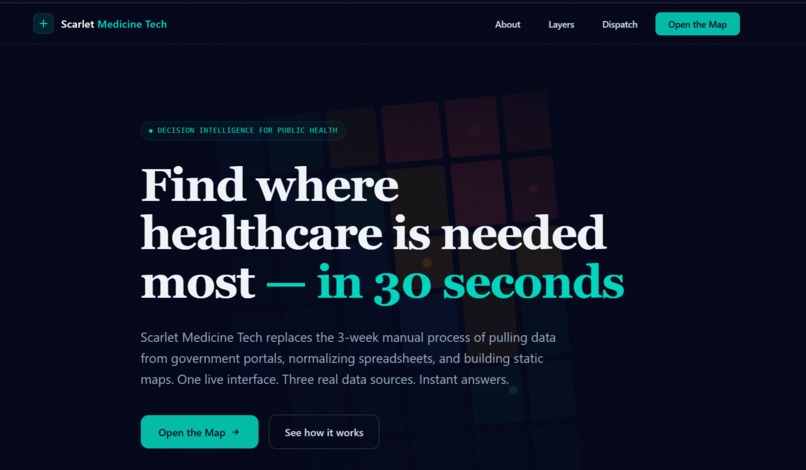
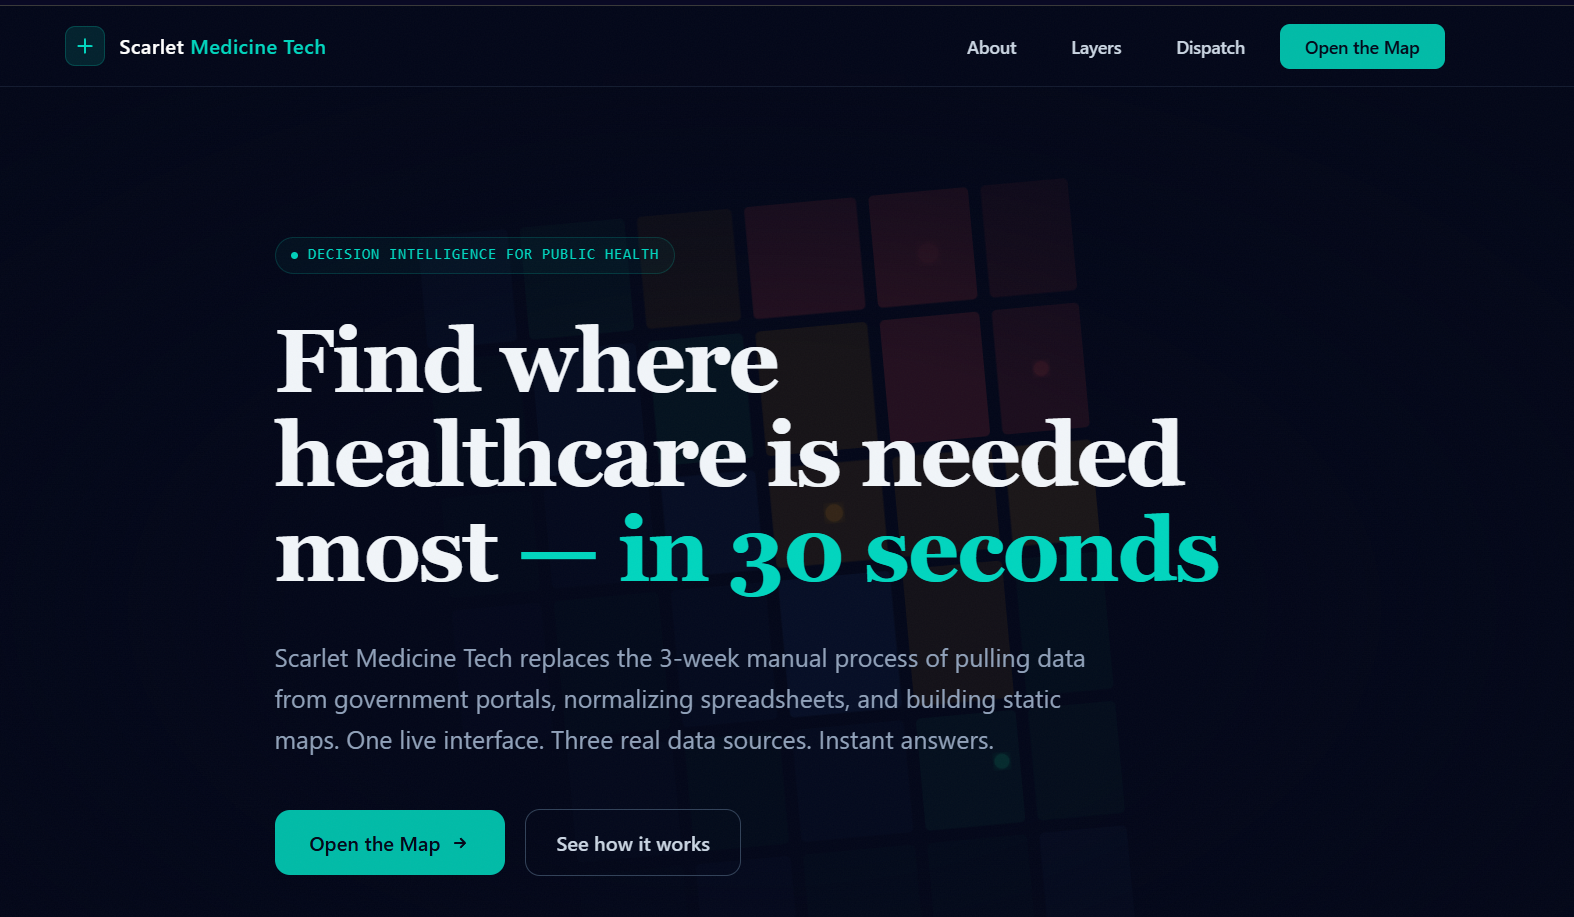
landingpage
-
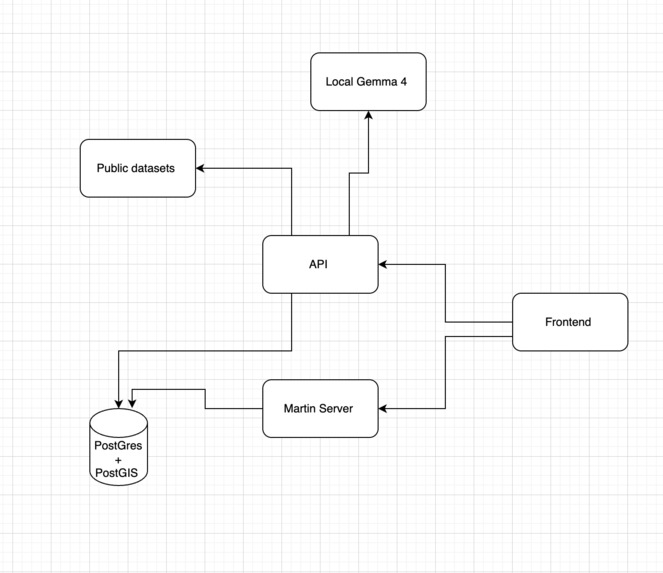
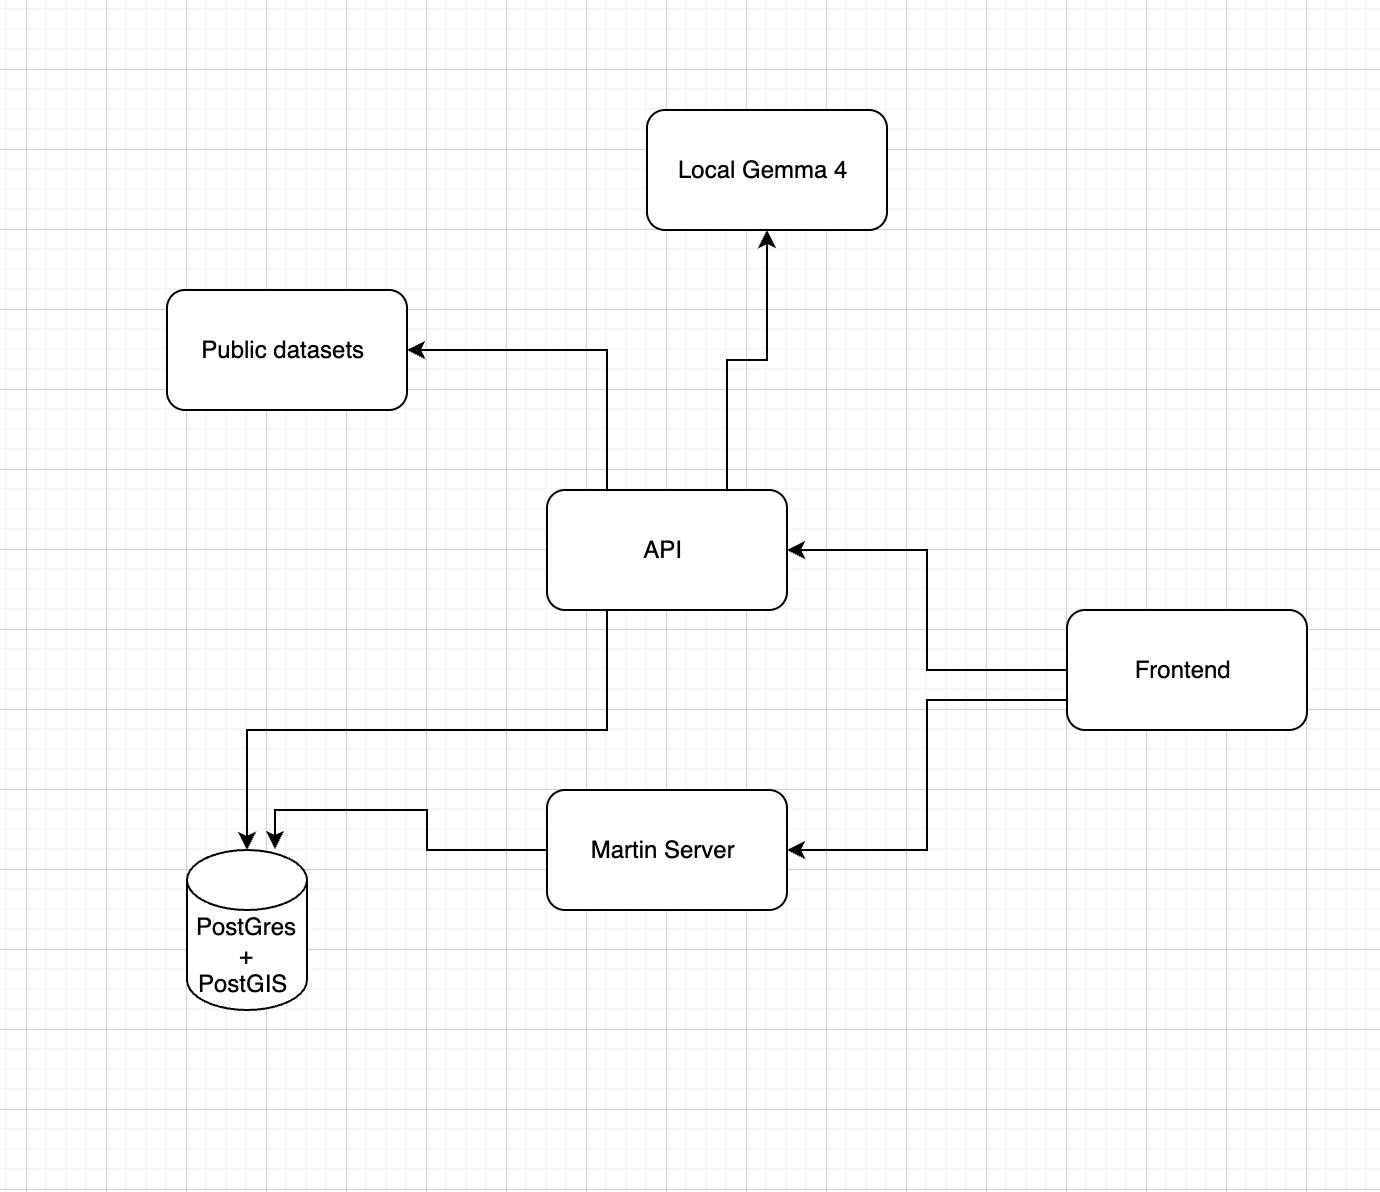
Architecture diagram
-

-
Inspiration
What it does
How we built it
Challenges we ran into
Accomplishments that we're proud of
What we learned
What's next for Scarlet Medicine Tech
Chicago Healthcare Desert Navigator
In Chicago, where you live still determines where you get care and how good it is.
Inspiration
Chicago's community areas have wildly unequal access to healthcare. Dispatchers today send patients to the nearest hospital, not the most capable one for their condition. City planners and community organizations lack a single view of where healthcare deserts are forming where disease burden is high, clinics are scarce, and residents face the greatest socioeconomic barriers all at once. We built this to make that invisible problem visible, and to give both dispatchers and patients a smarter way to find care.
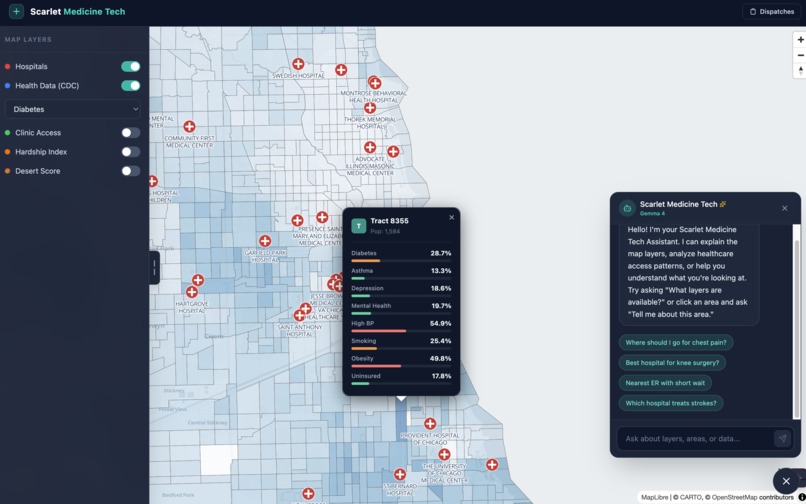
What It Does
A full-stack GIS application that pulls from four public datasets — CDC disease burden, Chicago clinic locations, CMS hospital outcomes, and the city's economic hardship index — and synthesizes them into two tools:
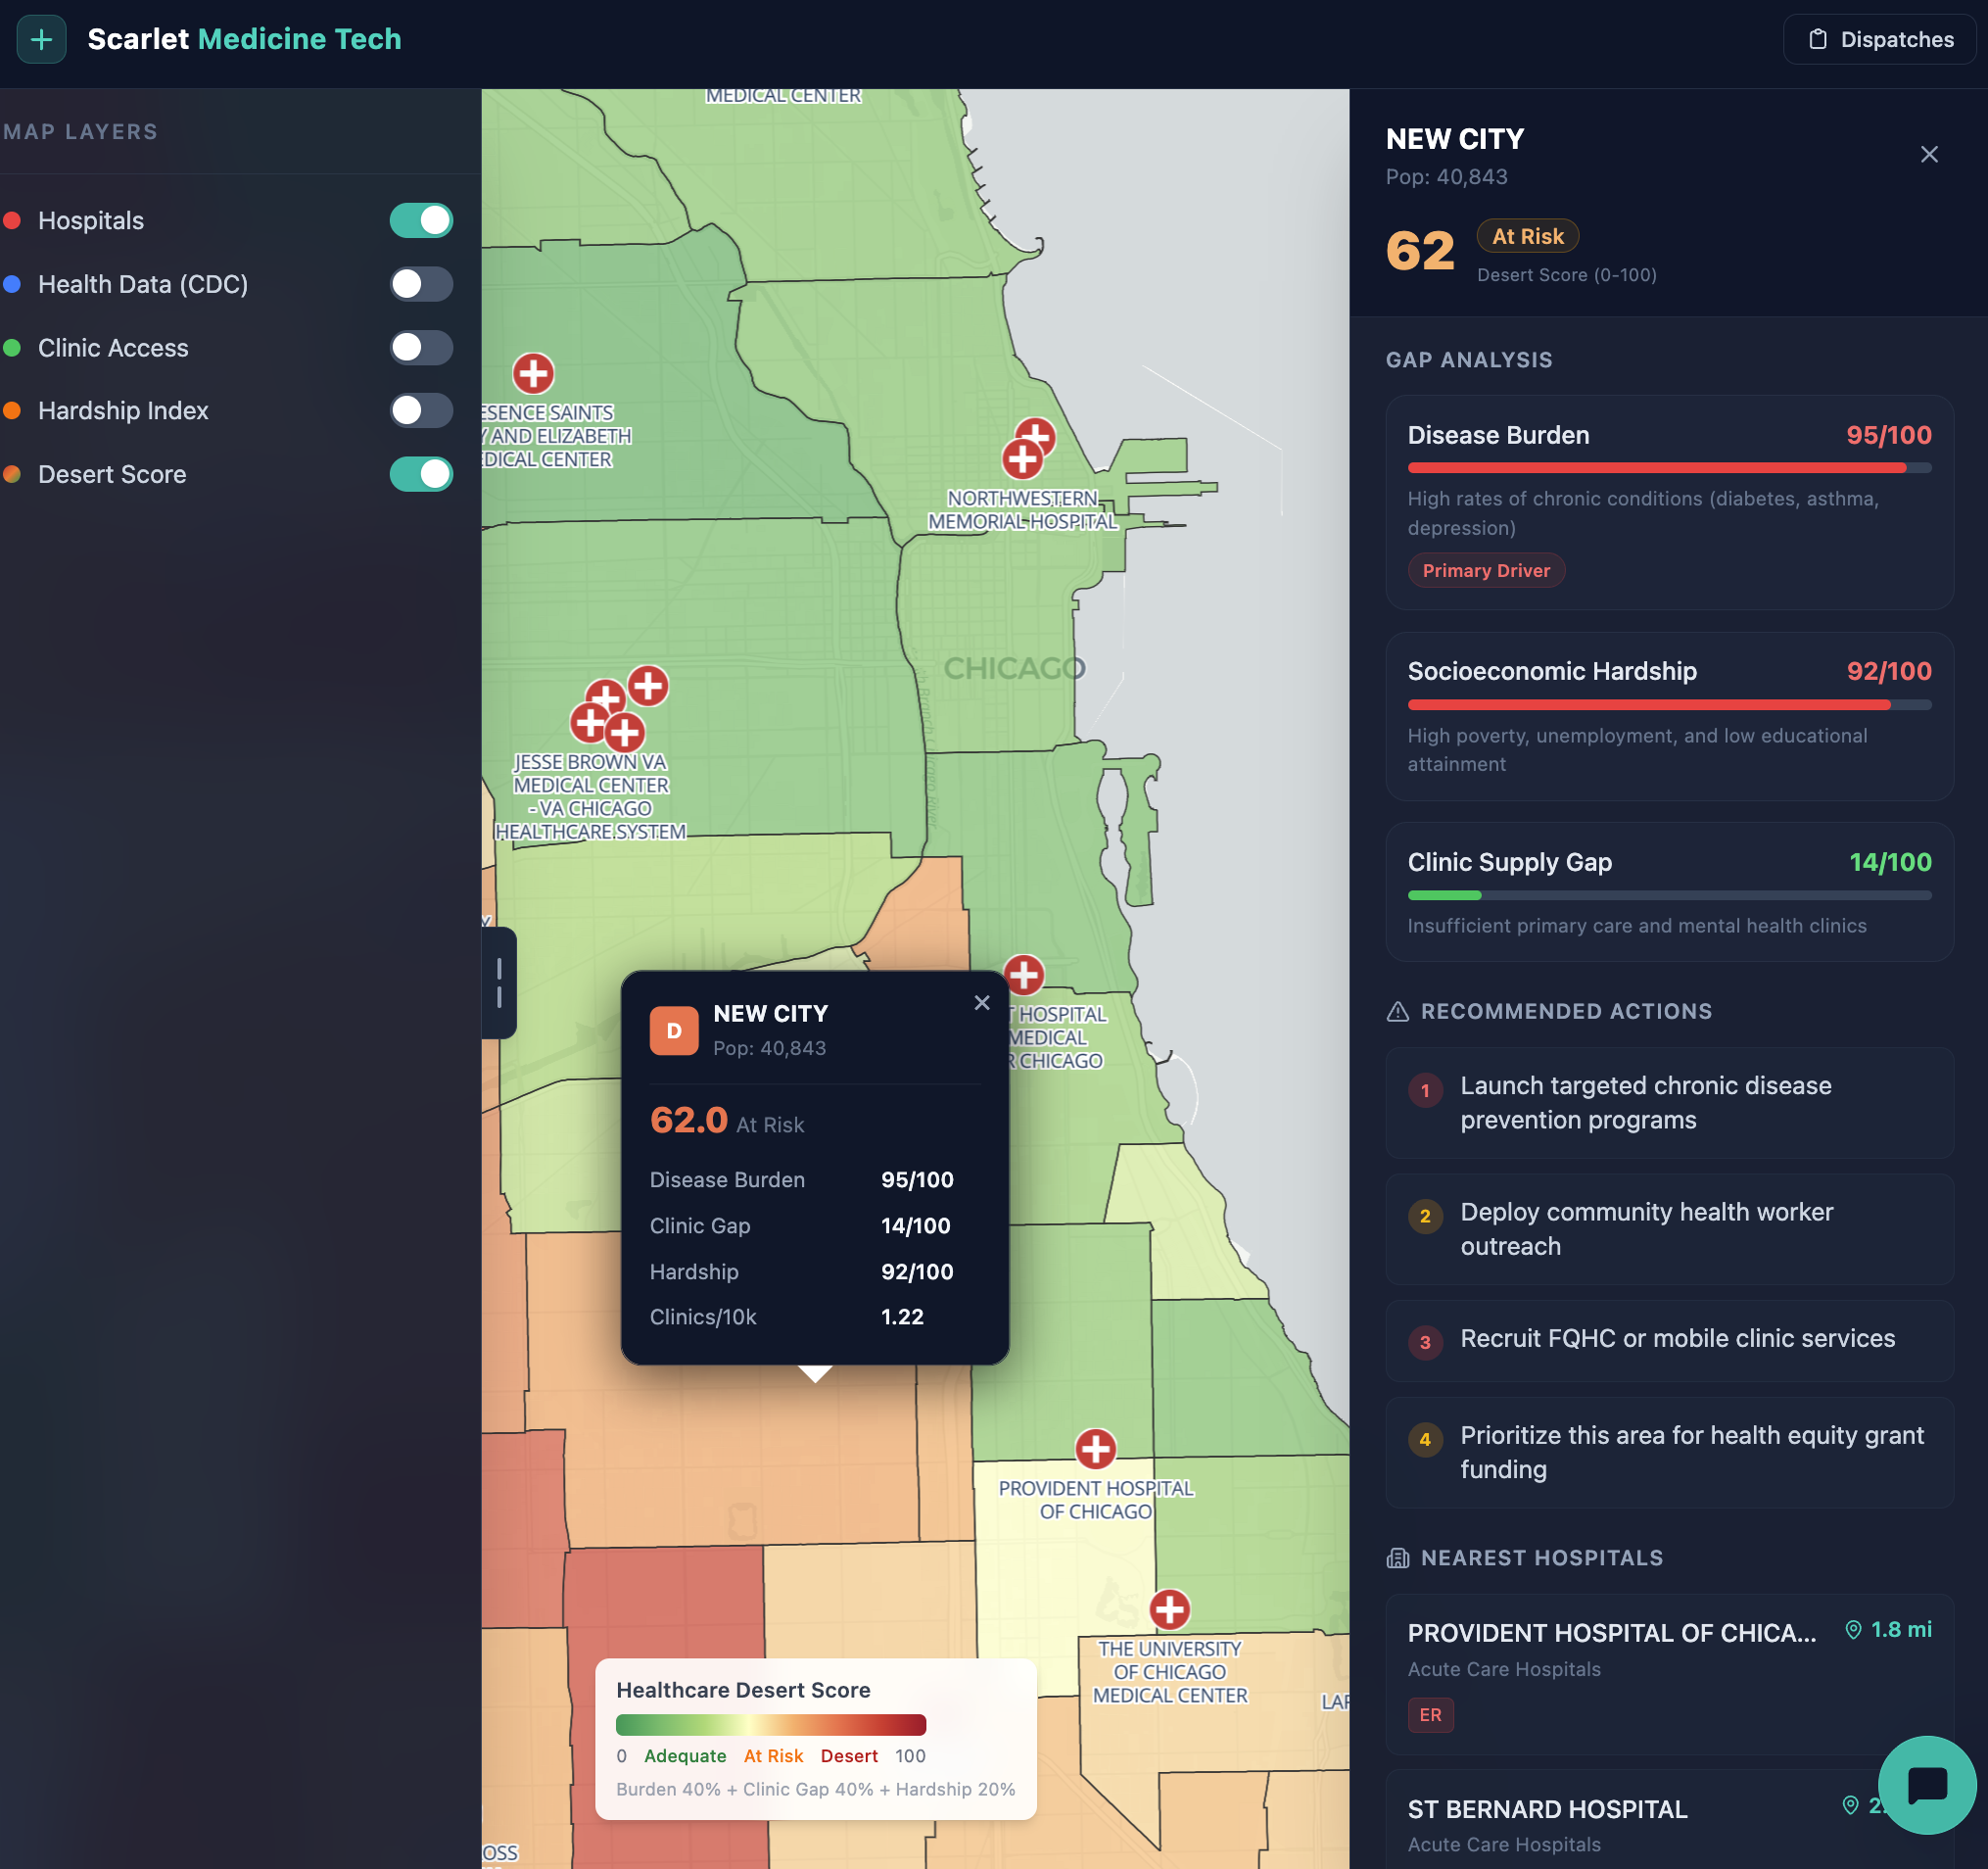
A neighborhood healthcare desert map — every one of Chicago's community areas is scored on a composite 0–100 index that combines disease burden, clinic supply gap, and socioeconomic hardship. The map makes it immediately clear which neighborhoods are being failed and on which dimension.
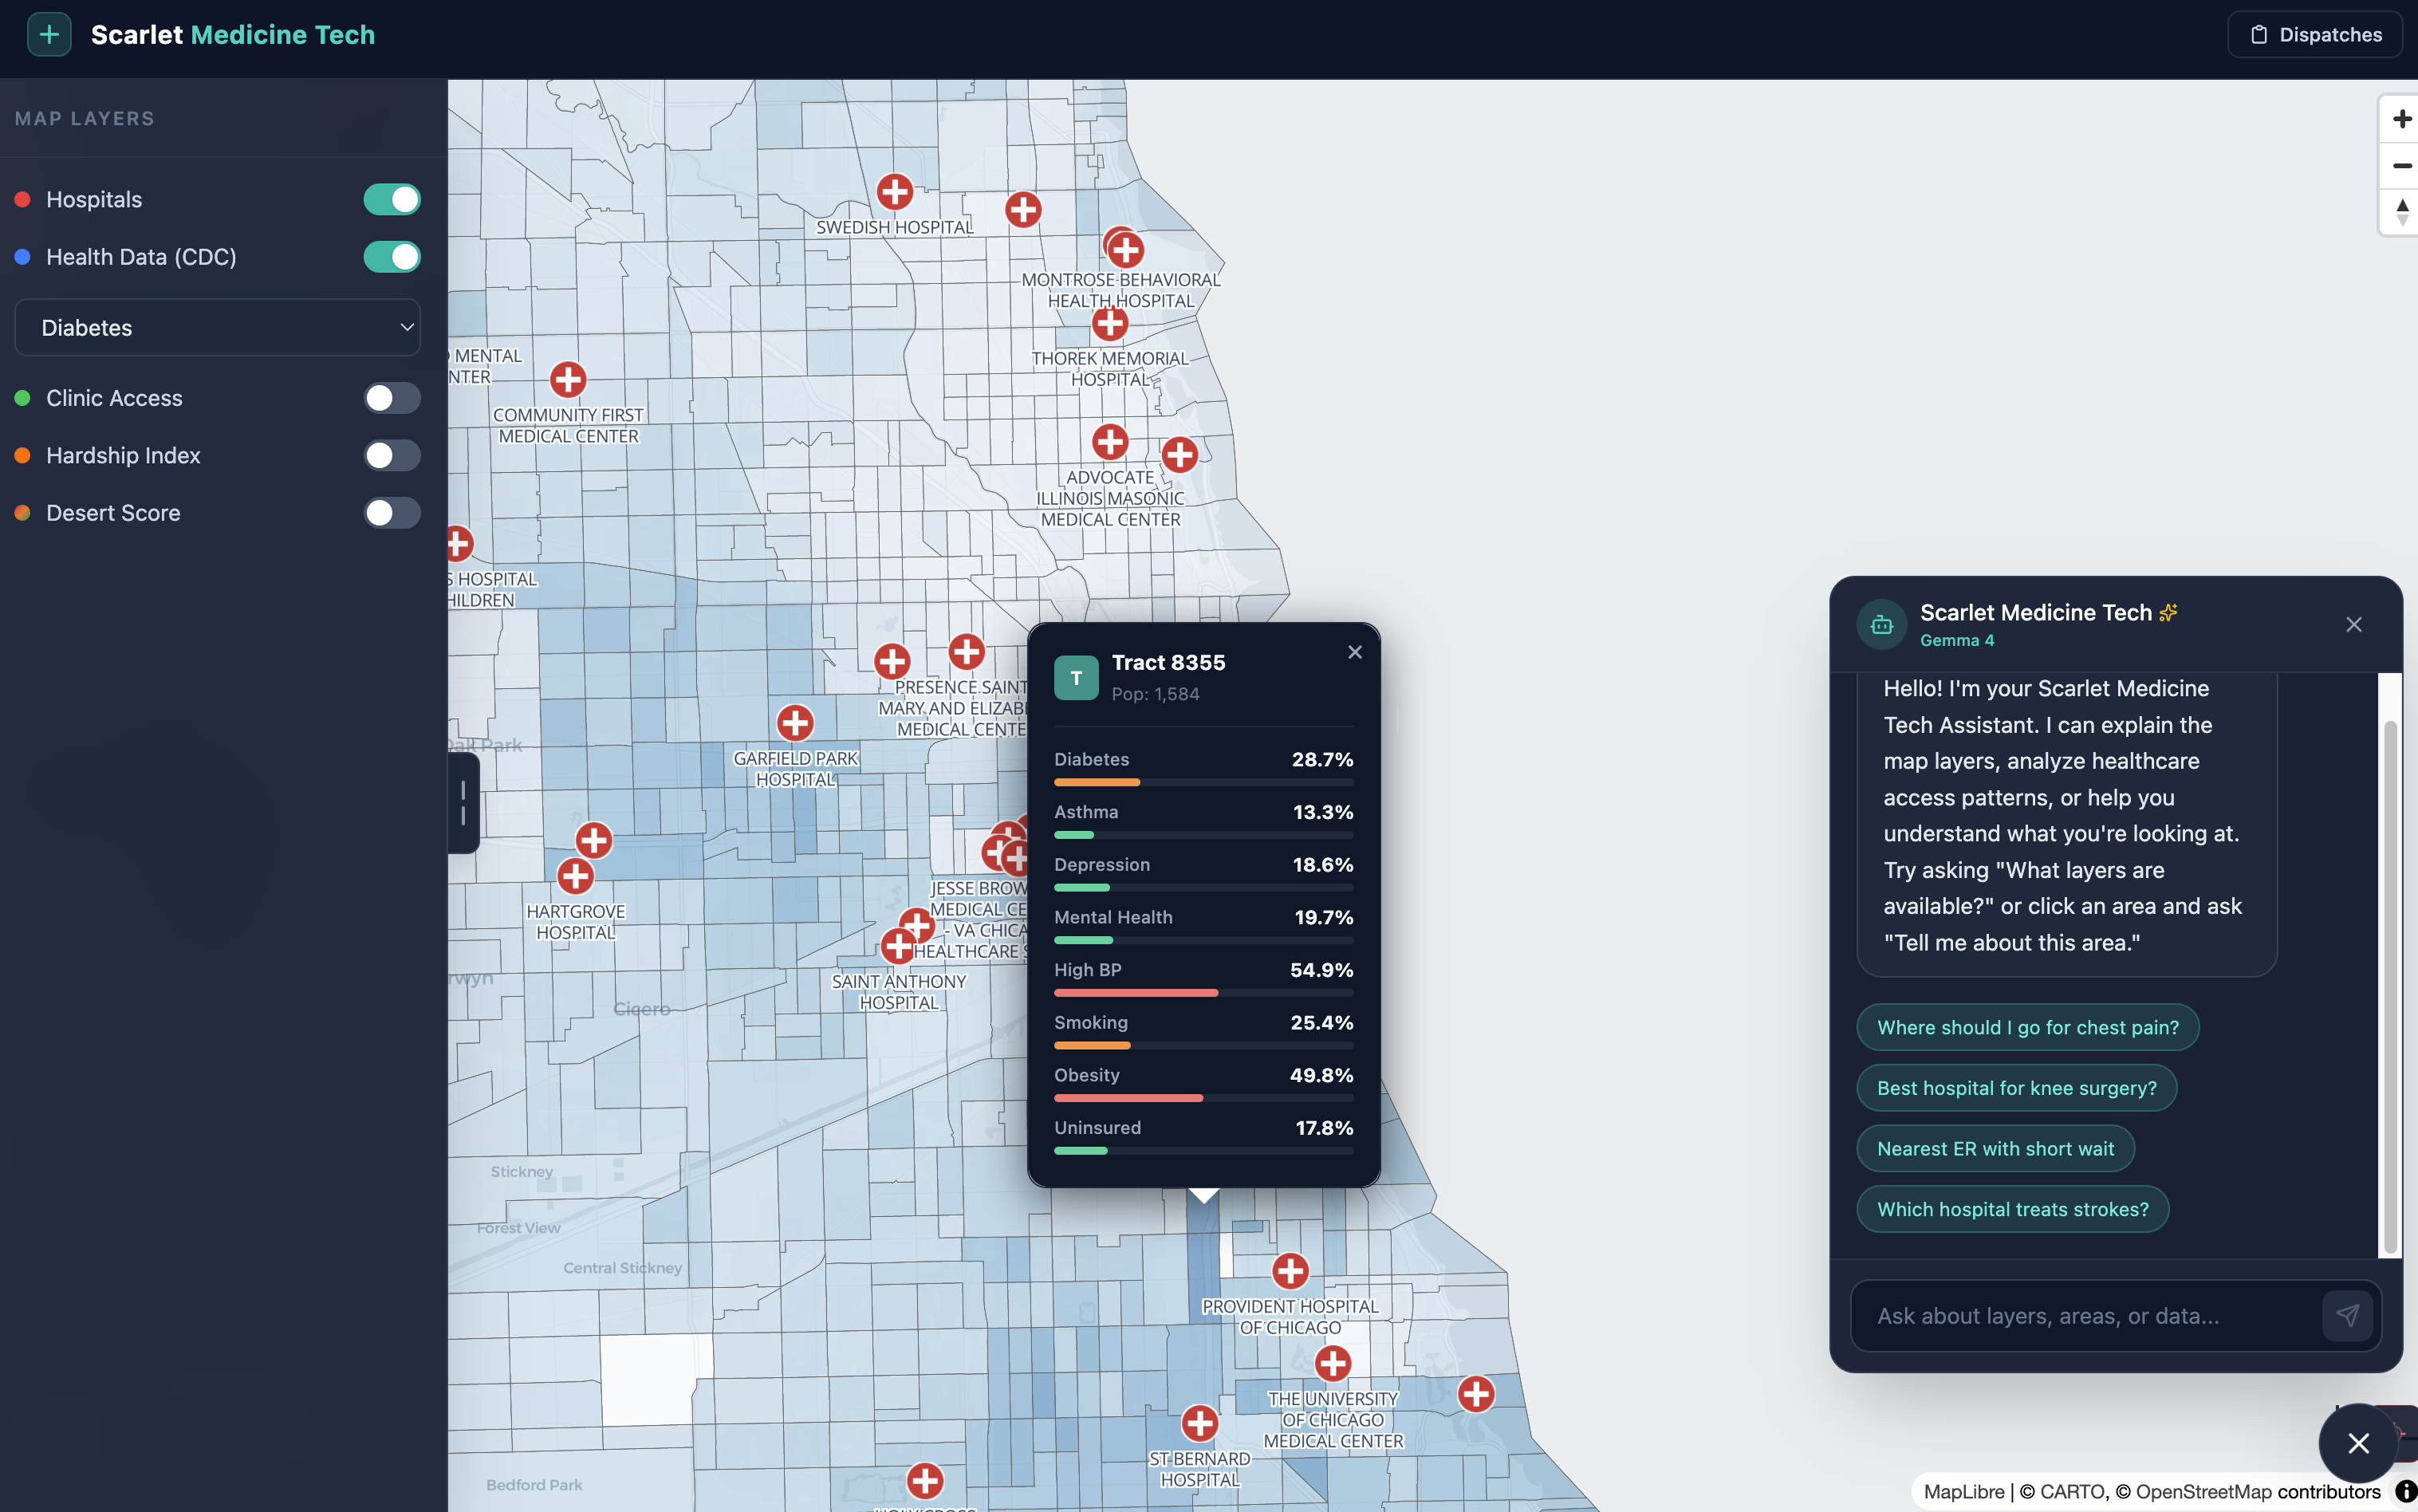
An AI-powered hospital recommender — a patient or dispatcher describes a condition and location, and the system ranks nearby hospitals using real CMS outcomes data (mortality rates, readmission rates, ER wait times, and overall star ratings), not just proximity. Psychiatric and behavioral health facilities are routed separately.
For HIPAA compliance with your local Gemma 4 setup, bind Ollama to localhost only (OLLAMA_HOST=127.0.0.1), that will help with HIPPA
How We Built It
A full-stack geospatial app with the following stack:
Frontend: Vue 3 + MapLibre GL for the interactive map, Pinia for state, Tailwind CSS for styling, Vite for builds
Backend: FastAPI Python with SQLAlchemy ORM and Alembic for database migrations
Database: PostgreSQL 16 + PostGIS for geospatial queries; Martin as the vector tile server
Infrastructure: Docker Compose with 6 services —
postgres,backend,frontend(Nginx),frontend-dev(Node dev server),martin(tile server), and an optionaltunnel(Cloudflare) for a live test linkAI Layer: Ollama + Gemma 4 for fully local inference; the app detects at runtime whether Ollama is reachable and falls back to Google AI Studio Gemma-4-27b if not
Data Pipeline: Five public datasets ingested at startup via seeder scripts — CDC PLACES, CMS Hospital General Information, CMS Complications & Deaths, CMS Timely & Effective Care, and the Chicago Economic Hardship Index
Tooling: Built using agentic coding tools Claude Code and Gemini CLI google Antigravity
Algorithms
Algorithm 1 — Healthcare Desert Score
A composite percentile-ranking algorithm run entirely in SQL. Each of Chicago's community areas is scored on how "deserted" it is for healthcare access. Higher score = worse access.
Inputs & Weights
Step 1 — Disease Burden (40%)
avg_burden = (diabetes% + asthma% + depression% + uninsured%) / 4
CDC PLACES tract-level data is spatially joinedto community areas. The average of 4 health indicators is computed per area, then converted it to a 0–100 percentile. A score of 90 means the area has higher disease burden than 90% of Chicago.
Step 2 — Clinic Gap (40%)
Fewer clinics per 10,000 residents = higher gap percentile. Clinic supply is derived from FQHCs and mental health clinic locations on the Chicago Data Portal, counted within each community area via spatial join and normalized by ACS population estimates.
Step 3 — Hardship Index (20%)
Chicago's published Economic Hardship Index a composite of per-capita income, poverty rate, unemployment rate (age 16+), and proportion without a high school diploma — is percentile-ranked per community area.
Final Formula
desert_score = (disease_burden_pctile × 0.4)

+ (clinic_gap_pctile × 0.4)

+ (hardship_pctile × 0.2)
The result (0–100) is stored in a PostgreSQL materialized view with a GiST spatial index so the map queries it instantly without recomputing on every request.
Algorithm 2 — Hospital Recommendation Engine
A weighted composite scoring algorithm that ranks hospitals for a given patient condition + location. Runs in Python after a spatial pre-filter in PostGIS.
Step 1 — Spatial Pre-filter
Only hospitals within 25 miles are considered. If an ER is needed, only hospitals with emergency_services = True pass through.
Step 2 — Score Each Hospital on 5 Dimensions
Dimension Breakdown
Capability (30%)
Does this hospital treat the condition? Case volume (CMS denominator) maps to a score between 50–100.
Assign 0 if no outcomes data exists for that condition.Quality (25%)
Based on CMS "Compared to National Rate" labels:- Better = 100
- Same = 60
- Worse = 20
Final score is averaged across all relevant outcome measures.
- Better = 100
Distance (20%)
Linear decay function:
(1 - miles / 20) × 100
Score reaches 0 at 20 miles.CMS Rating (15%)
Based on CMS overall hospital rating (1–5 stars):
(cms_rating / 5) × 100ER Wait Time (10%)
Based on emergency department wait time:
(1 - wait_minutes / 300) × 100
Defaults to 50 if no data is available.
Data sourced from CMS measure ED1b (arrival-to-departure time).
Composite Score
score = 0.30 × capability

+ 0.25 × quality

+ 0.20 × distance

+ 0.15 × cms_rating

+ 0.10 × er_wait
If ER is not needed, the 10% ER weight is redistributed: +5% to distance, +5% to CMS rating.
Step 3 — Sort Modes
Sorting Modes
| Mode | Behavior |
|---|---|
| Default | Sort by composite score |
preference='closest' |
Sort by distance only |
preference='best' |
Re-weight: 40% capability + 45% quality + 15% rating (ignores distance entirely) |
Psychiatric Hospitals — Separate Path
No CMS condition-outcome data exists for psychiatric facilities, so they use a simpler variant: 0.80 × distance_score + 20 bonus if ER available, then sorted by distance or ER availability.
Official Datasets Used
Datasets and Sources
| Dataset | Source | Used For |
|---|---|---|
| CDC PLACES: Local Data for Better Health (2025) | CDC / data.cdc.gov cwsq-ngmh |
Disease burden (diabetes, asthma, depression, uninsured) by census tract |
| TIGER/Line Census Tract Boundaries (2024) | US Census Bureau | Spatial geometries for census tracts |
| Chicago Community Areas | Chicago Data Portal igwz-8jzy |
Community area boundaries for spatial aggregation |
| ACS 5-Year Estimates — Community Area Population | Chicago Data Portal t68z-cikk |
Population denominators for clinics-per-10k calculation |
| Chicago FQHCs & Primary Care Clinics | Chicago Data Portal cjg8-dbka |
Clinic supply layer |
| Chicago Mental Health Clinics | Chicago Data Portal g7ng-5vwp |
Clinic supply layer |
| Chicago Economic Hardship Index | Chicago Data Portal kn9c-c2s2 |
Socioeconomic hardship component |
| CMS Hospital General Information | CMS Provider Data Catalog xubh-q36u |
Hospital list, star ratings, ER flag |
| CMS Complications and Deaths | CMS Provider Data Catalog ynj2-r877 |
Condition-level mortality and readmission outcomes |
| CMS Timely and Effective Care | CMS Provider Data Catalog yv7e-xc69 |
ER wait times (measure ED1b) |
Challenges We Ran Into
Ollama + Gemma 4 integration was entirely new learning the API format, handling Docker networking
host.docker.internalbridging the container to the host Ollama process, and prompt-engineering the model to stay grounded on healthcare topics without hallucinating hospital names or defaulting to generic medical disclaimersDocker Compose networking across 6 services — getting the Martin tile server, backend, and Ollama all talking to each other correctly, with the right ports exposed, took significant debugging; most issues were at the seams between services rather than inside any one service
Geospatial data processing — learning PostGIS spatial joins coordinate projection, and building materialized views with GiST indexes to make map queries fast enough for interactive use
Multi-source data normalization — CDC, CMS, and city datasets all use different identifiers, scales, and null conventions; converting everything to percentiles before combining was the key insight that made the desert score stable across wildly different data ranges
Git branching under hackathon pressure — feature branches per component prevented stepping on each other, but we still caused merge conflicts that had to be resolved carefully
Accomplishments We're Proud Of
Built a working end-to-end geospatial health equity tool under hackathon conditions — real CDC tract data, real CMS hospital outcomes, real Chicago community boundaries, all wired together through a live PostGIS pipeline
*A desert score *
not just a heatmap, but a three-factor algorythm that surfaces which neighborhoods are being failed and why (high disease burden vs. clinic shortage vs. economic hardship)
A local LLM running inside a Docker stack — Ollama + Gemma 4 running fully on-device with seamless fallback to cloud Gemma-4-27b, and a runtime detection system that picks the right backend automatically
Hospital recommendations grounded in clinical outcomes, not proximity — the recommender weights condition-specific mortality rates and CMS quality scores far above raw distance, which is exactly the point of the project
Caught and fixed a silent data bug — the v0007 clinic gap percentile was ordered in the wrong direction, silently rewarding underserved areas with low desert scores. We caught it, understood it, and fixed it cleanly with a v0008 migration
What We Learned
Ollama + Gemma 4 — how to configure a local model server, call its OpenAI-compatible endpoint from a containerized backend, and write system prompts that keep a general-purpose LLM focused and factual in a domain-specific context. First time using either; the hardest part was not the API but the prompting
Git branching strategy — feature branches per component (dispatcher, AI layer, map layers, data scripts) kept parallel work clean, but we learned to align early on shared config files and keep
Docker multi-service orchestration — service dependency ordering, volume mounts for seeding data on startup, and separating dev and prod frontend containers taught us a lot about how to structure a real multi-service deployment
Percentile ranking for composite scores — normalizing very different data sources (CDC prevalence percentages, CMS star ratings, city hardship integers) into a common 0–100 percentile scale before combining them was the design decision that made the desert score fair and interpretable
*PostGIS *
spatial joins and indexed distance queries that would have been nightmarish in application code are a few lines of SQL with the right extensions
What's Next
Make Ollama + Gemma 4 the default with smarter model management — auto-pull the model on first run, pin model versions, and expose a settings panel so users can swap models without touching config files
Real-time clinic data ingestion — replace the static clinic layer with a live feed from HRSA and city datasets so the desert score reflects closures and new openings as they happen
Alert system for emerging deserts — notify city planners and community organizations when a neighborhood's score crosses a threshold, triggered by clinic closures or population shifts
Patient-facing mobile interface — a lightweight view where someone can enter their condition and location and get a plain-language recommendation, not a ranked data table
Expand beyond Chicago — the entire pipeline (CDC PLACES + CMS + city hardship index) is generalizable to any U.S. city with community-area boundary data; the architecture is already designed for it
Integrate insurance acceptance data — a highly-rated hospital 3 miles away is useless if it does not accept your plan; folding in payer mix data would make the recommender meaningfully more equitable
Connect to dispatch and 311 systems — the ultimate goal is putting this data in front of the people who route patients in real time, not just researchers and planners
Built With
- alembic
- cdc-places
- chicago-data-portal
- cms
- docker&docker-compose
- fastapi
- gemma-4
- maplibre
- martin
- ollama
- open-street-map
- postgis
- postgresql
- sqlalchemy
- tailwind
- vite
- vue3

Log in or sign up for Devpost to join the conversation.