-
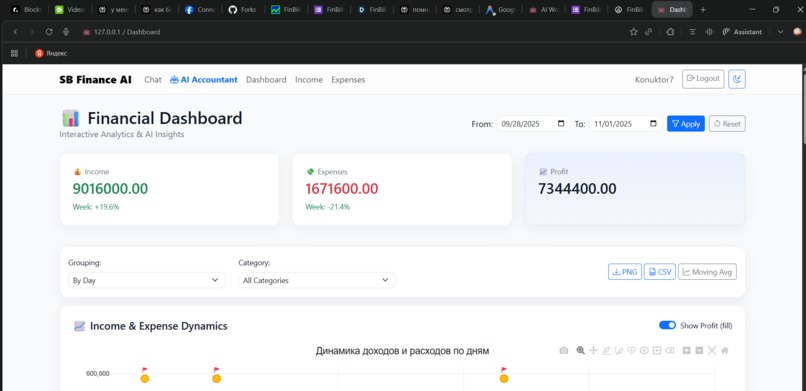
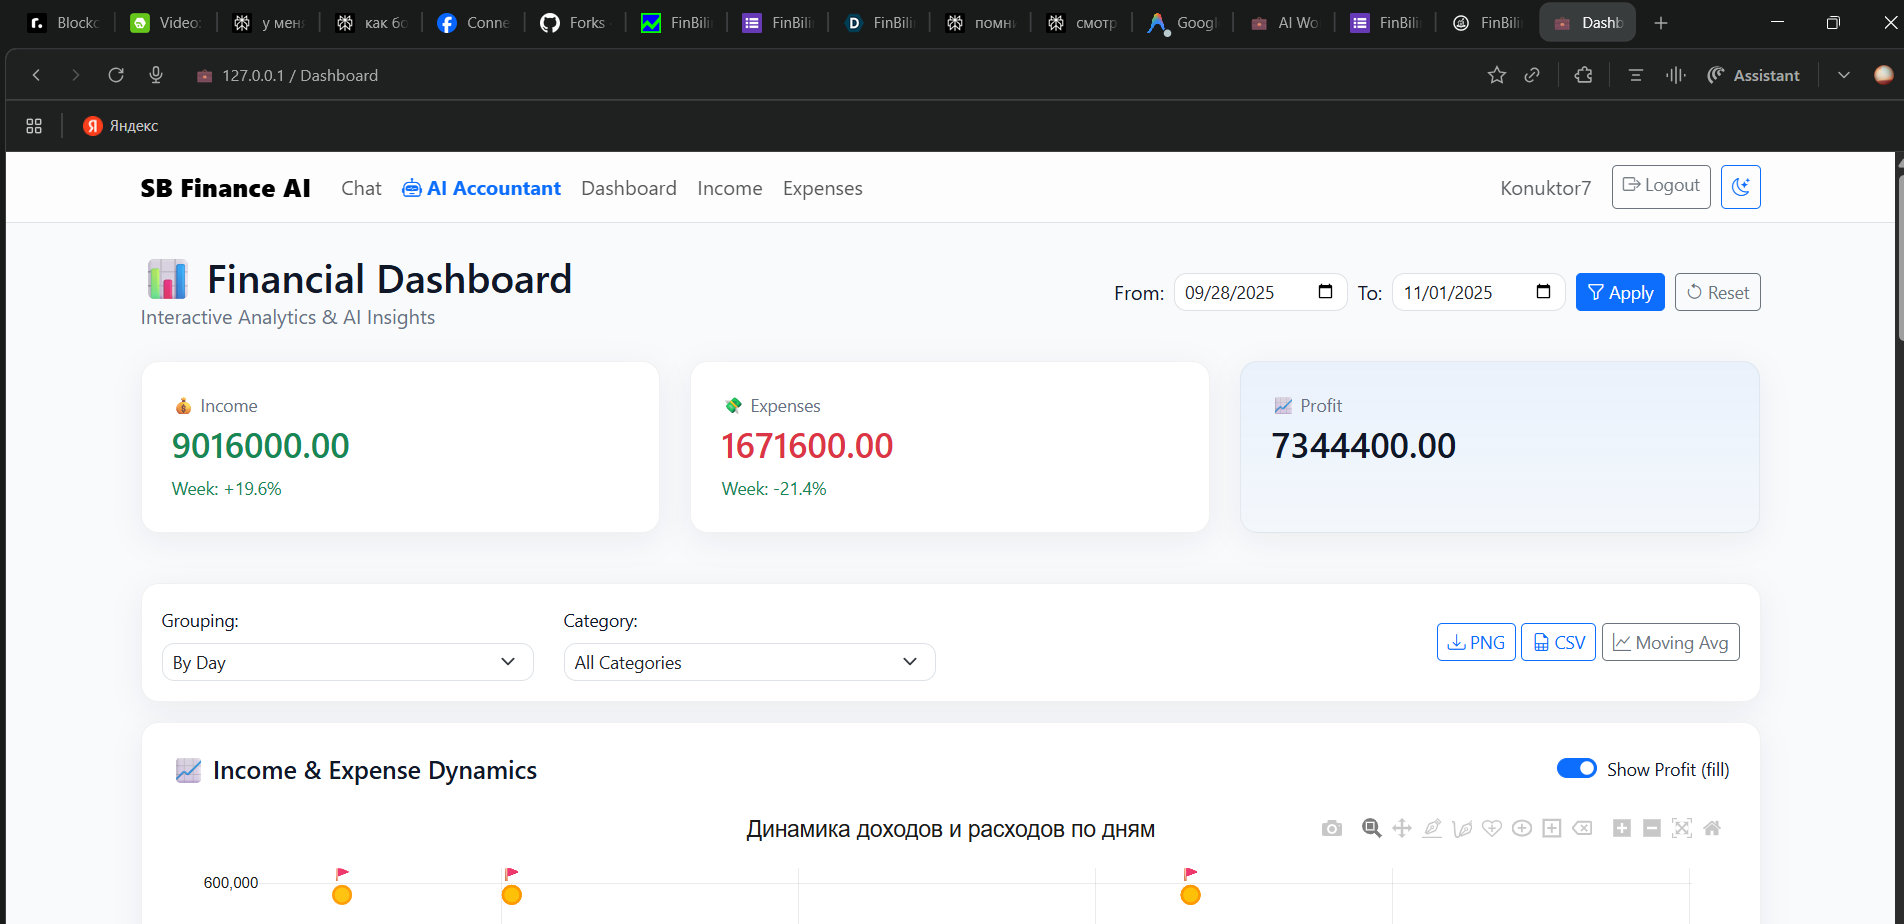
Your financial dashboard. See key income, expense & profit metrics at a glance with auto-generated trend charts.
-

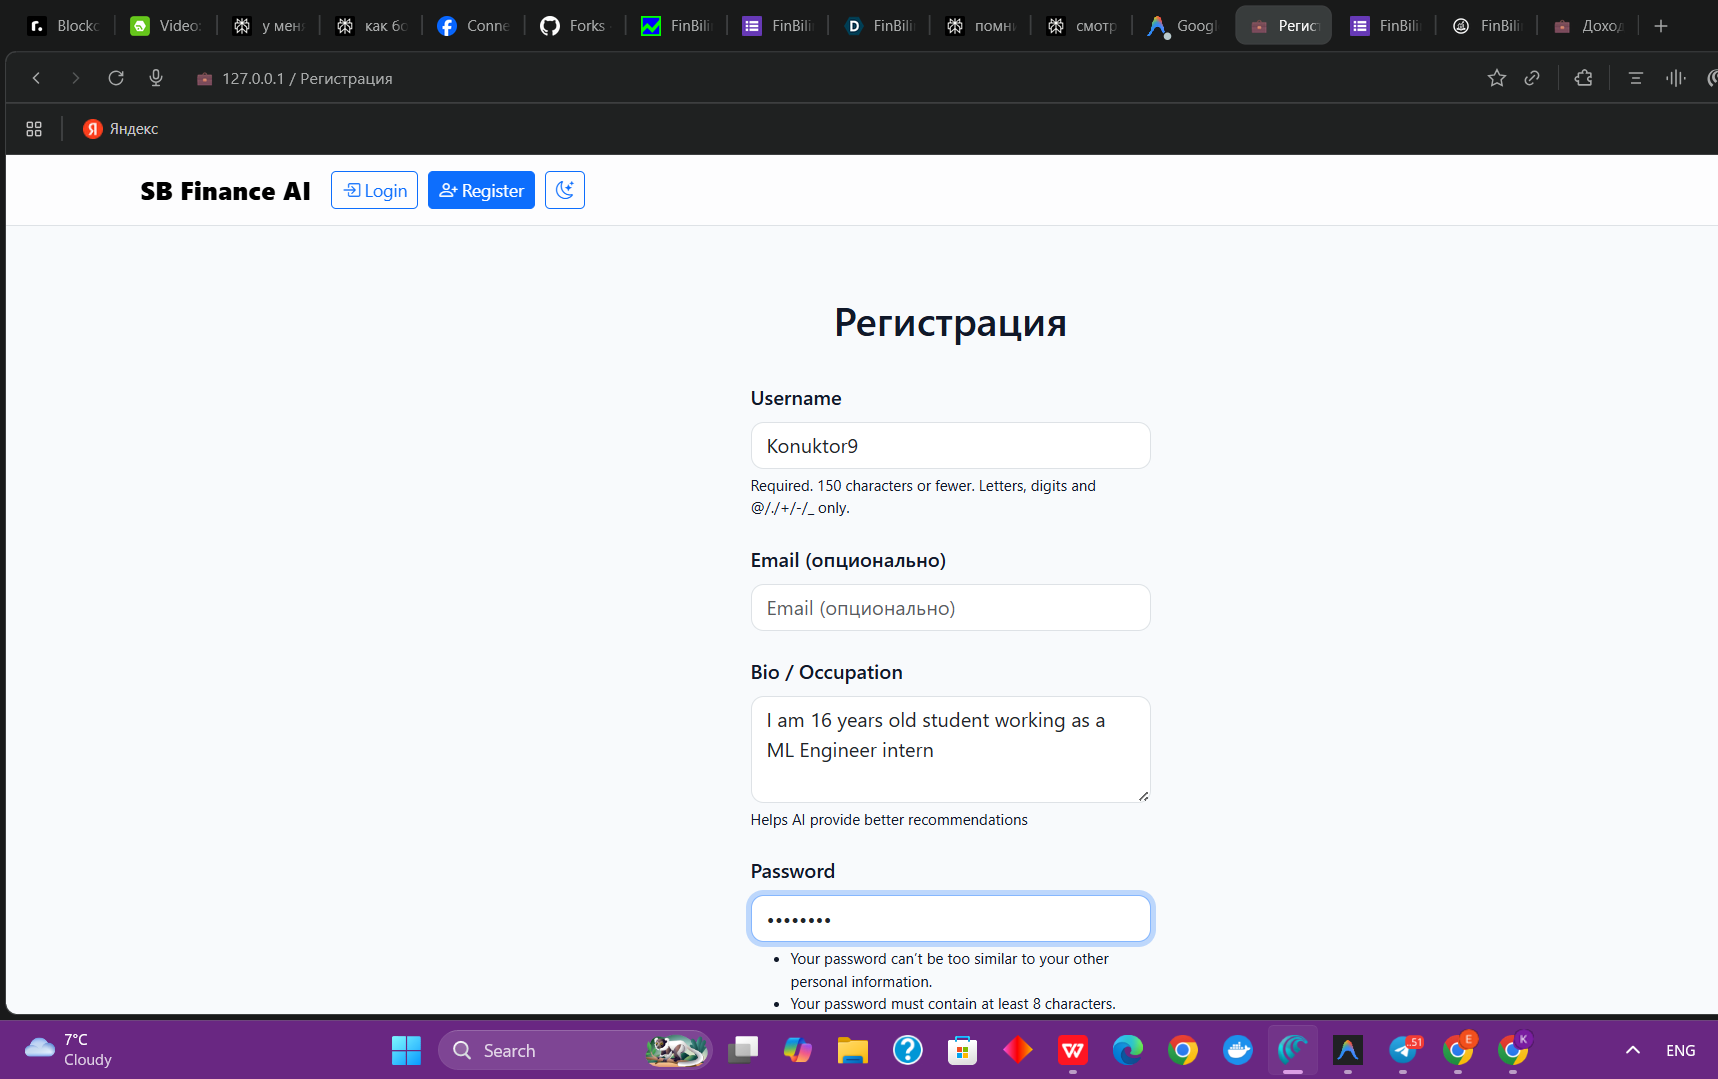
Personalized onboarding. Tell us about yourself so your AI can give tailored financial guidance from day one.
-
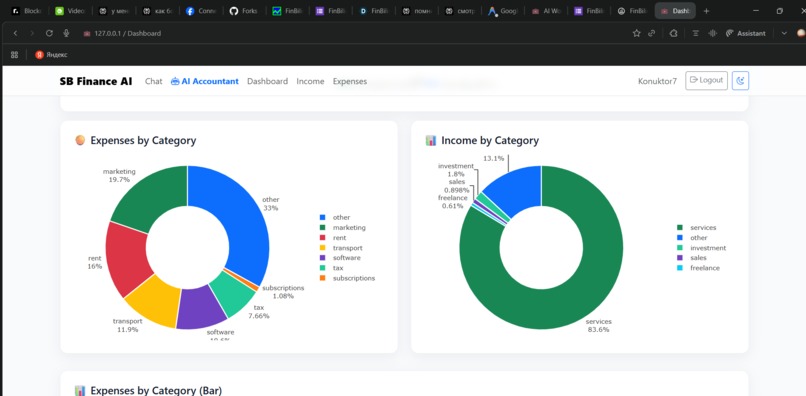
AI-powered category breakdown. Visualize where your money comes from and goes in clear, actionable pie charts.
-
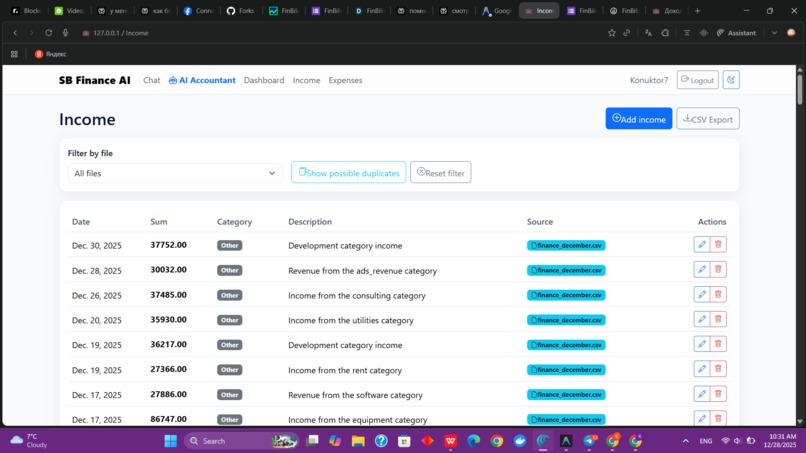
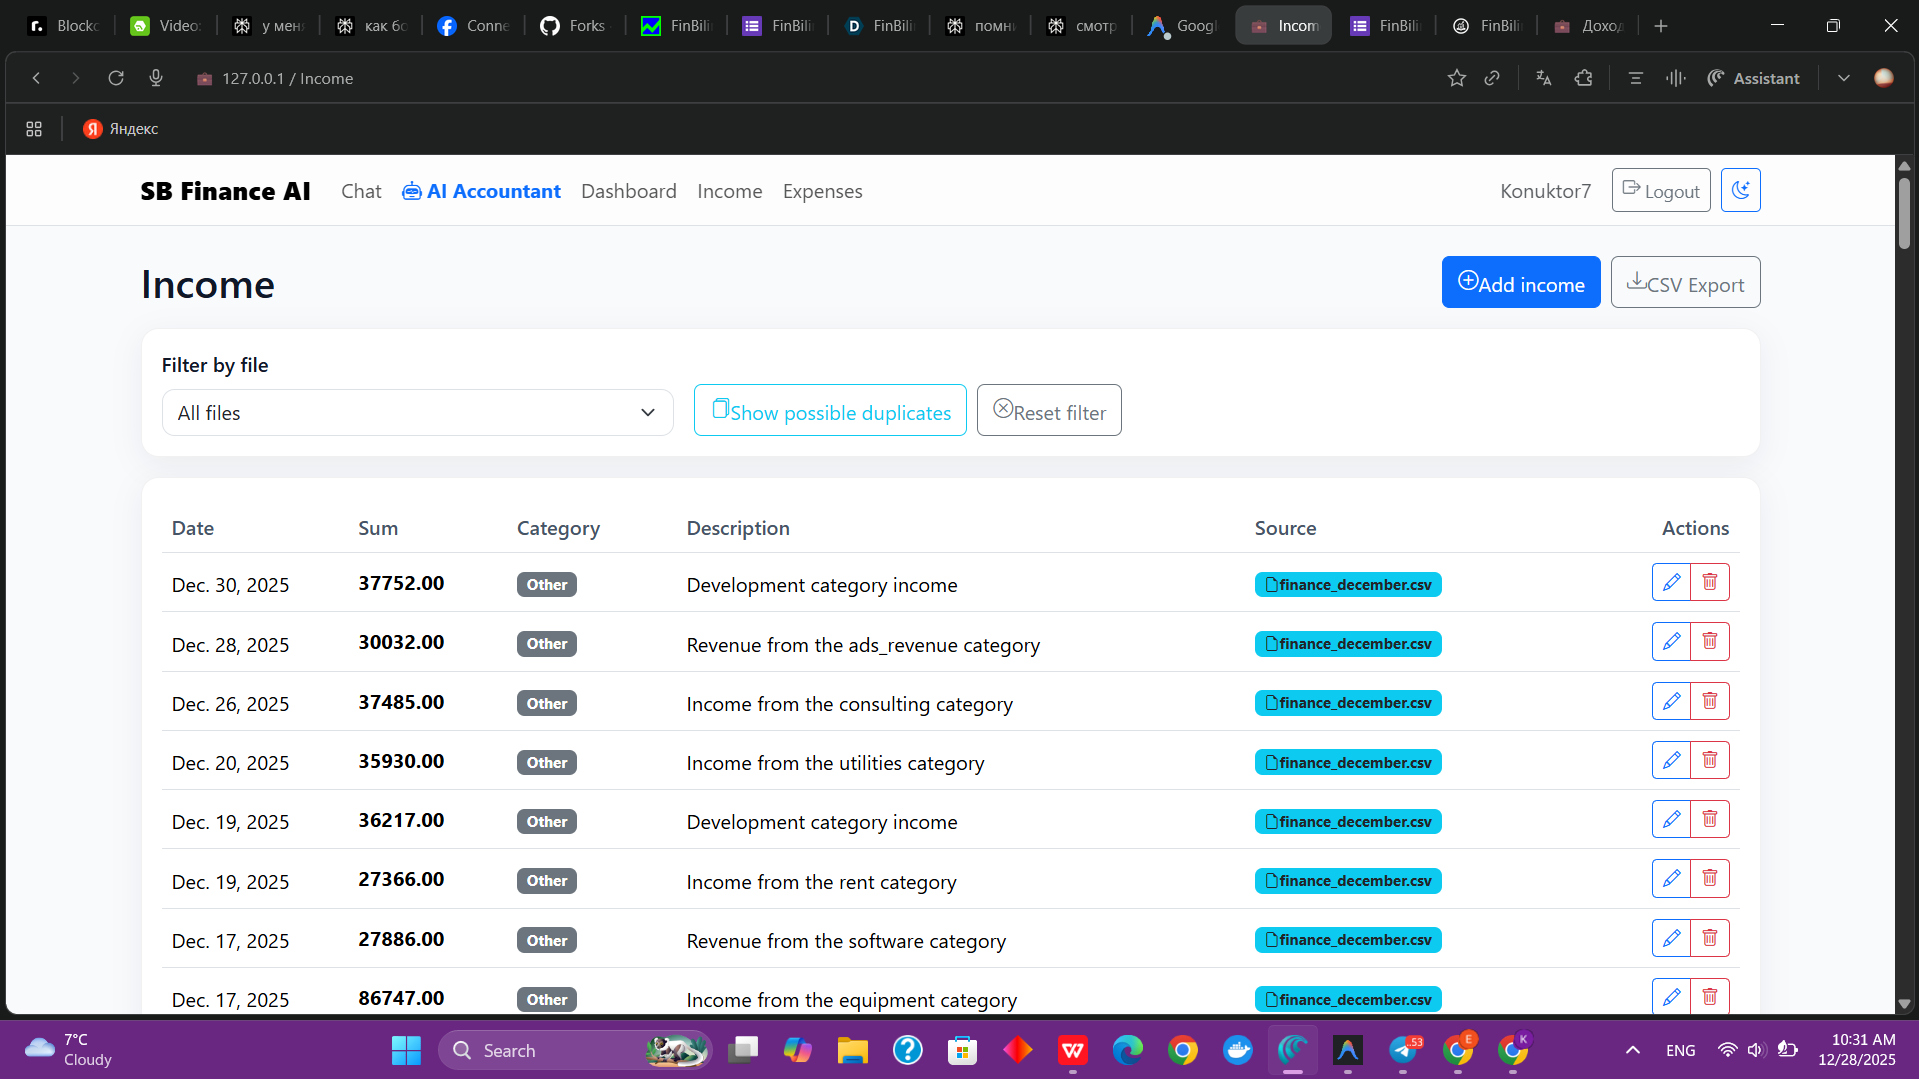
AI-powered income management with automatic imports, duplicate detection, categorization, and clear transaction history.
-
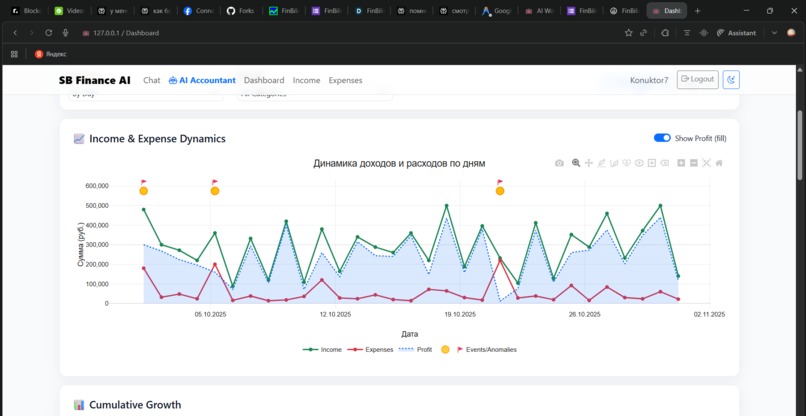
Interactive dashboard showing income, expenses, profit trends, and detected anomalies for smarter financial decisions.
-
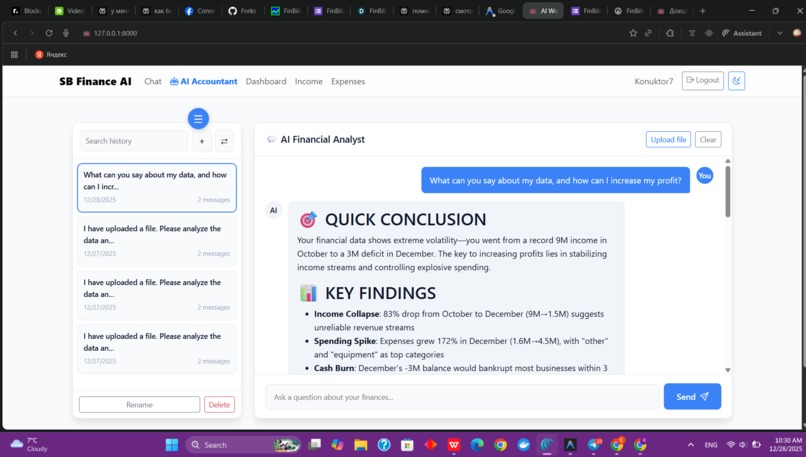
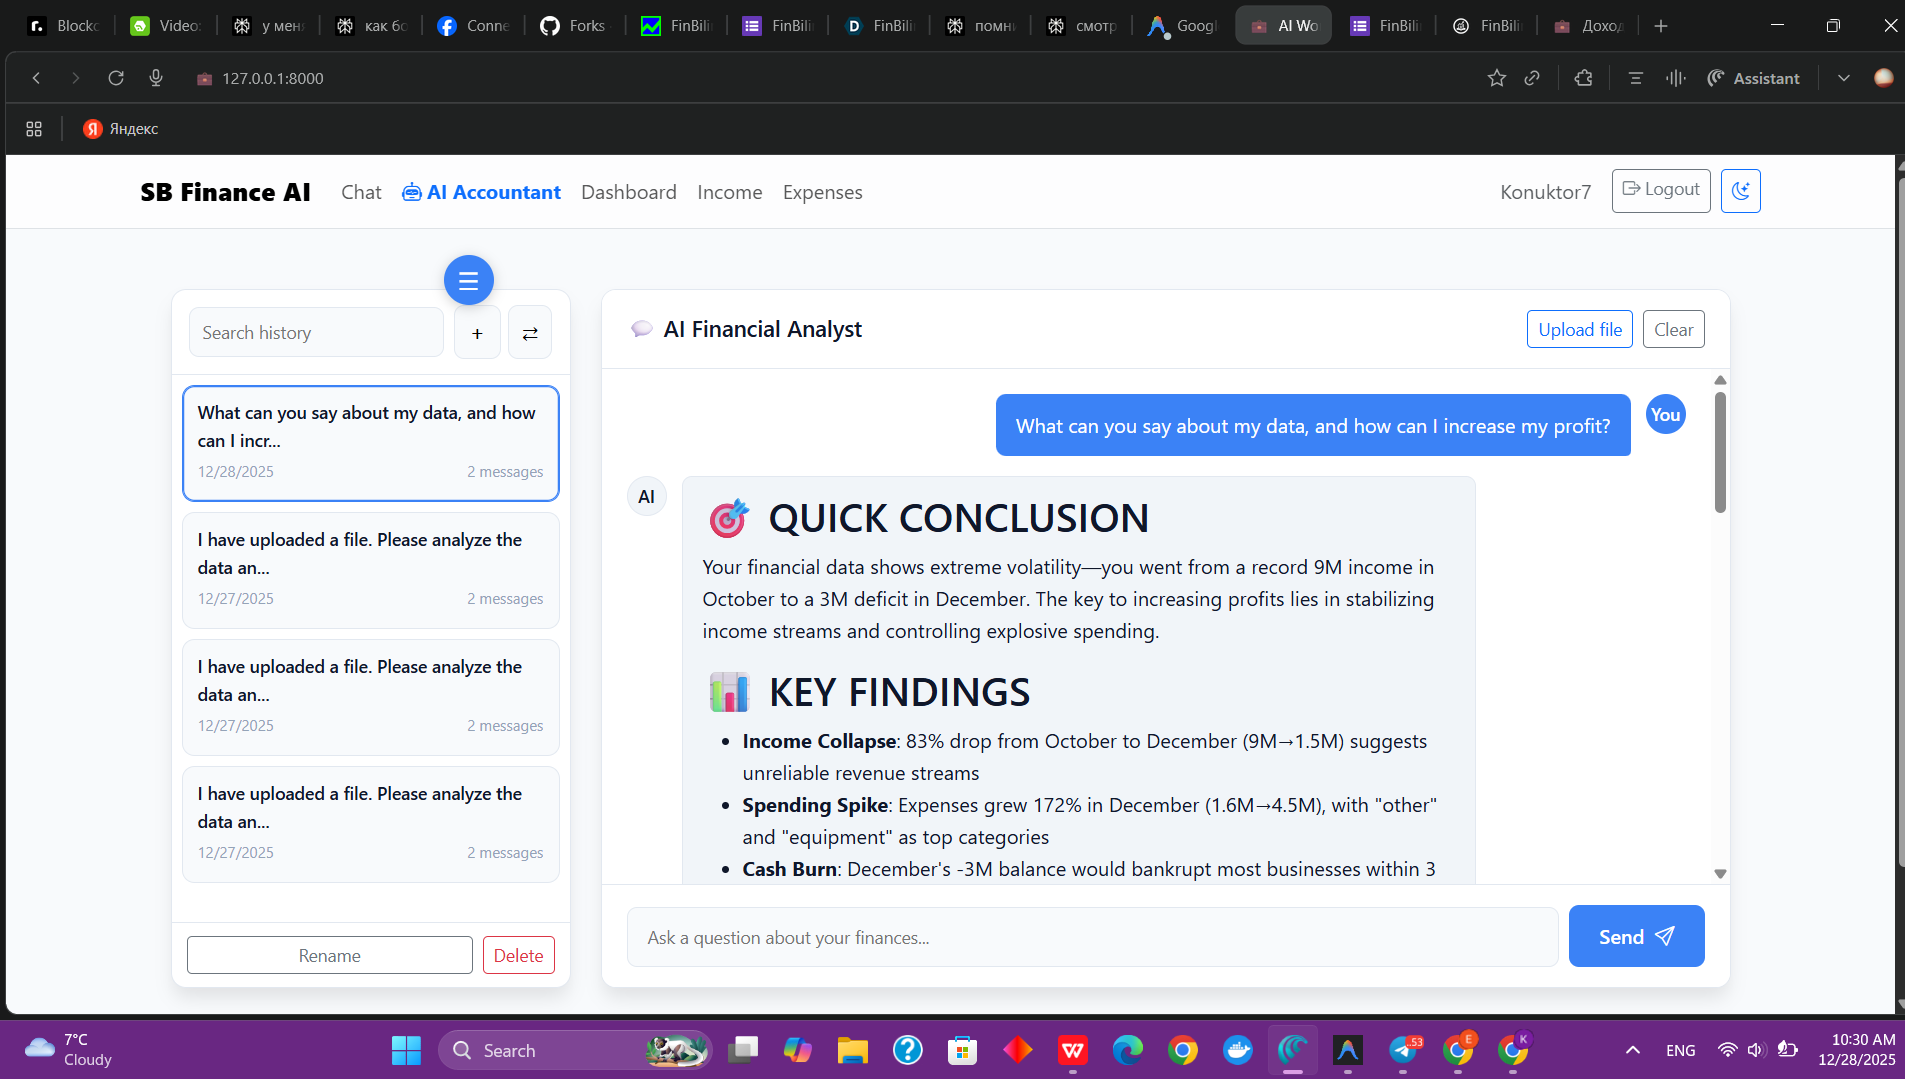
Chat with your AI Accountant. Get plain-language insights and actionable advice from your financial data.


Inspiration
When talking to small business owners and freelancers, almost everyone said the same thing: “I have tons of CSVs and exports, but no idea where my money really goes.”
People were wasting evenings in Excel, missing hidden fees and subscriptions, and still didn’t feel in control. That pain is what pushed this project to life.
What it does
You upload a statement or CSV, SB FINANCE AI parses everything, sorts transactions into categories and shows how money flows day by day. Then it highlights hidden expenses, strange spikes and risky trends, and gives simple, concrete suggestions on what to cut and how to save more.
How we built it
Under the hood it’s a Django app with separate pieces for import, parsing, categorization, analytics and the AI advisor. The AI layer uses an external model through API keys in env vars: it reads aggregated data and writes back human‑language insights that normal people can understand.
Challenges we ran into
Real‑world files are messy: different date formats, currencies, encodings, weird column names — getting a robust parser was way harder than a toy demo.
Tuning prompts so the AI stops giving generic “spend less, save more” and starts giving targeted, data‑backed advice took a lot of iteration.
Accomplishments that we're proud of
Now you can literally drop in one file and instantly see charts, insights and a story of your month instead of a wall of numbers. In early tests, most entrepreneurs discovered at least one “invisible” expense and several said they would pay for a tool that keeps watching their money like this.
What we learned
People don’t want another dashboard just for the sake of it — they want someone (or something) to explain “what does this mean and what should I do?”. Good UX and clear language are as important as models and math if you want non‑finance people to actually use a finance product.
What's next for SB finance
Tie everything stronger to goals: not just“you spent too much”, а “you’re off track for your laptop / vacation / expansion goal, here’s how to fix it”. Add more automation: bank connections, live categorization and a single “Close my month” button that runs the full pipeline and gives a ready‑to‑share management report.

Log in or sign up for Devpost to join the conversation.