Sojs (Spatiotemporal Oceanographic Growth Simulator)
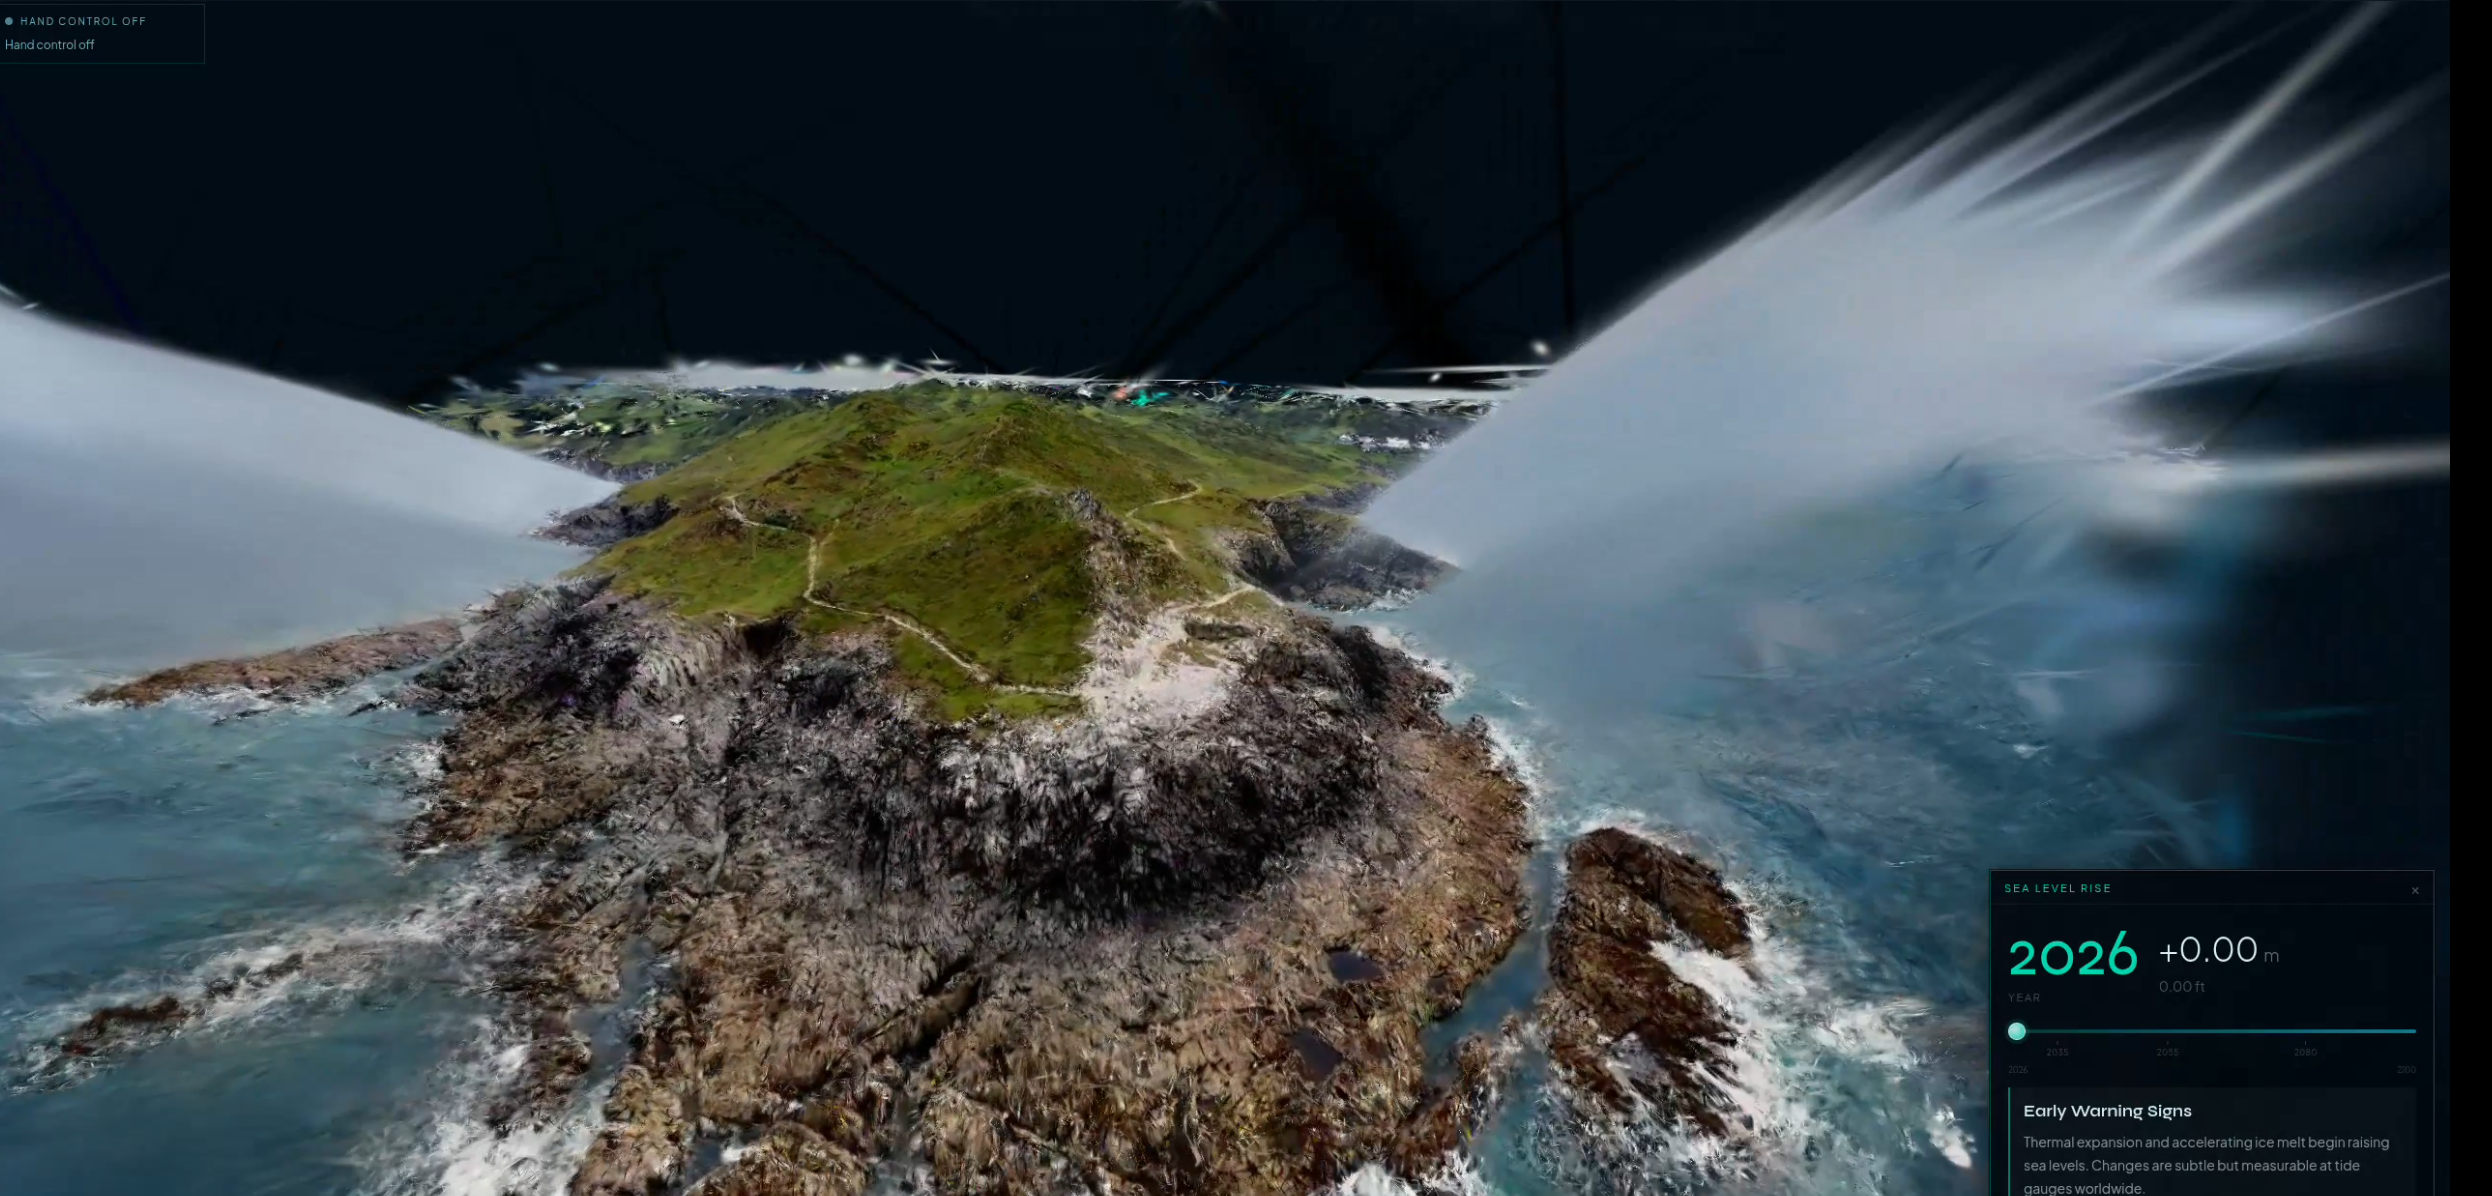
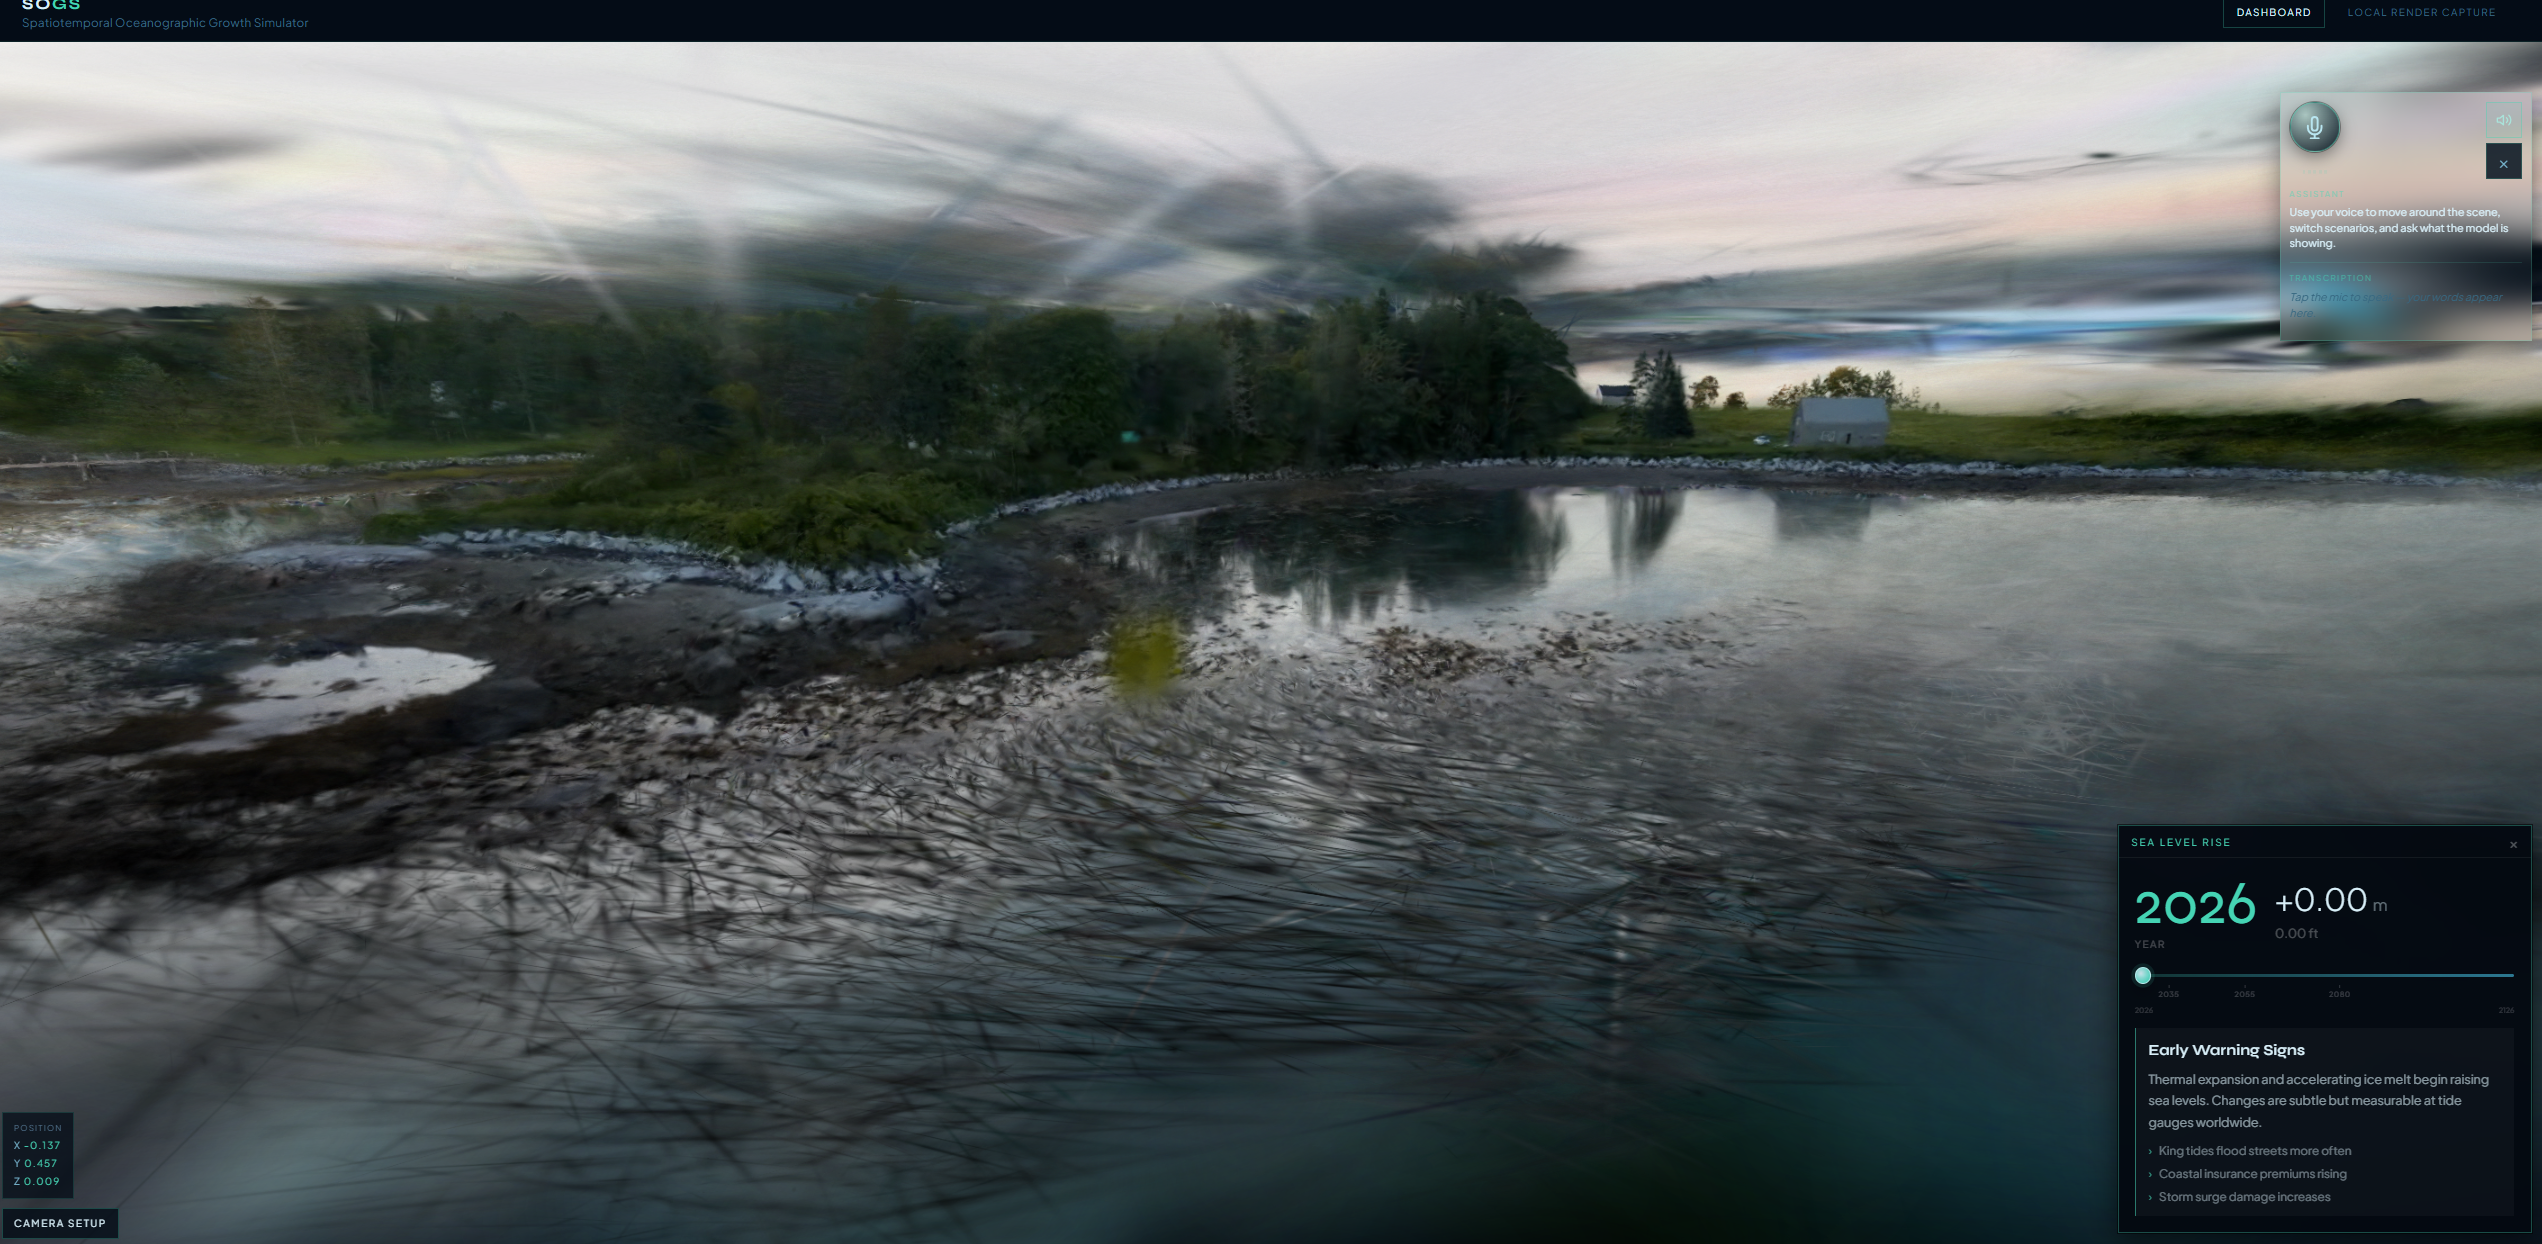
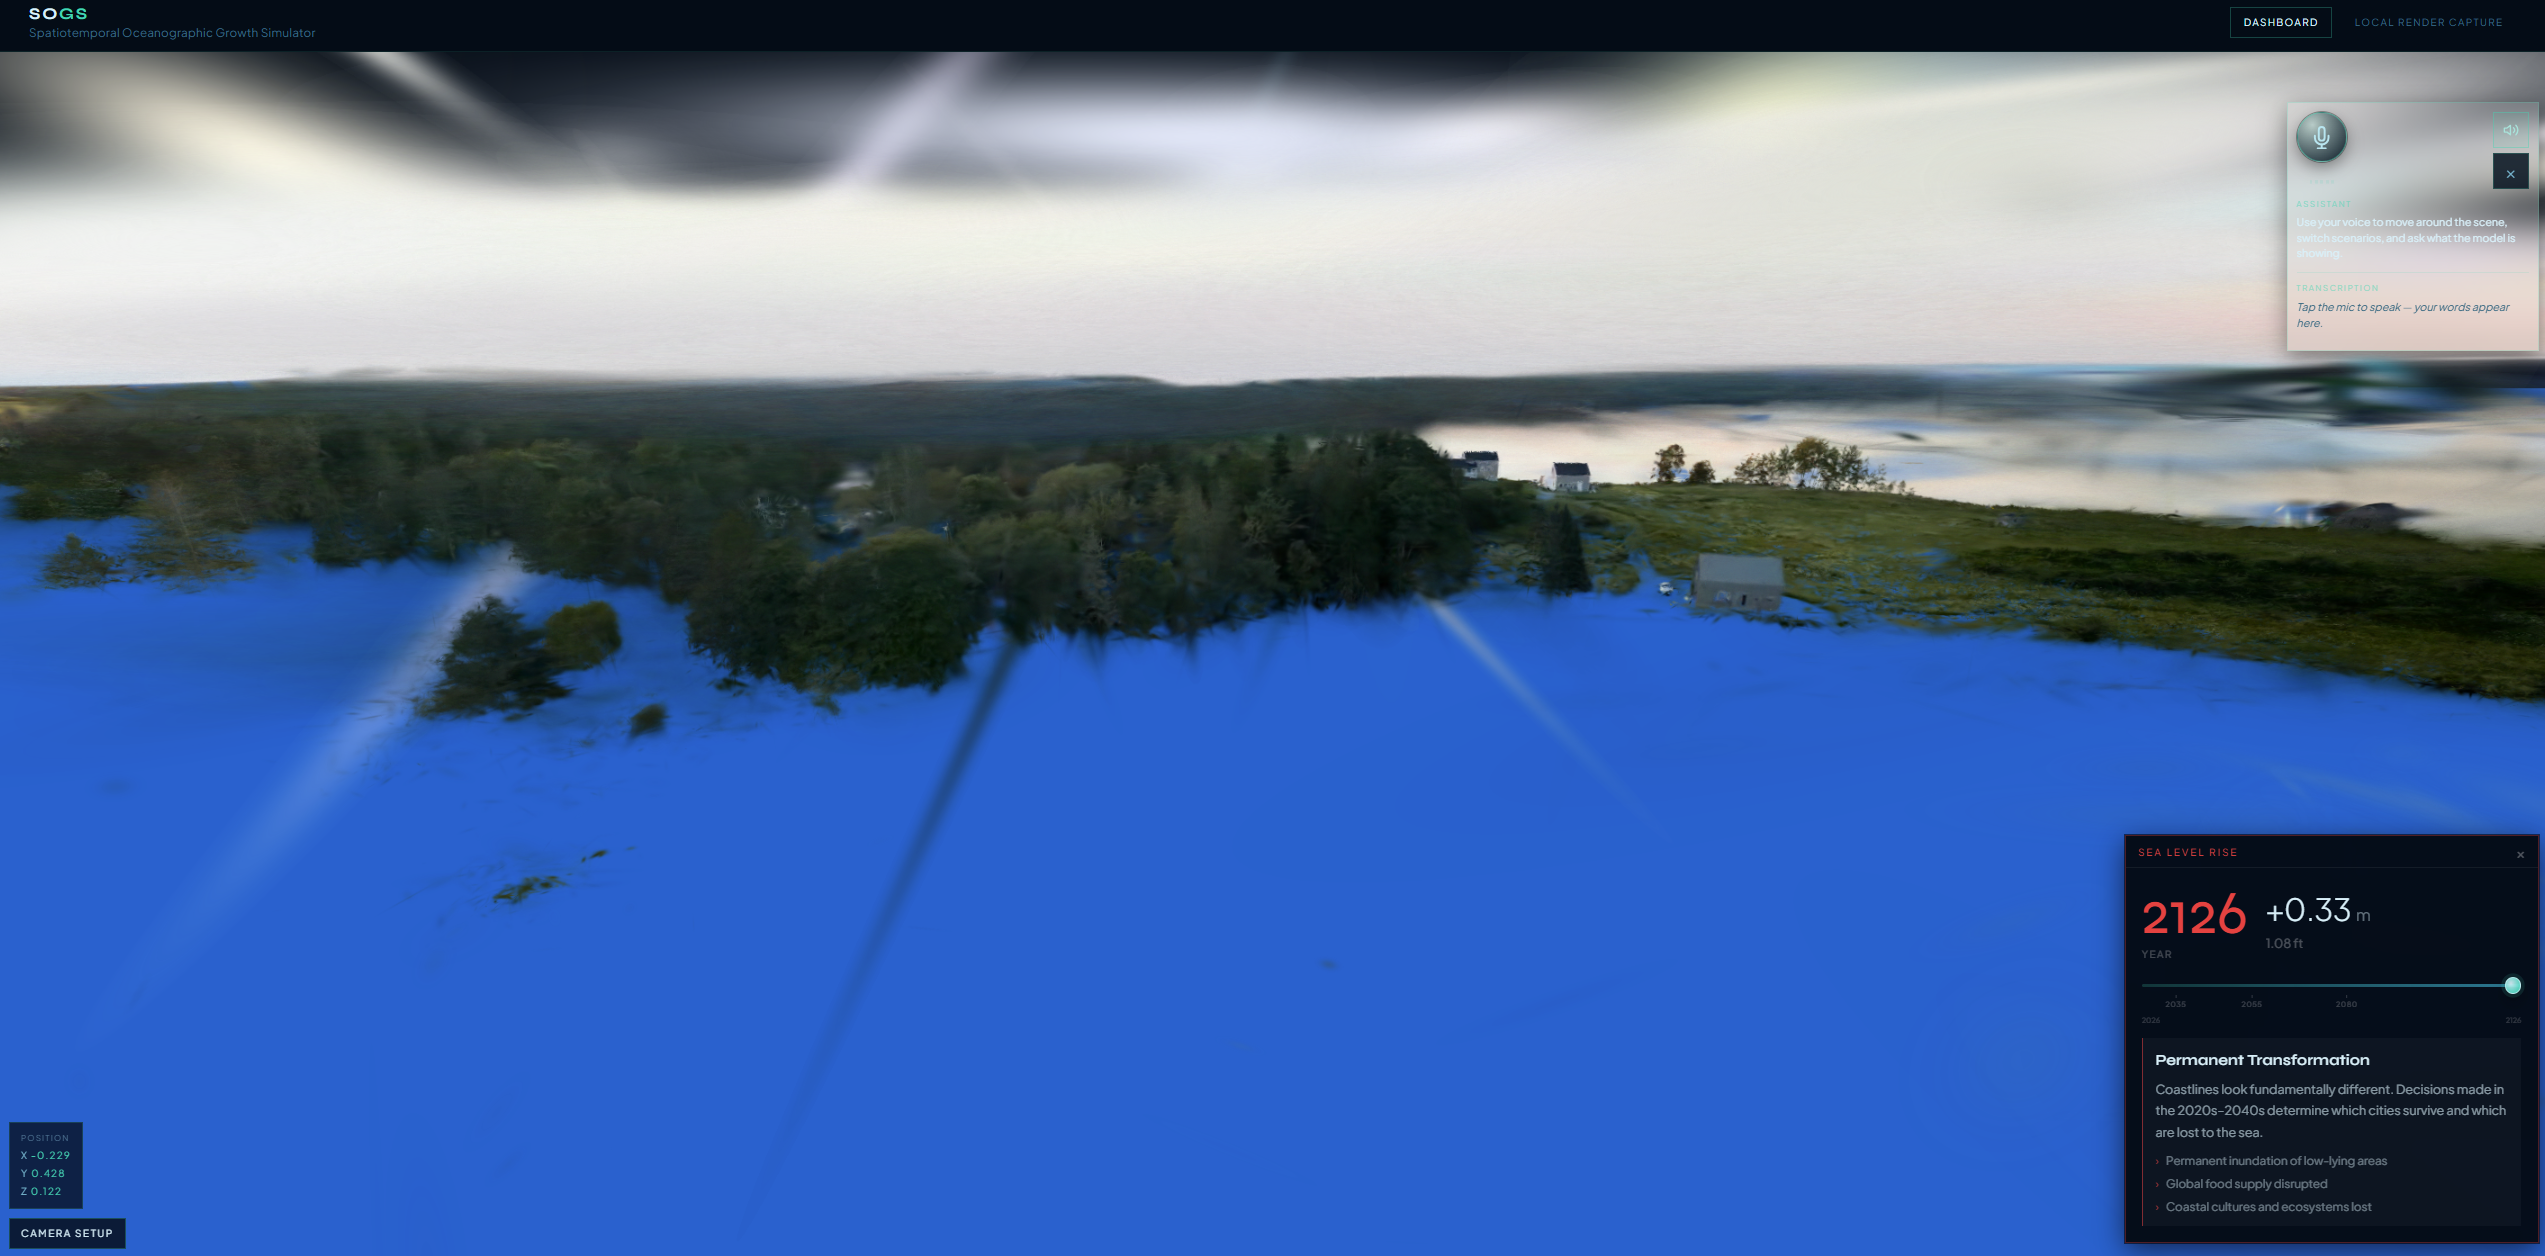
Sojs is a voice-guided, 3D sea-level rise explorer: you open a real place reconstructed as a point cloud / Gaussian splat, scrub time and scenarios, and talk to the scene—move the camera to named viewpoints, compare futures, and (where configured) run a hazard scan with plain-language narration. The goal is to make abstract climate numbers feel spatial and personal before the full prediction pipeline is wired in.
Intro
Sojs targets anyone who understands maps and photos better than spreadsheets. The experience centers on a navigable 3D capture of a shoreline or site, a timeline of sea-level scenarios, and a voice loop so you can ask “show 2050,” “compare now and 2100,” or “what floods first here” without hunting through UI. When hazard data exists, the app can surface geometric risk markers and optional LLM-assisted summaries so judges and stakeholders see both what the scan found and why it might matter.
Inspiration
Sea-level rise is often communicated as global averages or static maps. We wanted something closer to standing in place: a splat or PLY scene you can orbit, preset viewpoints that match how people describe a waterfront (“pier,” “ferry terminal”), and a single rise signal driving both stats and the visual water line. Voice lowers the barrier for demoing under time pressure and matches the “explain like I’m on the shore” story.
What it does
- Location dashboard — Cards for multiple saved scenes (e.g. Seattle Waterfront, Annaberg, Maine) with status, scenario labels, and deep links into the viewer.
- 3D viewport —
SplatViewerloads.plyassets in the browser with Three.js;.splatcan fall back to a local viewer path when needed. - Time & scenarios — Discrete baseline / mid-century / end-of-century (and related) steps with rise in meters, driving a CSS water overlay and on-screen metrics (not yet a full shader ocean).
- Voice loop — AssemblyAI streaming speech-to-text via a short-lived token from a Next.js route; intents are parsed client-side and drive camera moves, scenario switches, compare mode, flood-risk copy, and “what data is this based on.”
- Hotspots — Named camera poses and aliases so “waterfront” vs “pier” actually moves the view.
- Hazard scan — Where
hazardsUrlJSON is present, the client can place severity-ranked markers;/api/hazards/analyzeoptionally calls NVIDIA’s chat API (e.g. Gemma-class model) to turn structured markers into a short analysis, with deterministic fallbacks if keys or data are missing. - Honest scope — Rise values for the timeline are data-shaped but not yet plugged into a live climate model; the UI is built so swapping in API / SSE output is the natural next step.
How we built
| Layer | Choice |
|---|---|
| App | Next.js 16 (App Router), React 19, TypeScript |
| 3D | Three.js, PLYLoader, optional splat path |
| Styling | Tailwind v4 + custom CSS for shell, panels, water overlay |
| Speech in | AssemblyAI (streaming token from app/api/voice/assembly/token) |
| Speech / narration out | Browser playback via useVoicePlayback (voice UX in VoiceAssistantBar) |
| “Agent” behavior | Rule-based intents + response builders (scene-command-catalog, voice-responses) — not a free-form chatbot |
| Hazard analysis (optional) | NVIDIA chat completions + JSON extraction, with non-LLM fallback |
Challenges we ran into
- Many subsystems — 3D load failures, mic permissions, STT token expiry, and optional LLM routes each fail differently; clear fallback copy and UI states mattered as much as features.
- Demo vs. science — Connecting plausible scenario numbers to credible attribution without overclaiming; the codebase separates UI scaffolding from future model integration on purpose.
- Latency and clarity — Voice + 3D needs short, repeatable commands and visible feedback (
VoiceAssistantBar, transcript) so the demo feels reliable. - Hazard semantics — Markers are geometric proxies, not ground-truth damage; prompts and fallbacks stress that to avoid “magic certainty.”
Accomplishments we’re proud of
- A coherent end-to-end story: dashboard → location → 3D + timeline + voice, aligned with
PLAN.mdphases. - Voice that actually drives the scene — hotspots, scenarios, compare, and flood/source intents, not a disconnected chat panel.
- Optional AI hazard layer — Structured markers + optional NVIDIA-backed analysis, with offline-style behavior when keys aren’t set.
- Repo structure — Frontend documented in
frontend.md; long-term model + data plan stays inPLAN.md.
What we learned
- Transparency beats a black box — Showing scenario labels, sources, and “what the model is showing” builds trust faster than prettier water shaders alone.
- Intent-first voice beats open-ended LLM for a hackathon 3D demo — predictable commands reduce failure modes.
- Next.js route handlers are a clean place for short-lived STT tokens and server-side LLM calls without exposing keys to the client.
What’s next for Sojs
- Live prediction pipeline — Replace hardcoded timeline steps with
SeaLevelFrame-style API (year, rise, confidence, source) as sketched infrontend.md. - Richer water — Shader-based water or a Three.js surface instead of (or alongside) the CSS overlay.
- Reference layers — NOAA / Climate Central–style comparisons with explicit “reference vs. ours” labeling.
- Deeper voice — Barge-in, streaming TTS, and longer-term tool use if you add a full LLM router.
- Safety & labeling — Stronger disclaimers for hazard inference and non-emergency use of any future alerting.
Short tagline options (for DevPost title field)
- “Talk to the shoreline: voice-driven 3D sea-level scenarios.”
- “Sojs — sea-level rise you can walk through, not just read about.”
Built With
- assemblyai
- next.js-16
- next.js-route-handlers
- nvidia-chat-api-(nim)
- plyloader
- react-19
- tailwind-css-v4
- three.js
- typescript


Log in or sign up for Devpost to join the conversation.