-
-
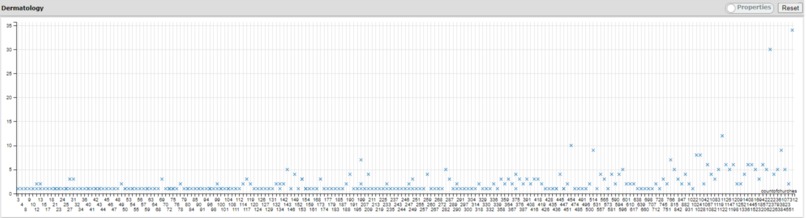
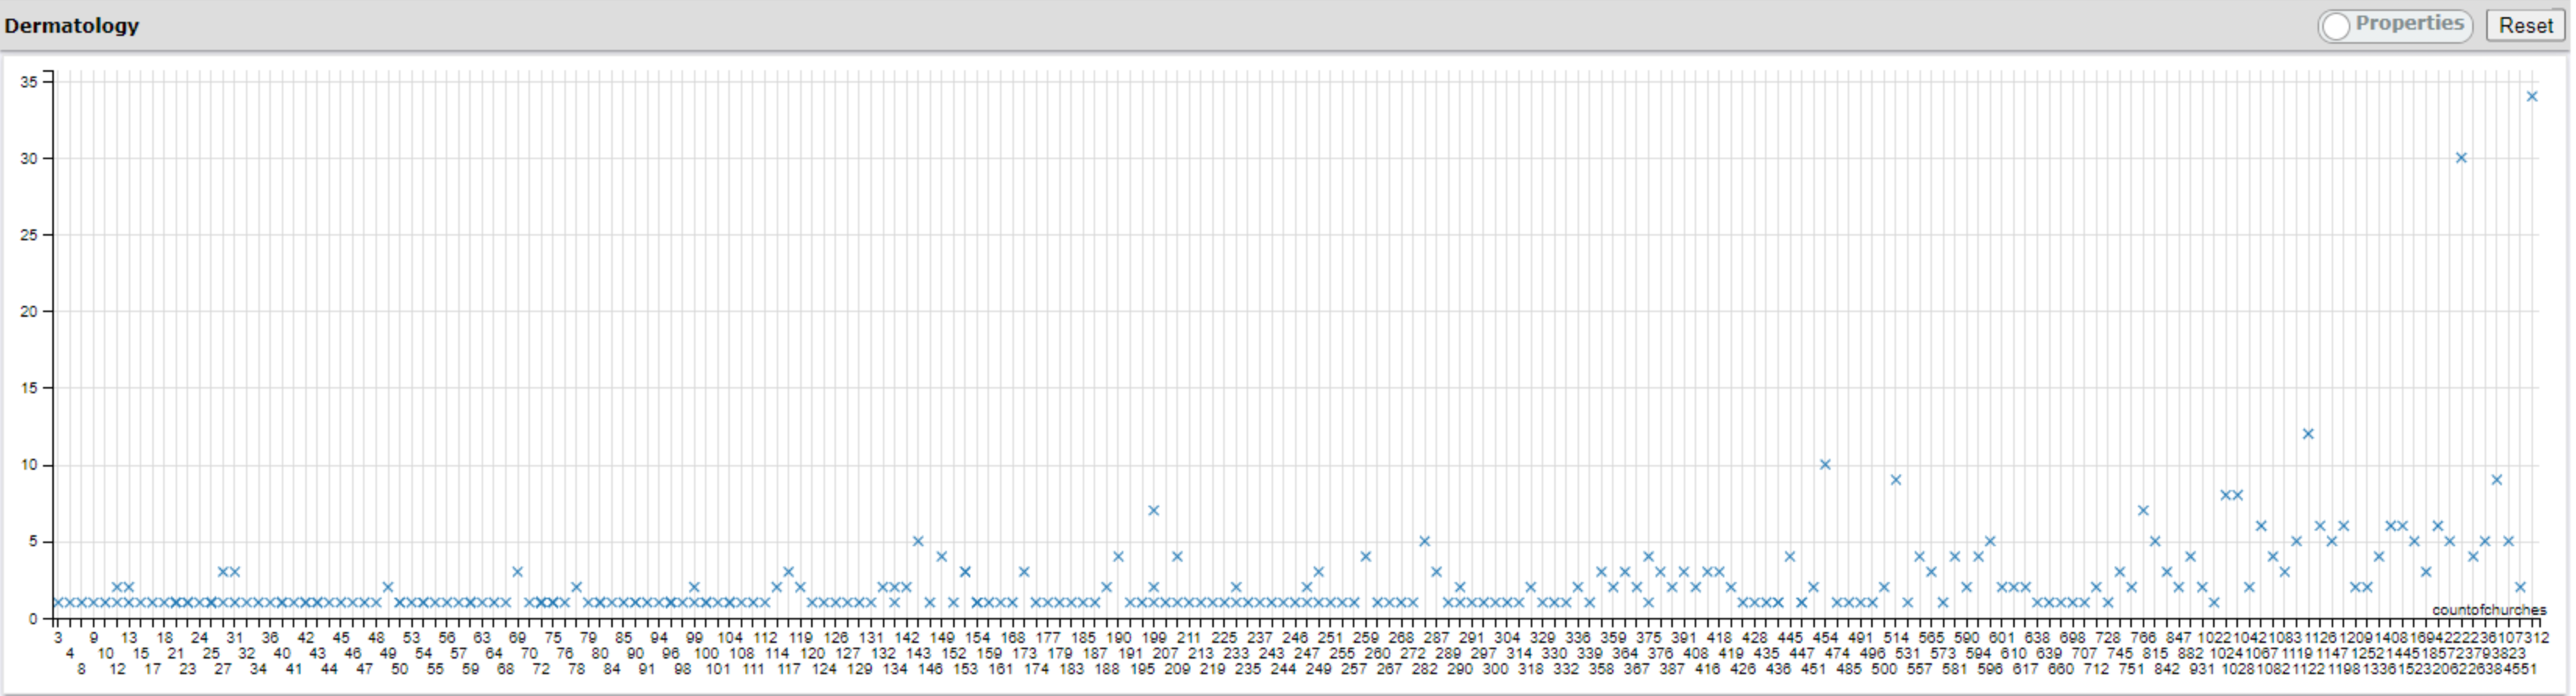
x-axis: number of churches in a county fip; y-axis: number of children missing in county fip
What it does
We tried to find a correlation between the number of churches in an area to the reported missing children in that area(by county fip number) and plotted these values for each county fip number onto a scatter plot. All of this is done by connecting to the HPCC's cluster and using ECL to query their database and using their visualization tools to plot the queried data.
How we built it
The scatter plot we ended up with used queried data from the NCMEC, city, and church datasets that were joined by city and state and cross tabbed by county fip.
Challenges we ran into
Nearly every step of the project was challenging due to our unfamiliarity with ECL.
Accomplishments that we're proud of
Being able to successfully use ECL to make a scatter plot to between the amount of churches in a county fib and the amount of reported missing children in a county fip
What we learned
We learned how to connect to HPCC's cluster to query datasets and use their visualization tool
What's next for Kids Can't Fly
We would like to add extra data (what religion each church has) into the cluster and make a geological heatmap with two layers
Built With
- ecl


Log in or sign up for Devpost to join the conversation.