Inspiration
Digital elevation models and image processing algorithms together with visual mapping tools are a natural fit when it comes to predicting and visualizing floods. However, a general risk map might be too general for a lot of scenarios. Especially different terrain and infrastructure types might influence whether it is possible to reach a safe area within time or not. That is why we tried to personalize our tool using location-dependent routing data (reachability of safe areas) and including the possibility to crowdsource knowledge. In addition, most existing apps focus on a specific area (e.g. weather information). This leads us to a more holistic approach including multiple information sources.
What it does
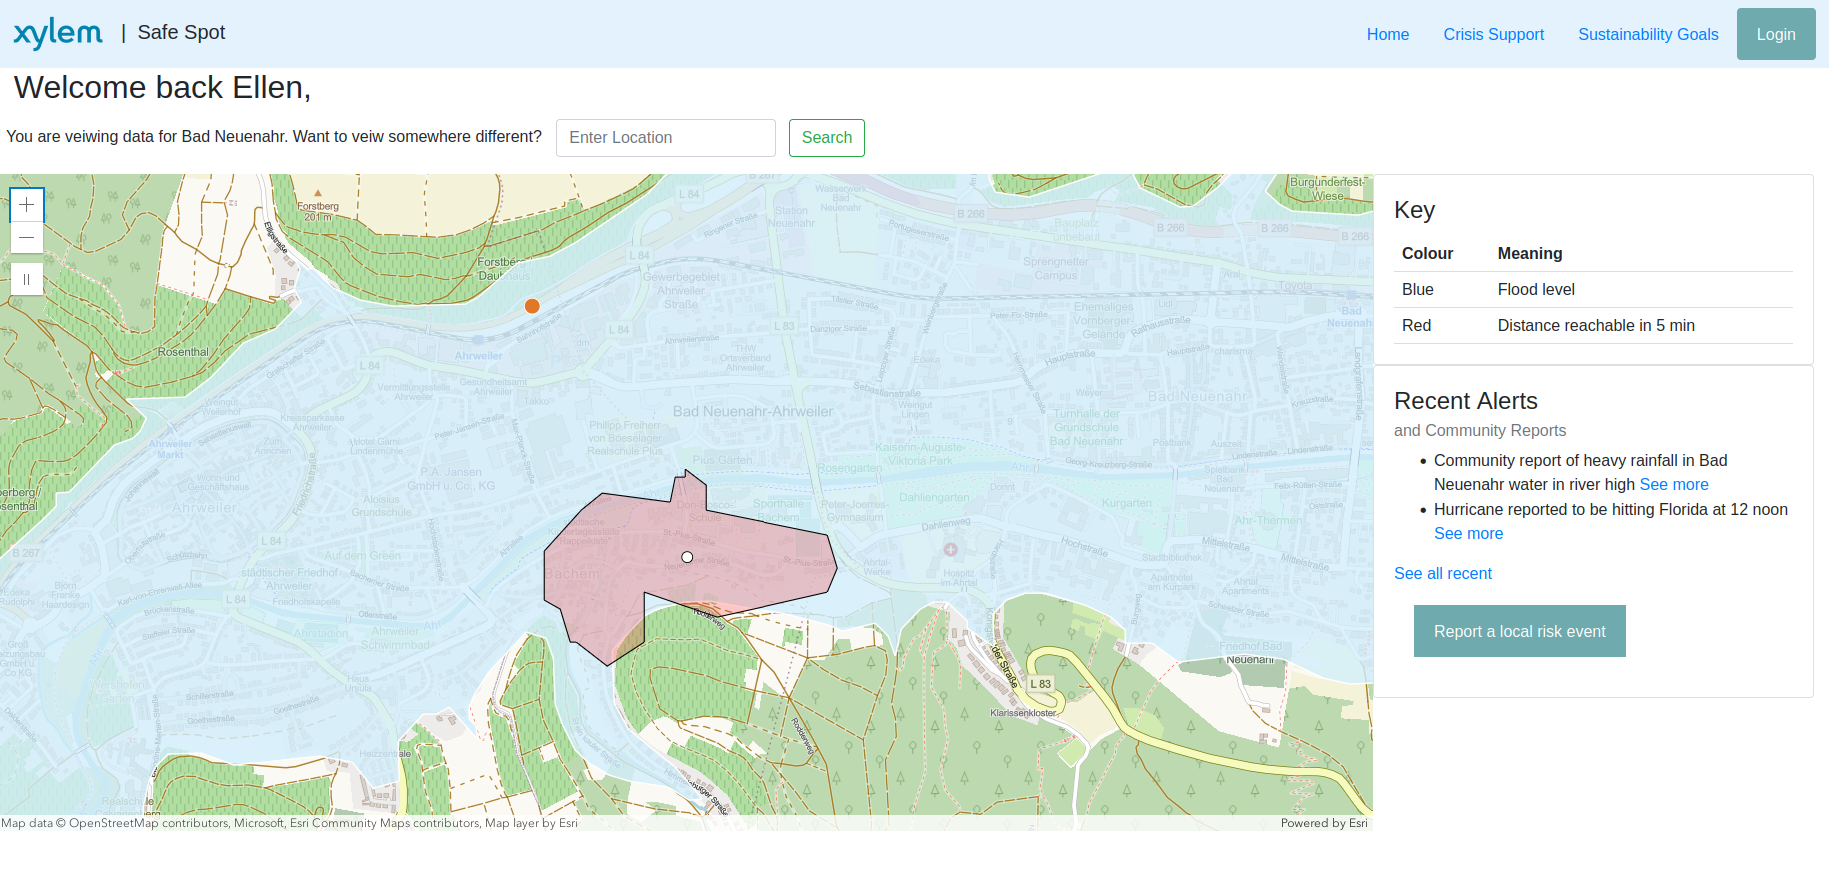
It uses the digital elevation model together with standard image processing algorithms to produce a real-time prediction for flooded areas. In addition, routing information together with the device location are used to analyze the surroundings and create a visualization of which areas are high enough to be save and can also be reached by foot within minutes. For this, the routing takes existing infrastructure into account. In addition, it offers the possibility to flag locations and share knowledge with others. Finally, it acts as a central source of information providing sections detailing what to do in different risk scenarios and how to prepare for those.
How we built it
Our simple front end uses plain html, css (bootstrap), and JavaScript together with the JavaScript APIs provided by ArcGIS to create map visualizations and provide routing information. The backend is written in Python using FastAPI to provide a simple REST-Interface for communication with the frontend. For the height map analysis and flooding prediction standard data science and image processing libraries in Python are used (numpy, skimage, openCV ...).
Challenges we ran into
- different backgrounds
- fully remote team
- did not know each other beforehand
- time pressure
- different spatial coordinate system
- requirement to convert raster into vector data for better visualization in ArcGIS
Accomplishments that we're proud of
- simple to use website
- working prototype
- combining a simple flood prediction model with isochrone polygons (points reachable within a certain time from current position) using navigation data provided by ArcGIS
What we learned
- working only remote is not always easy
- building prototypes using ArcGIS
- web development skills
What's next for Save Spot
- messaging system
- scale it up to larger areas
- build out community section (include filters etc.)
- sleep ;)
Built With
- esri
- javascript
- numpy
- opencv
- python
- rasterio

Log in or sign up for Devpost to join the conversation.