Inspiration
What drove you to build this?
– Our love of pizza and the challenge of optimizing operations for a fast‑growing local chain.
– The need to reduce food waste and labor cost by better forecasting demand.
What it does
Summarize the core features in 2–3 bullets:
- Demand Forecasting: Predicts weekly and monthly pizza sales using historical data and seasonal trends.
- External Data Integration: Pulls in local event calendars and consumer‑spending indices to improve accuracy.
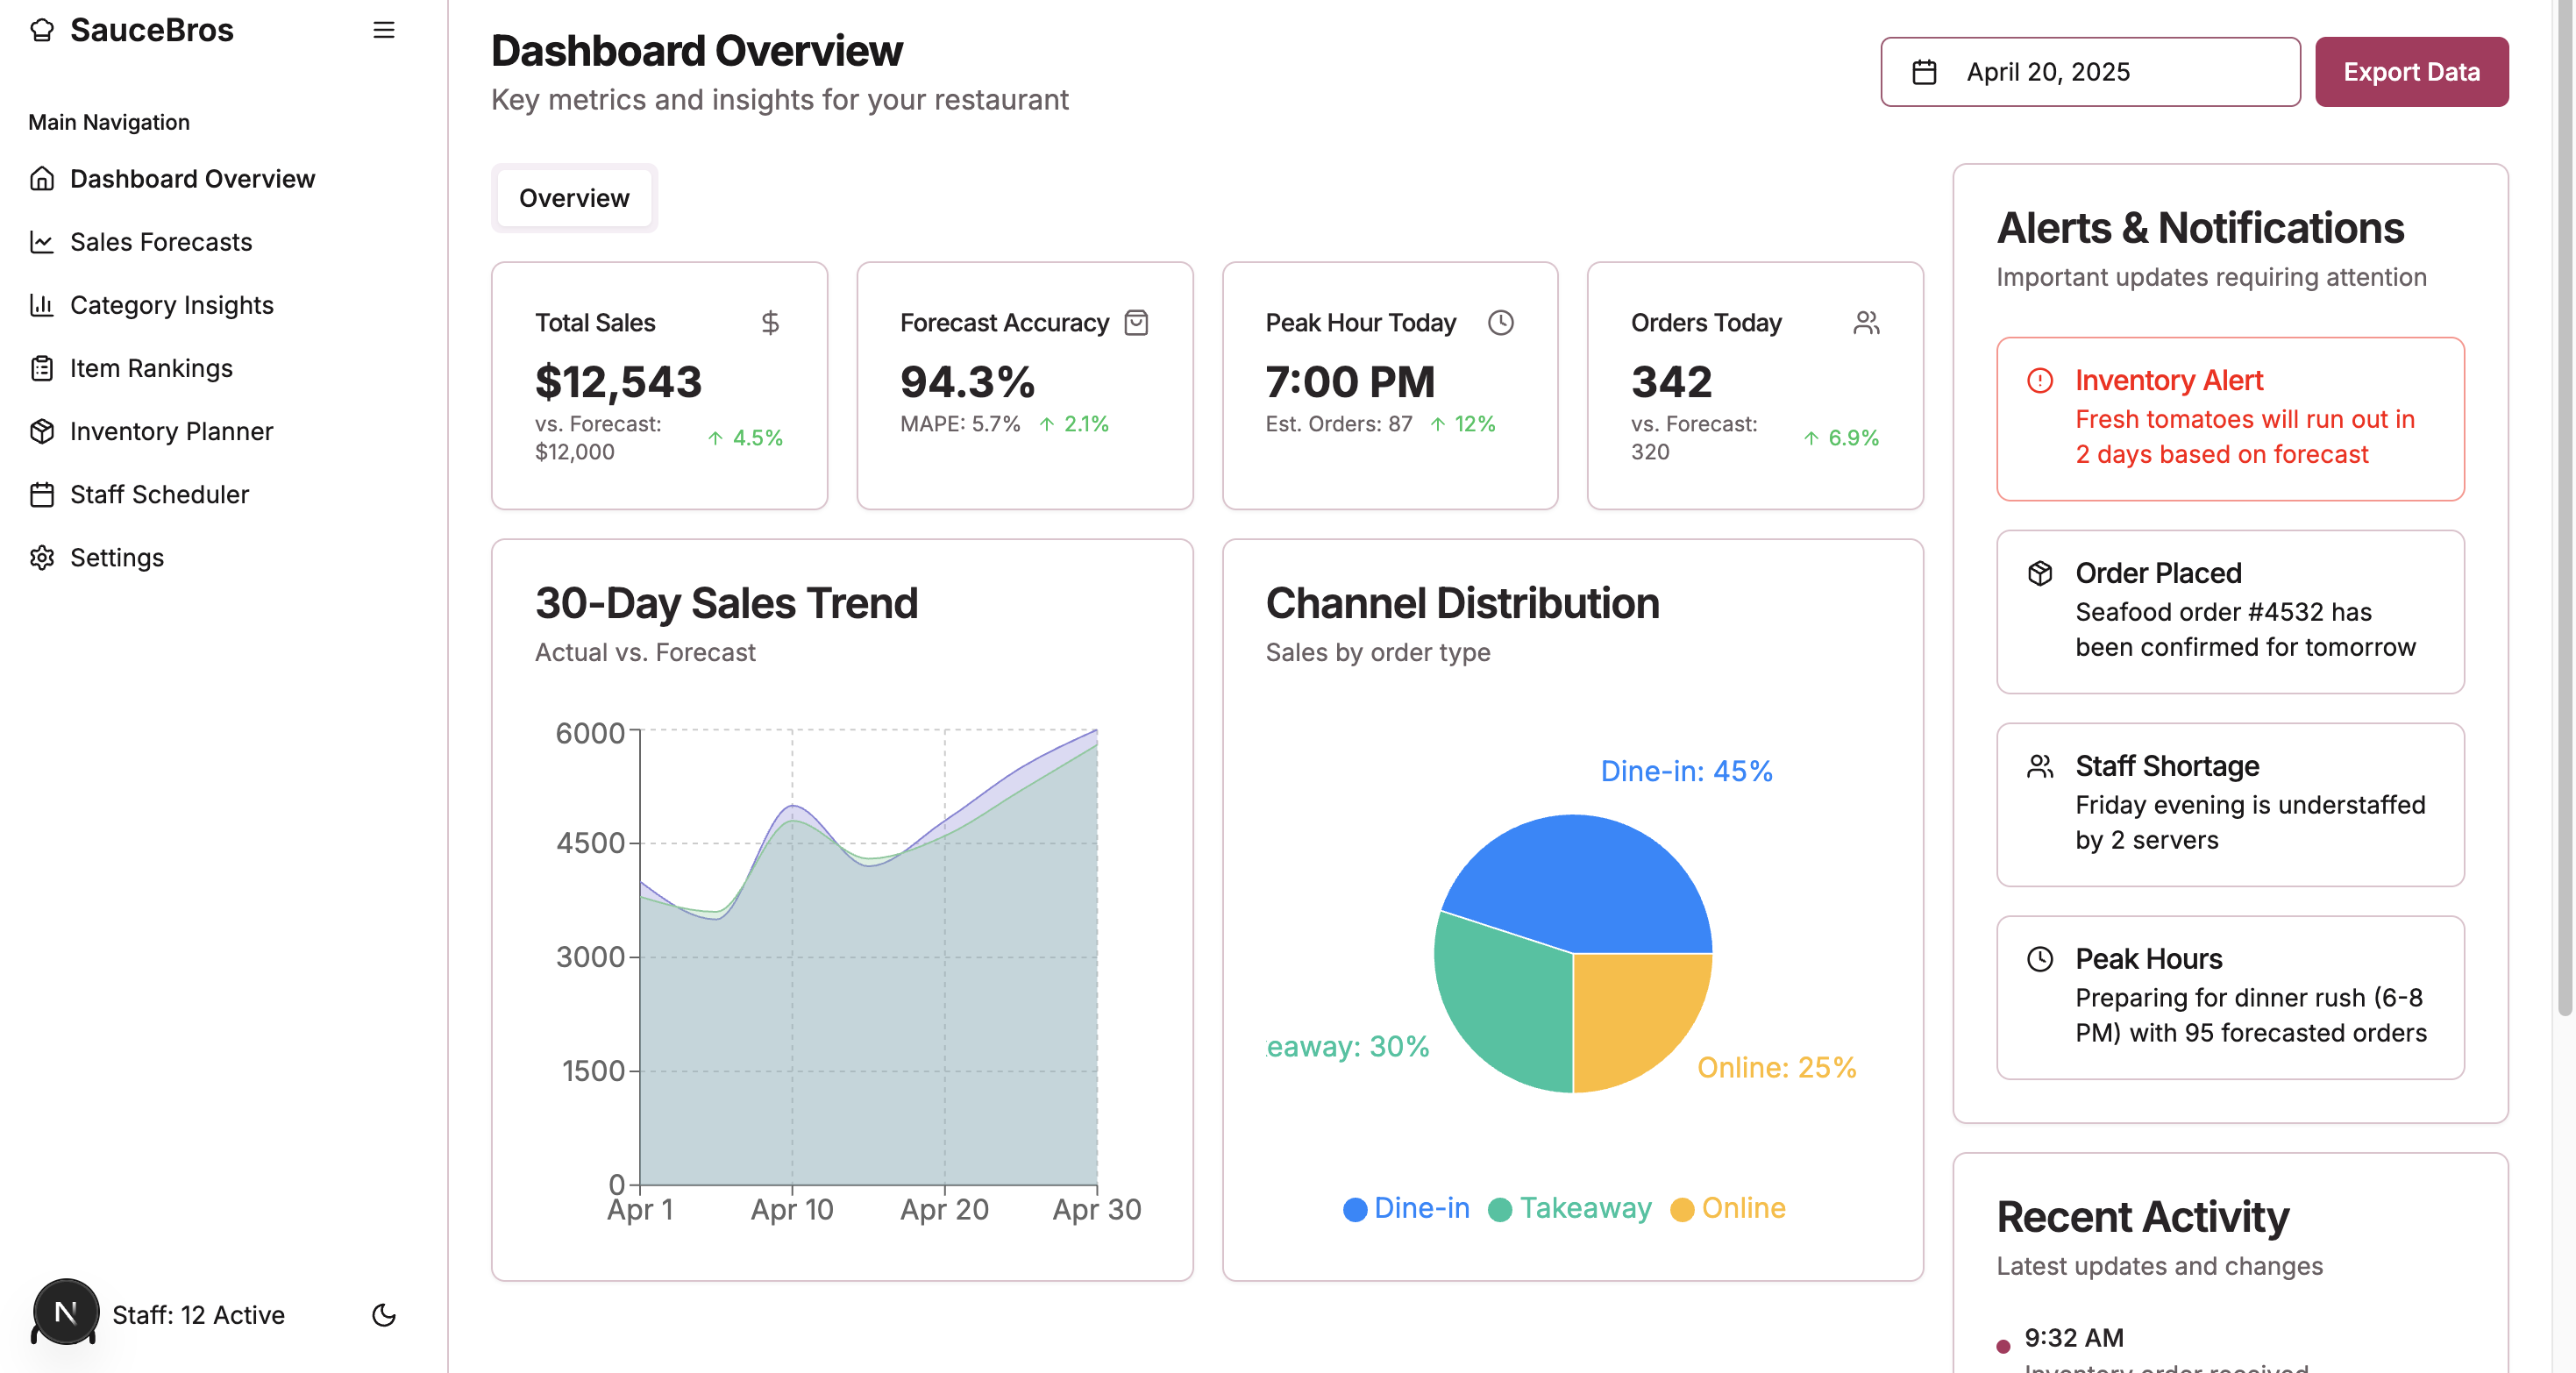
- Dashboard Visualization: Interactive charts show inventory recommendations and staffing needs.
How we built it
Outline your tech stack and key steps:
- Data Collection: Loaded and cleaned 3 years of Sauce Bros’ POS data via Pandas.
- Feature Engineering: Extracted month‑day trends, holiday flags, and local event indicators.
- Modeling: Tested SARIMA, Prophet, and XGBoost regressors with cross‑validation.
- Visualization: Built an interactive dashboard in React with Recharts.
Challenges we ran into
Be candid—what slowed you down or required creative problem‑solving?
- Handling year‑rollover when dates only included “Apr 30” style month/day strings.
- Incorporating one‑off local events (e.g. high‑school football games) without overfitting.
- Deploying the model pipeline so it could retrain automatically each month.
Accomplishments that we're proud of
Highlight wins, big or small:
- **XG boost with 94% accuracy
- **Optimize employee schedule
- **Integrated visualizations into a web app
What we learned
Reflect on skills, tools, or domain knowledge gained:
- The importance of embedding business insight (promo dates, staffing constraints) into ML pipelines.
- How to tune SARIMA parameters to capture both seasonality and trend.
- Best practices for cross‑functional collaboration—bringing operations and finance into model reviews.
What's next for SauceBros Sales Analysis
Lay out your roadmap:
- 🔄 Automate daily data ingestion and model retraining on AWS Lambda.
- 📈 Add competitor‑benchmarking by scraping Yelp and Google Trends.
- 🤖 Experiment with reinforcement learning to optimize dynamic pricing during peak hours.


Log in or sign up for Devpost to join the conversation.