-
-
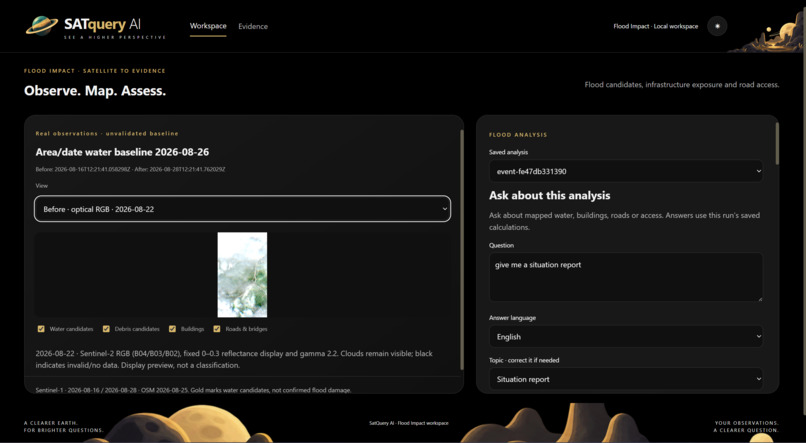
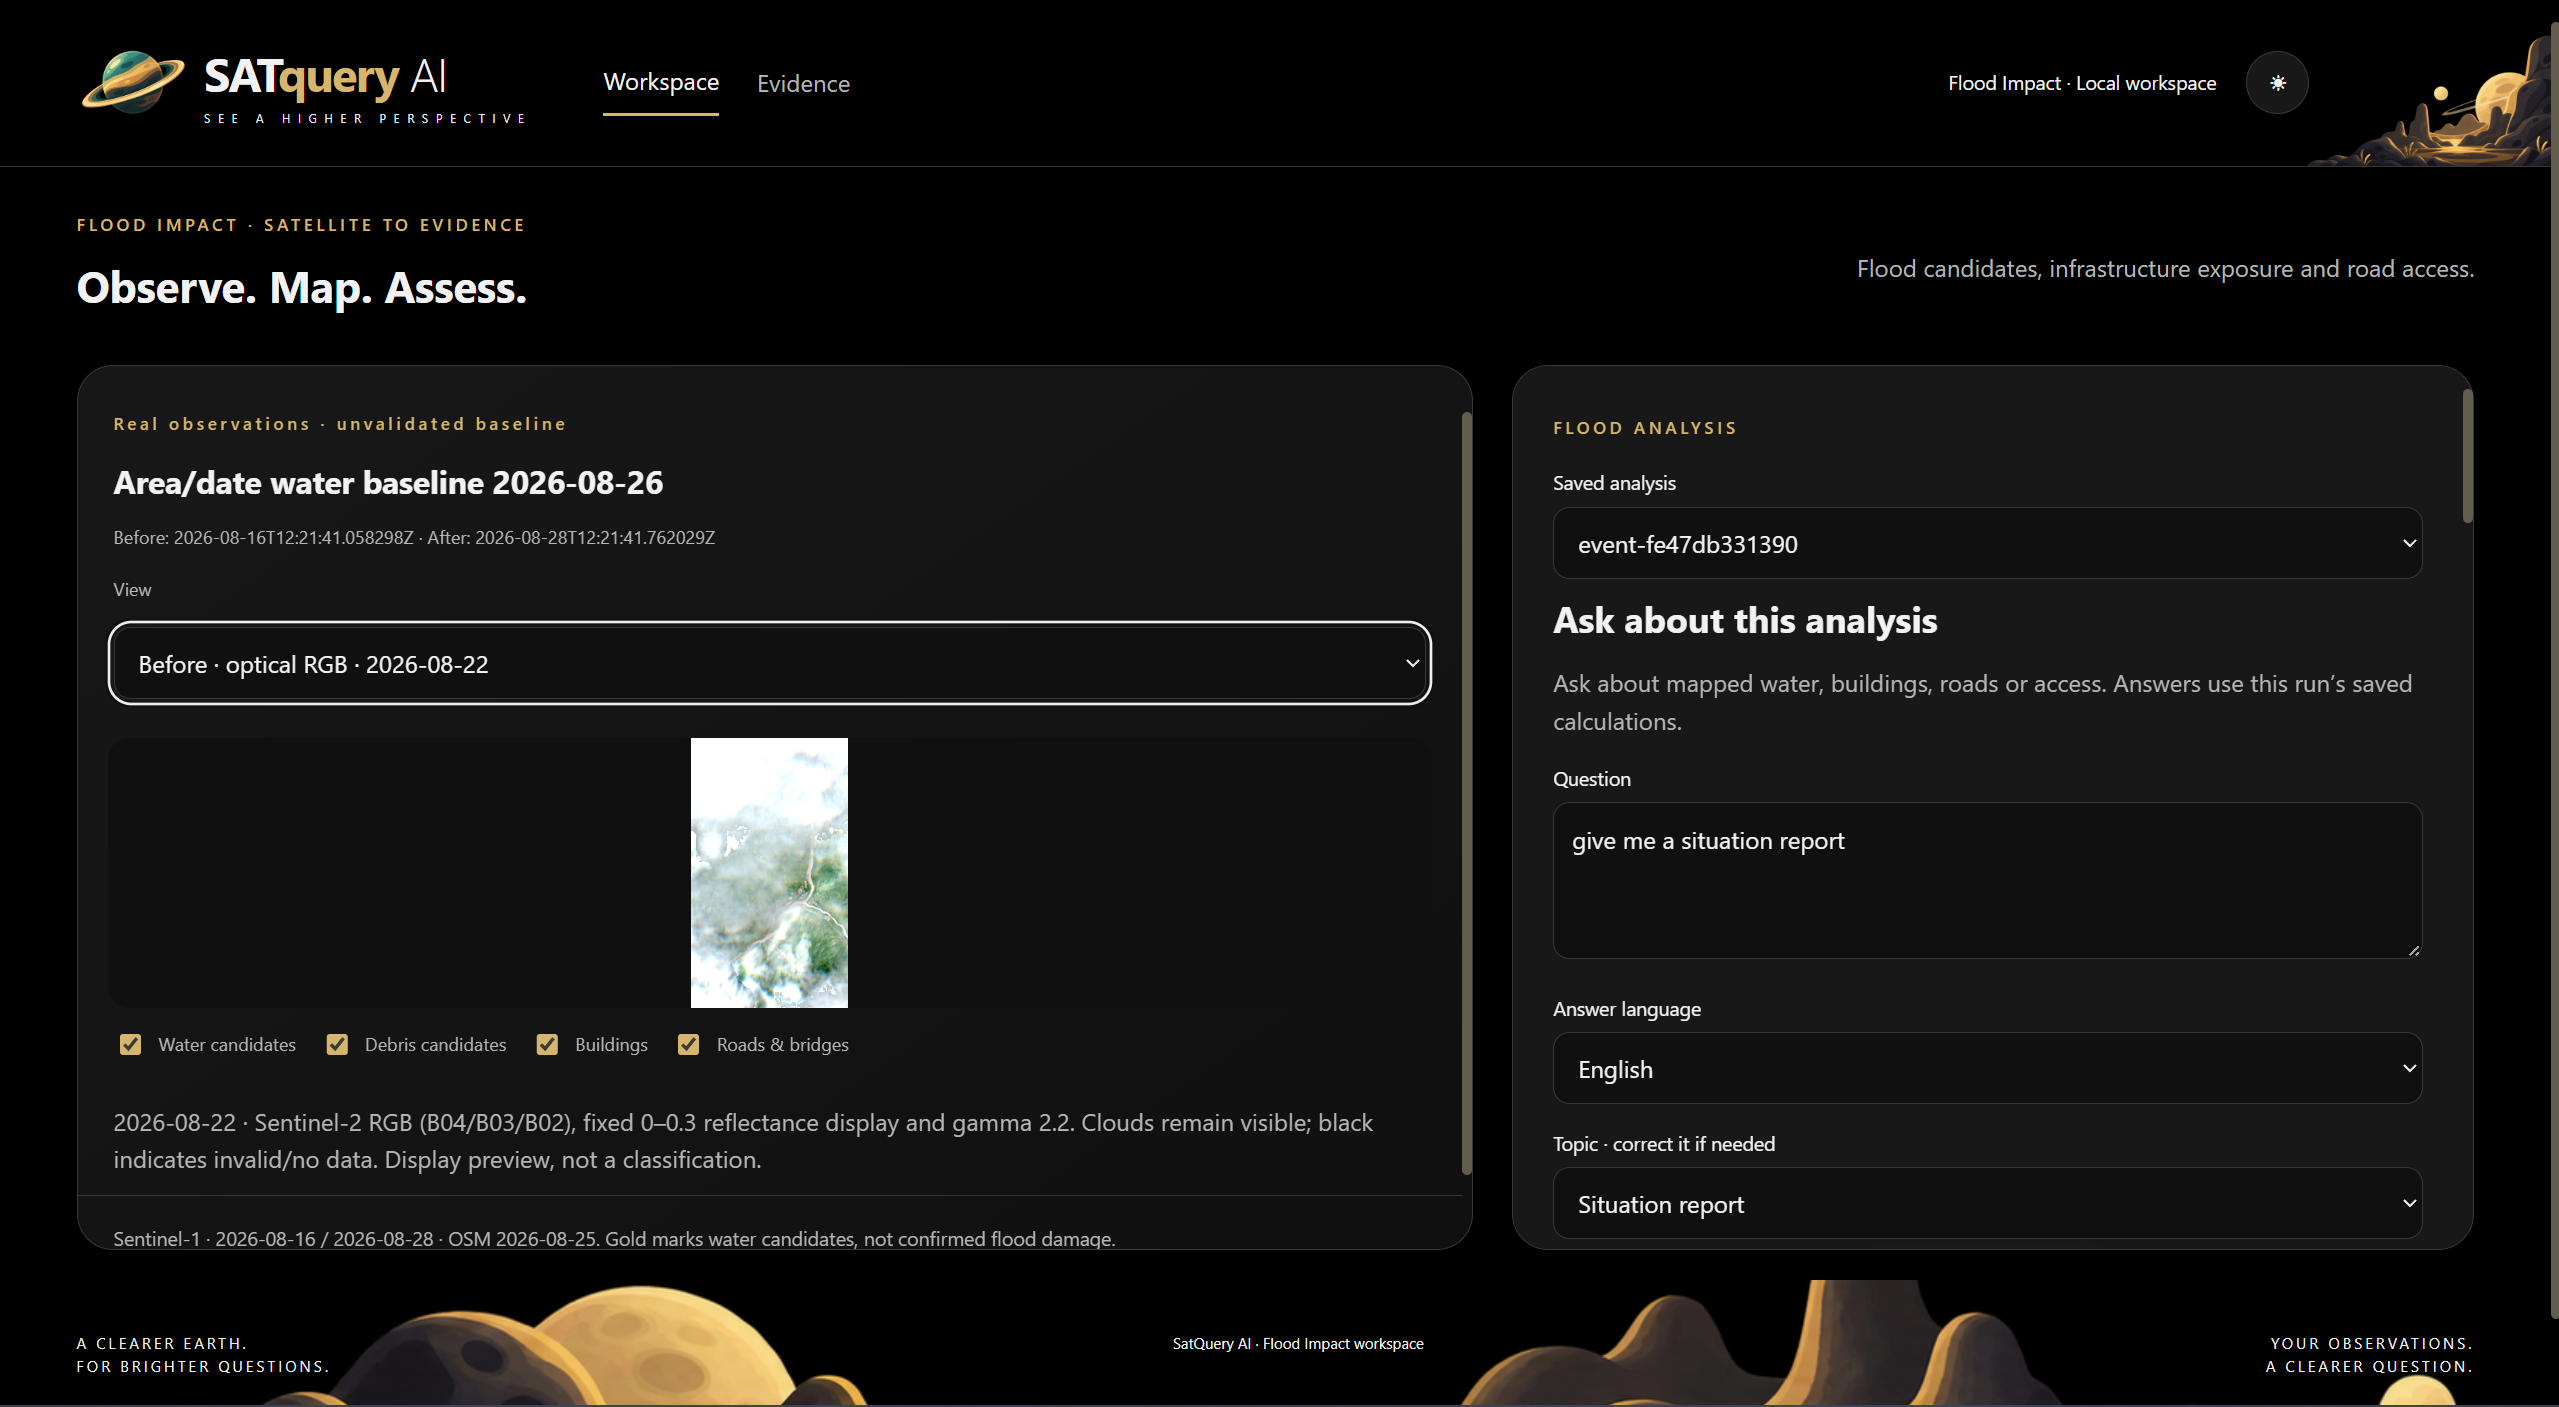
Ask the saved analysis in natural language — with selectable topic and English/Nepali output grounded in frozen run evidence.
-
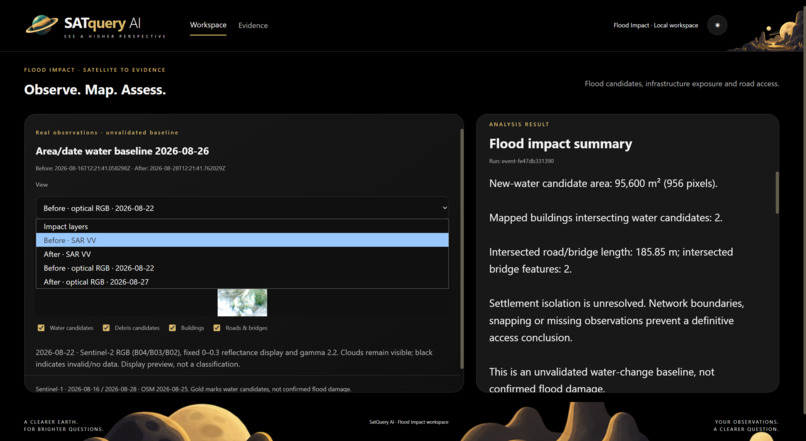
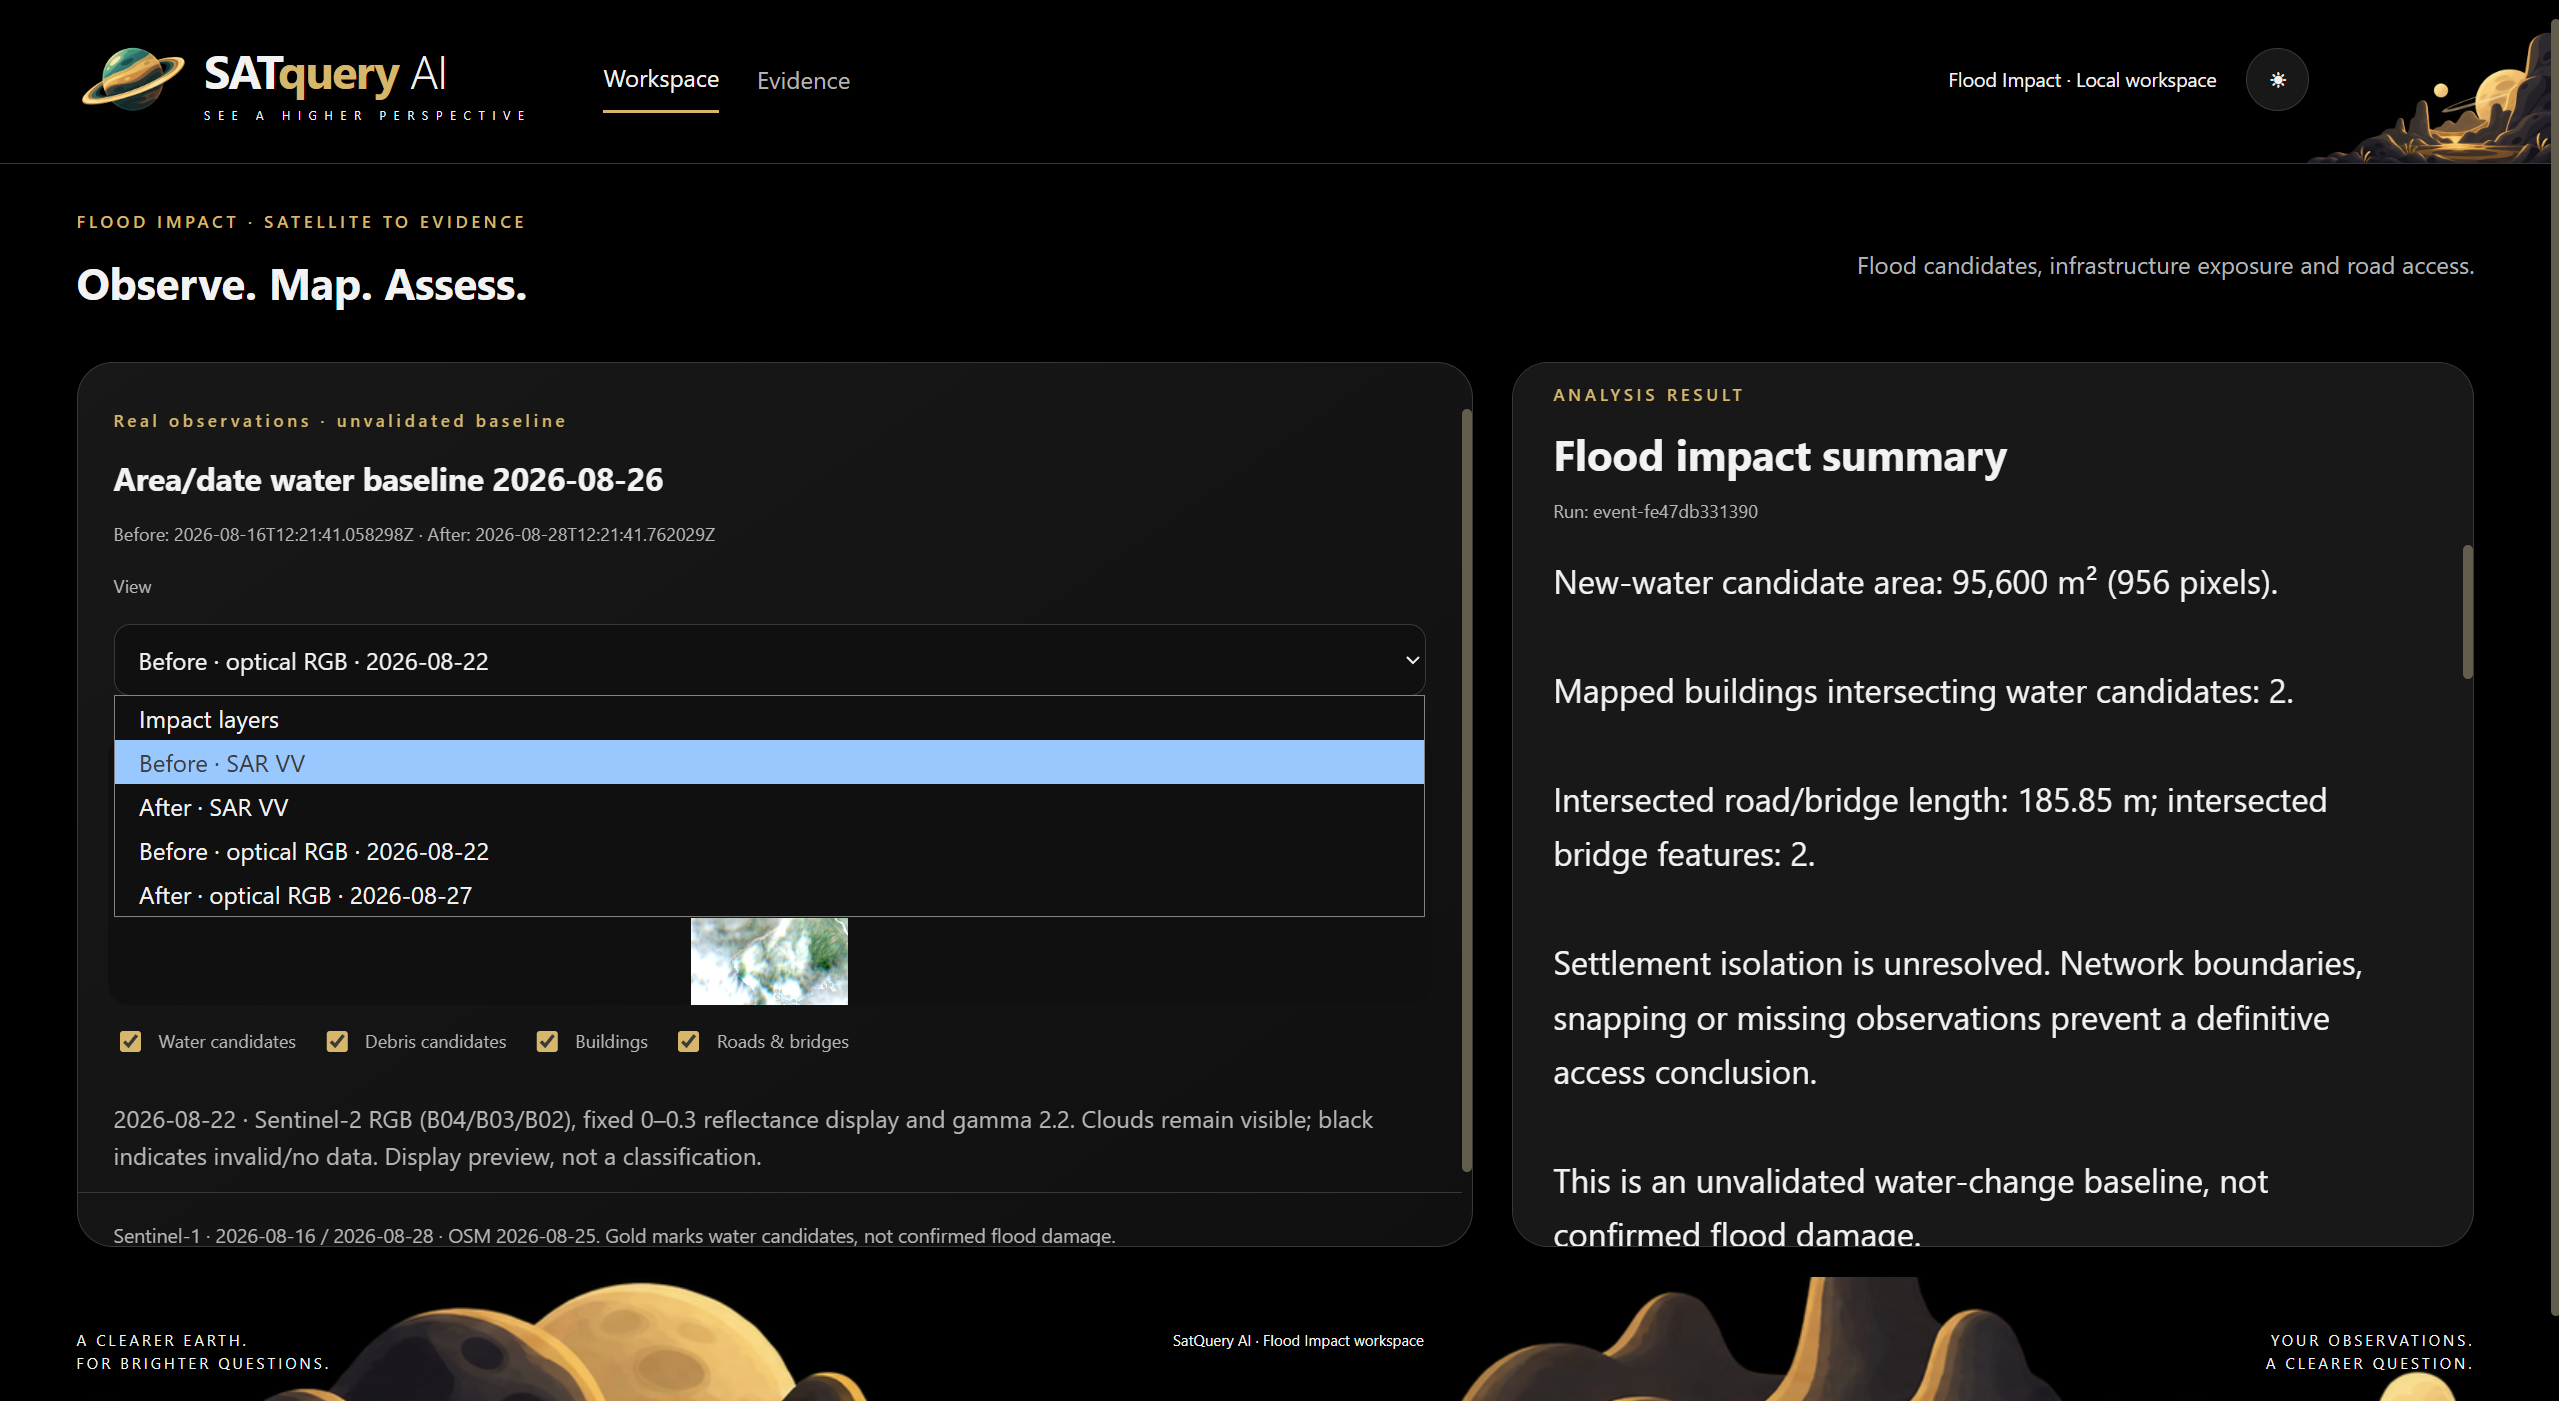
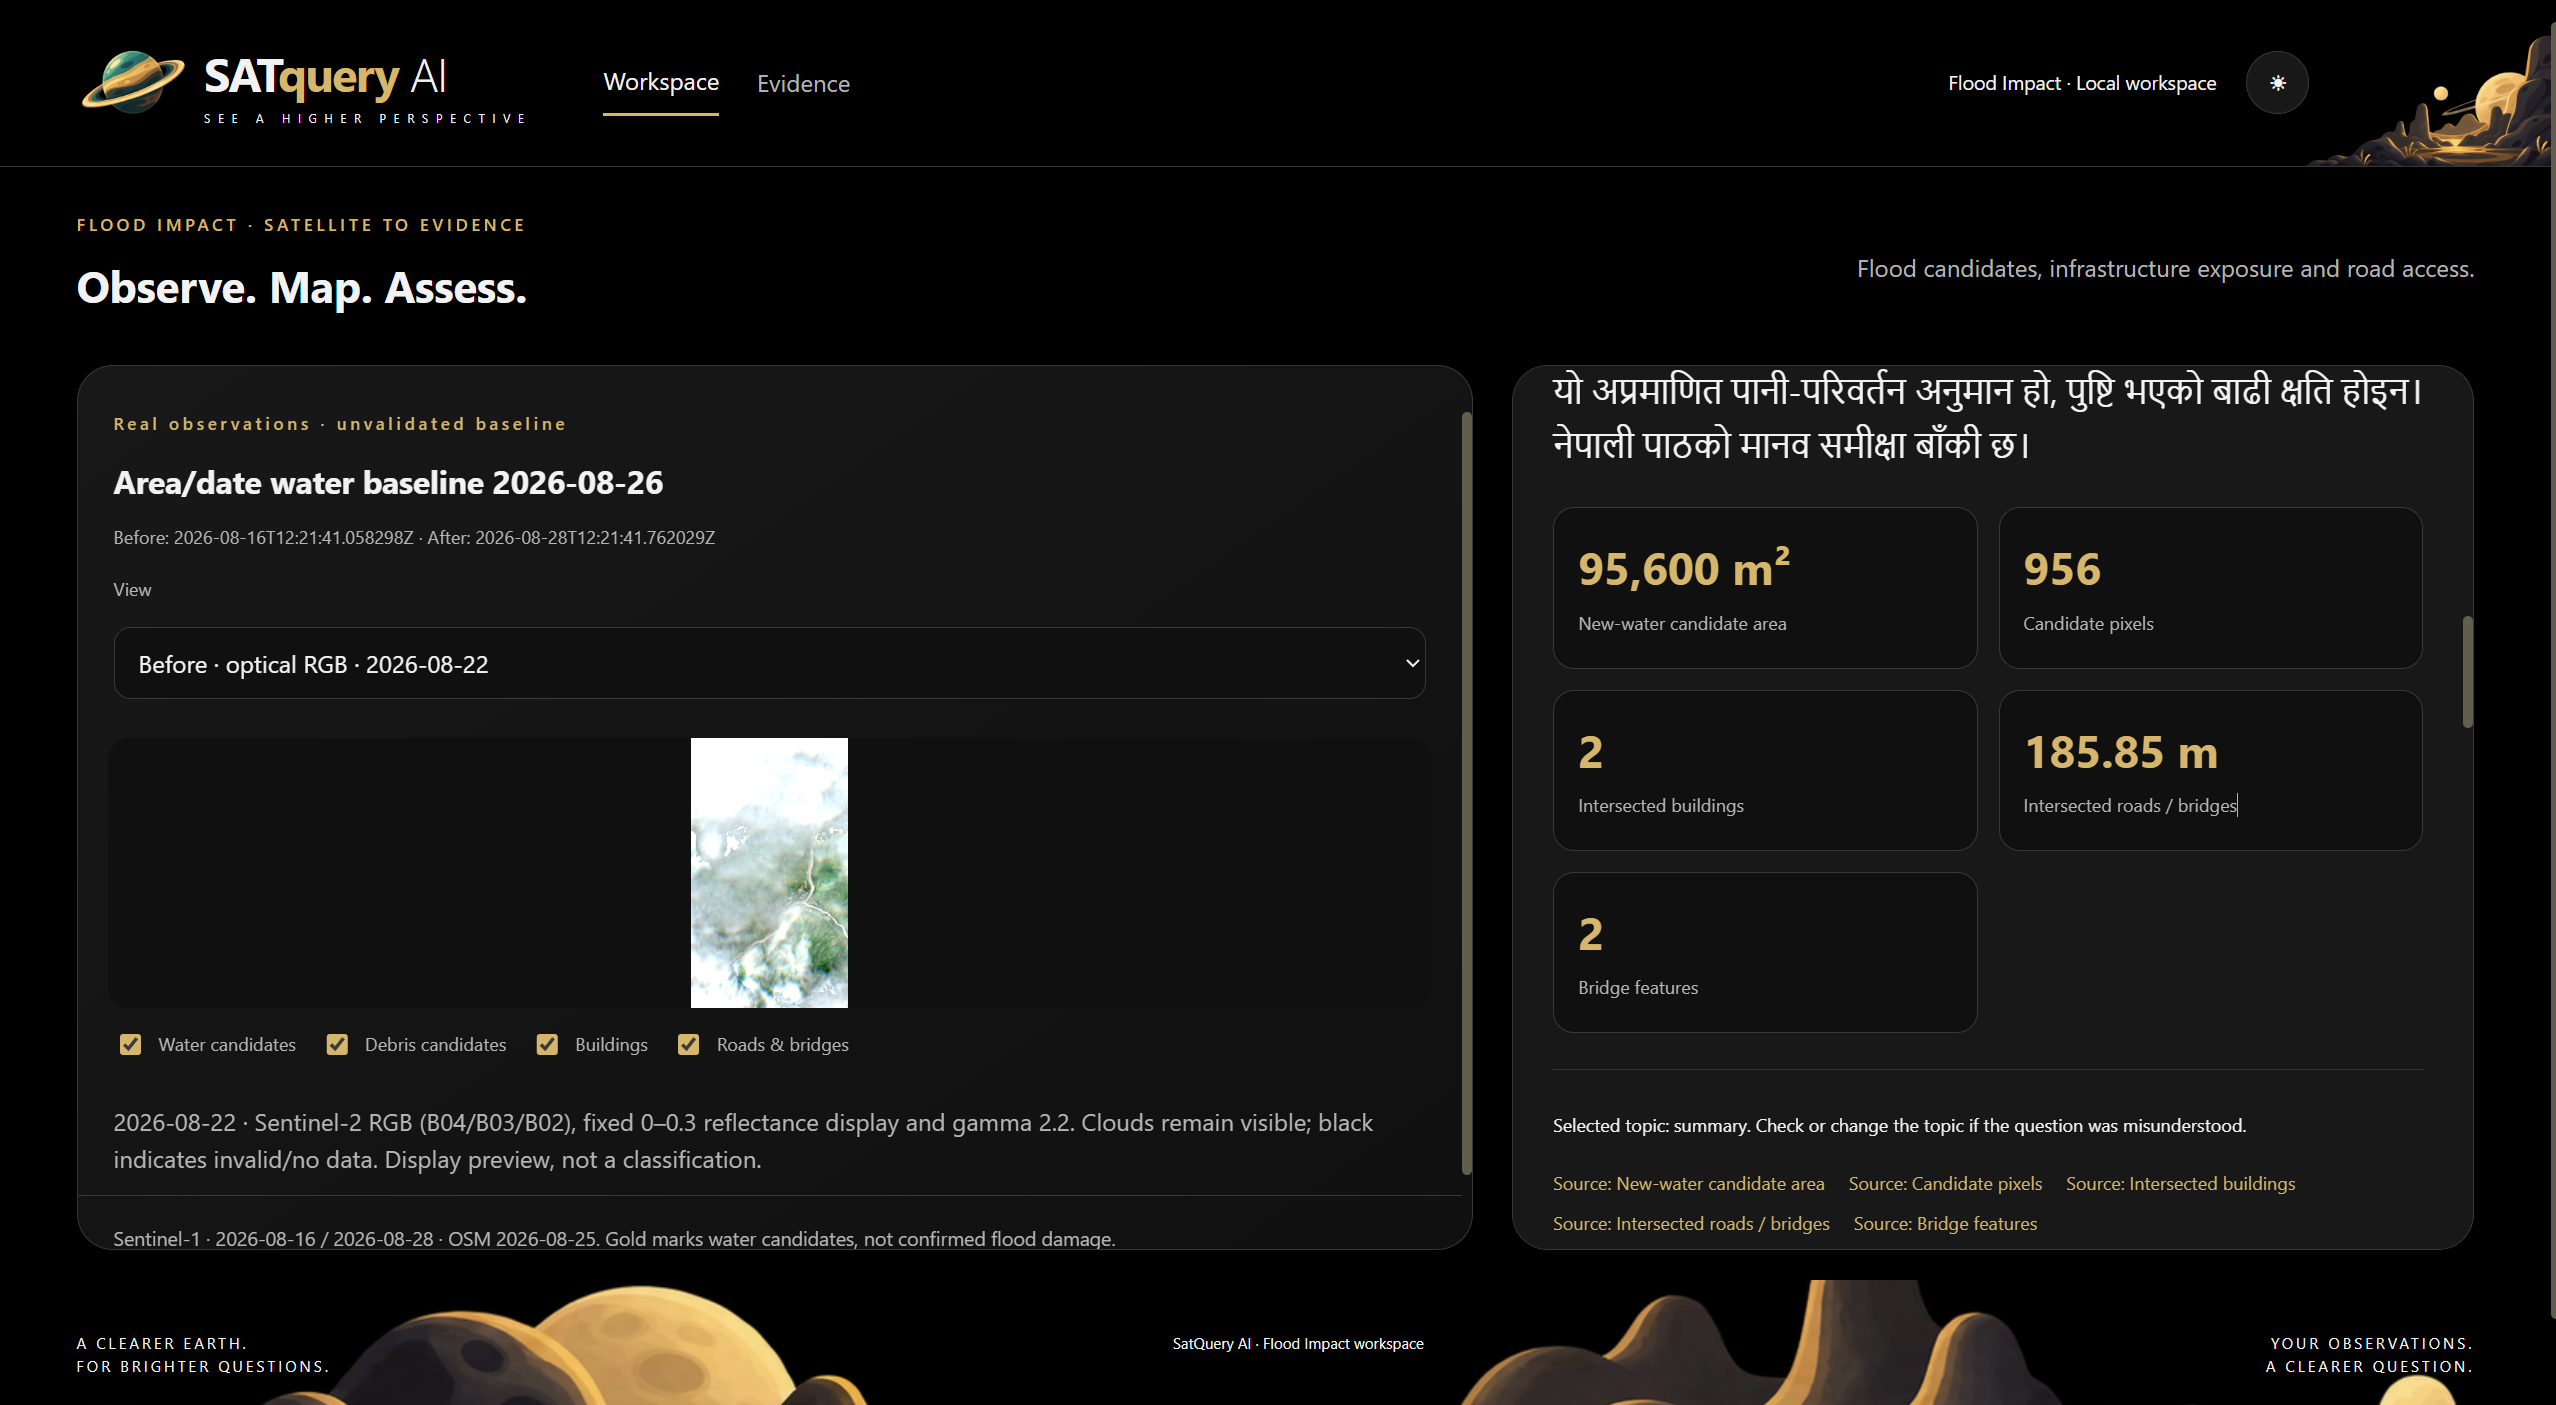
Flood impact summary — 95,600 m² of new-water candidates, 2 intersected buildings and 185.85 m of road/bridge exposure.
-
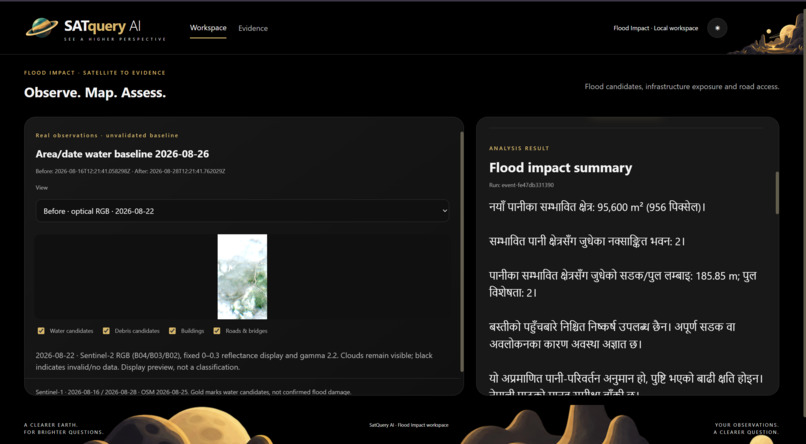
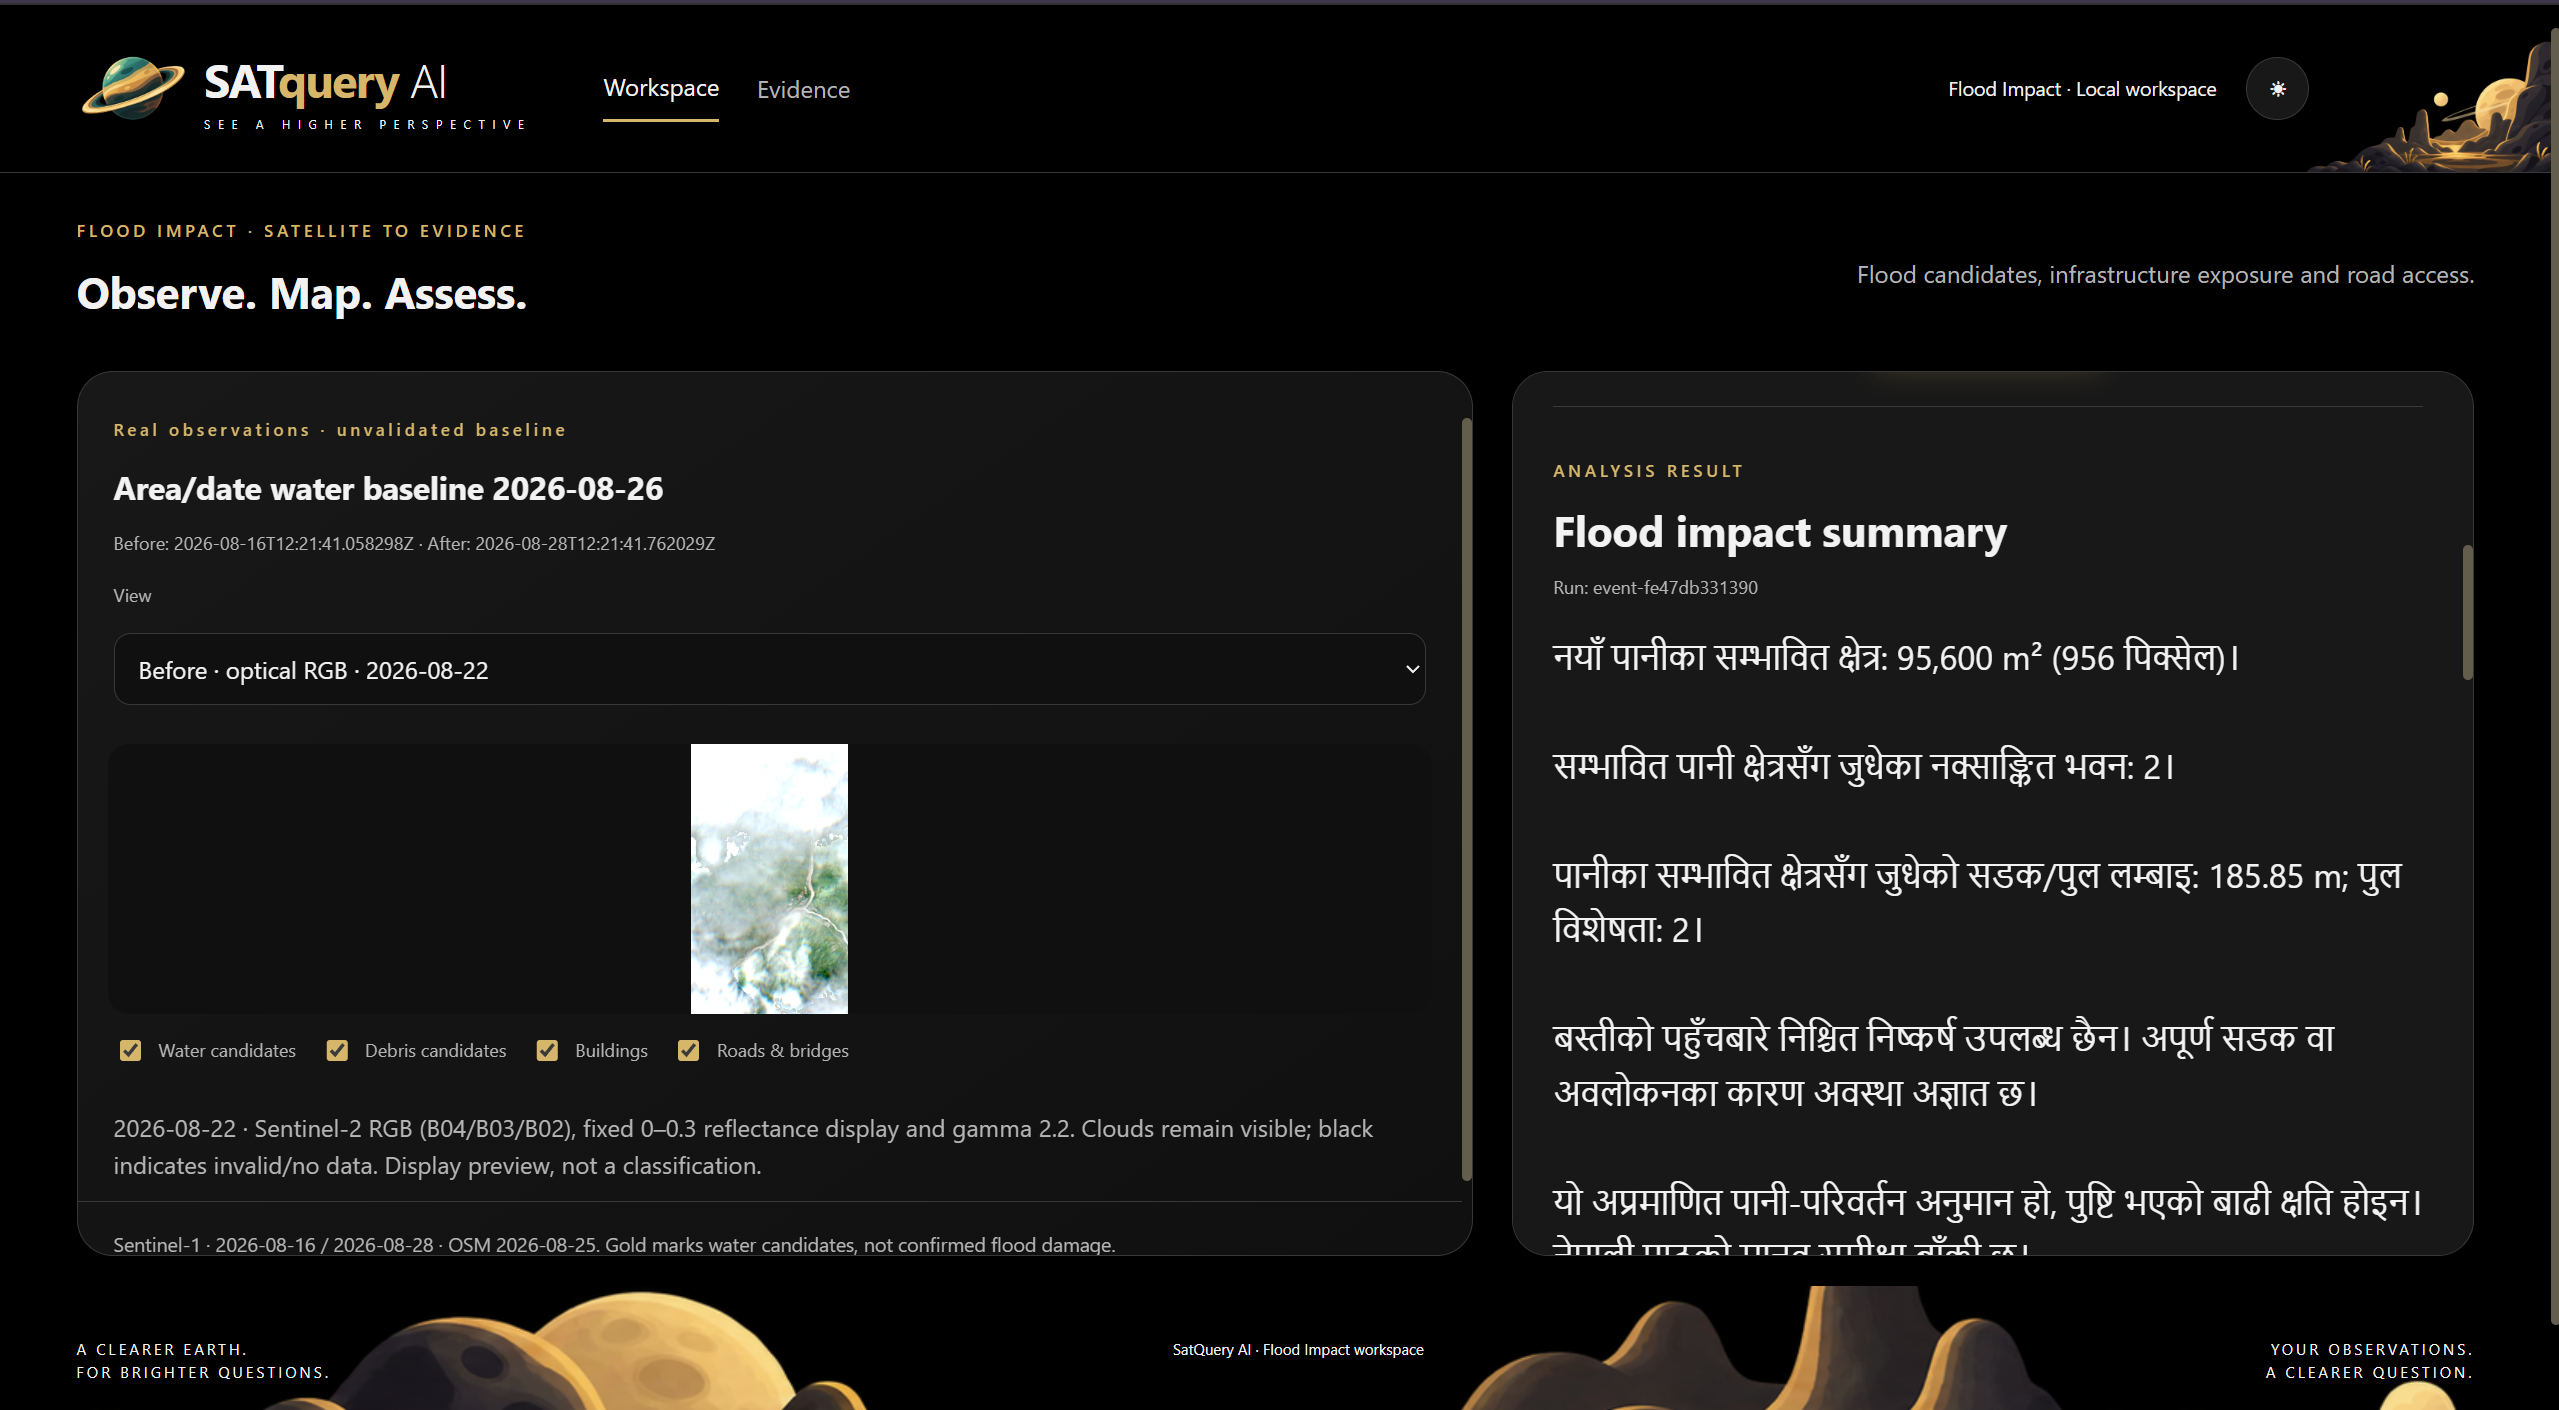
Bilingual evidence delivery — the same saved flood-impact result rendered in Nepali without changing the underlying measurements.
-
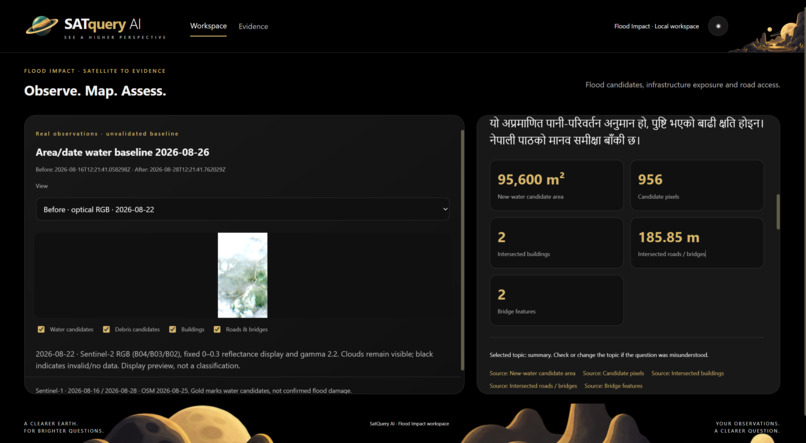
Evidence-backed metric cards — candidate water area, pixels, buildings, roads and bridge features linked directly to saved source fields.
-
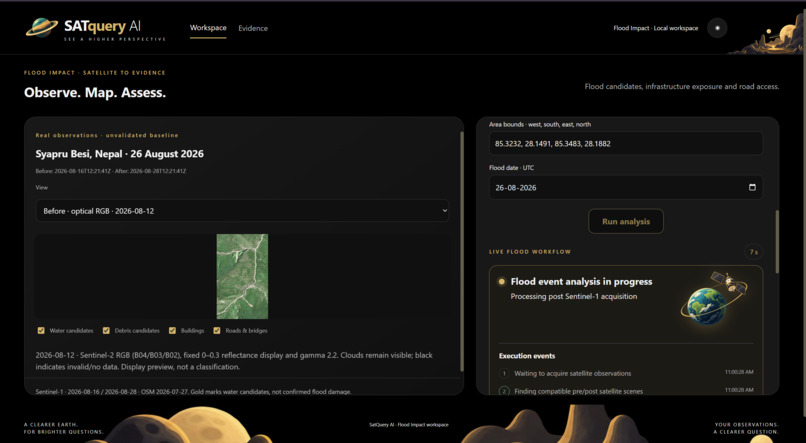
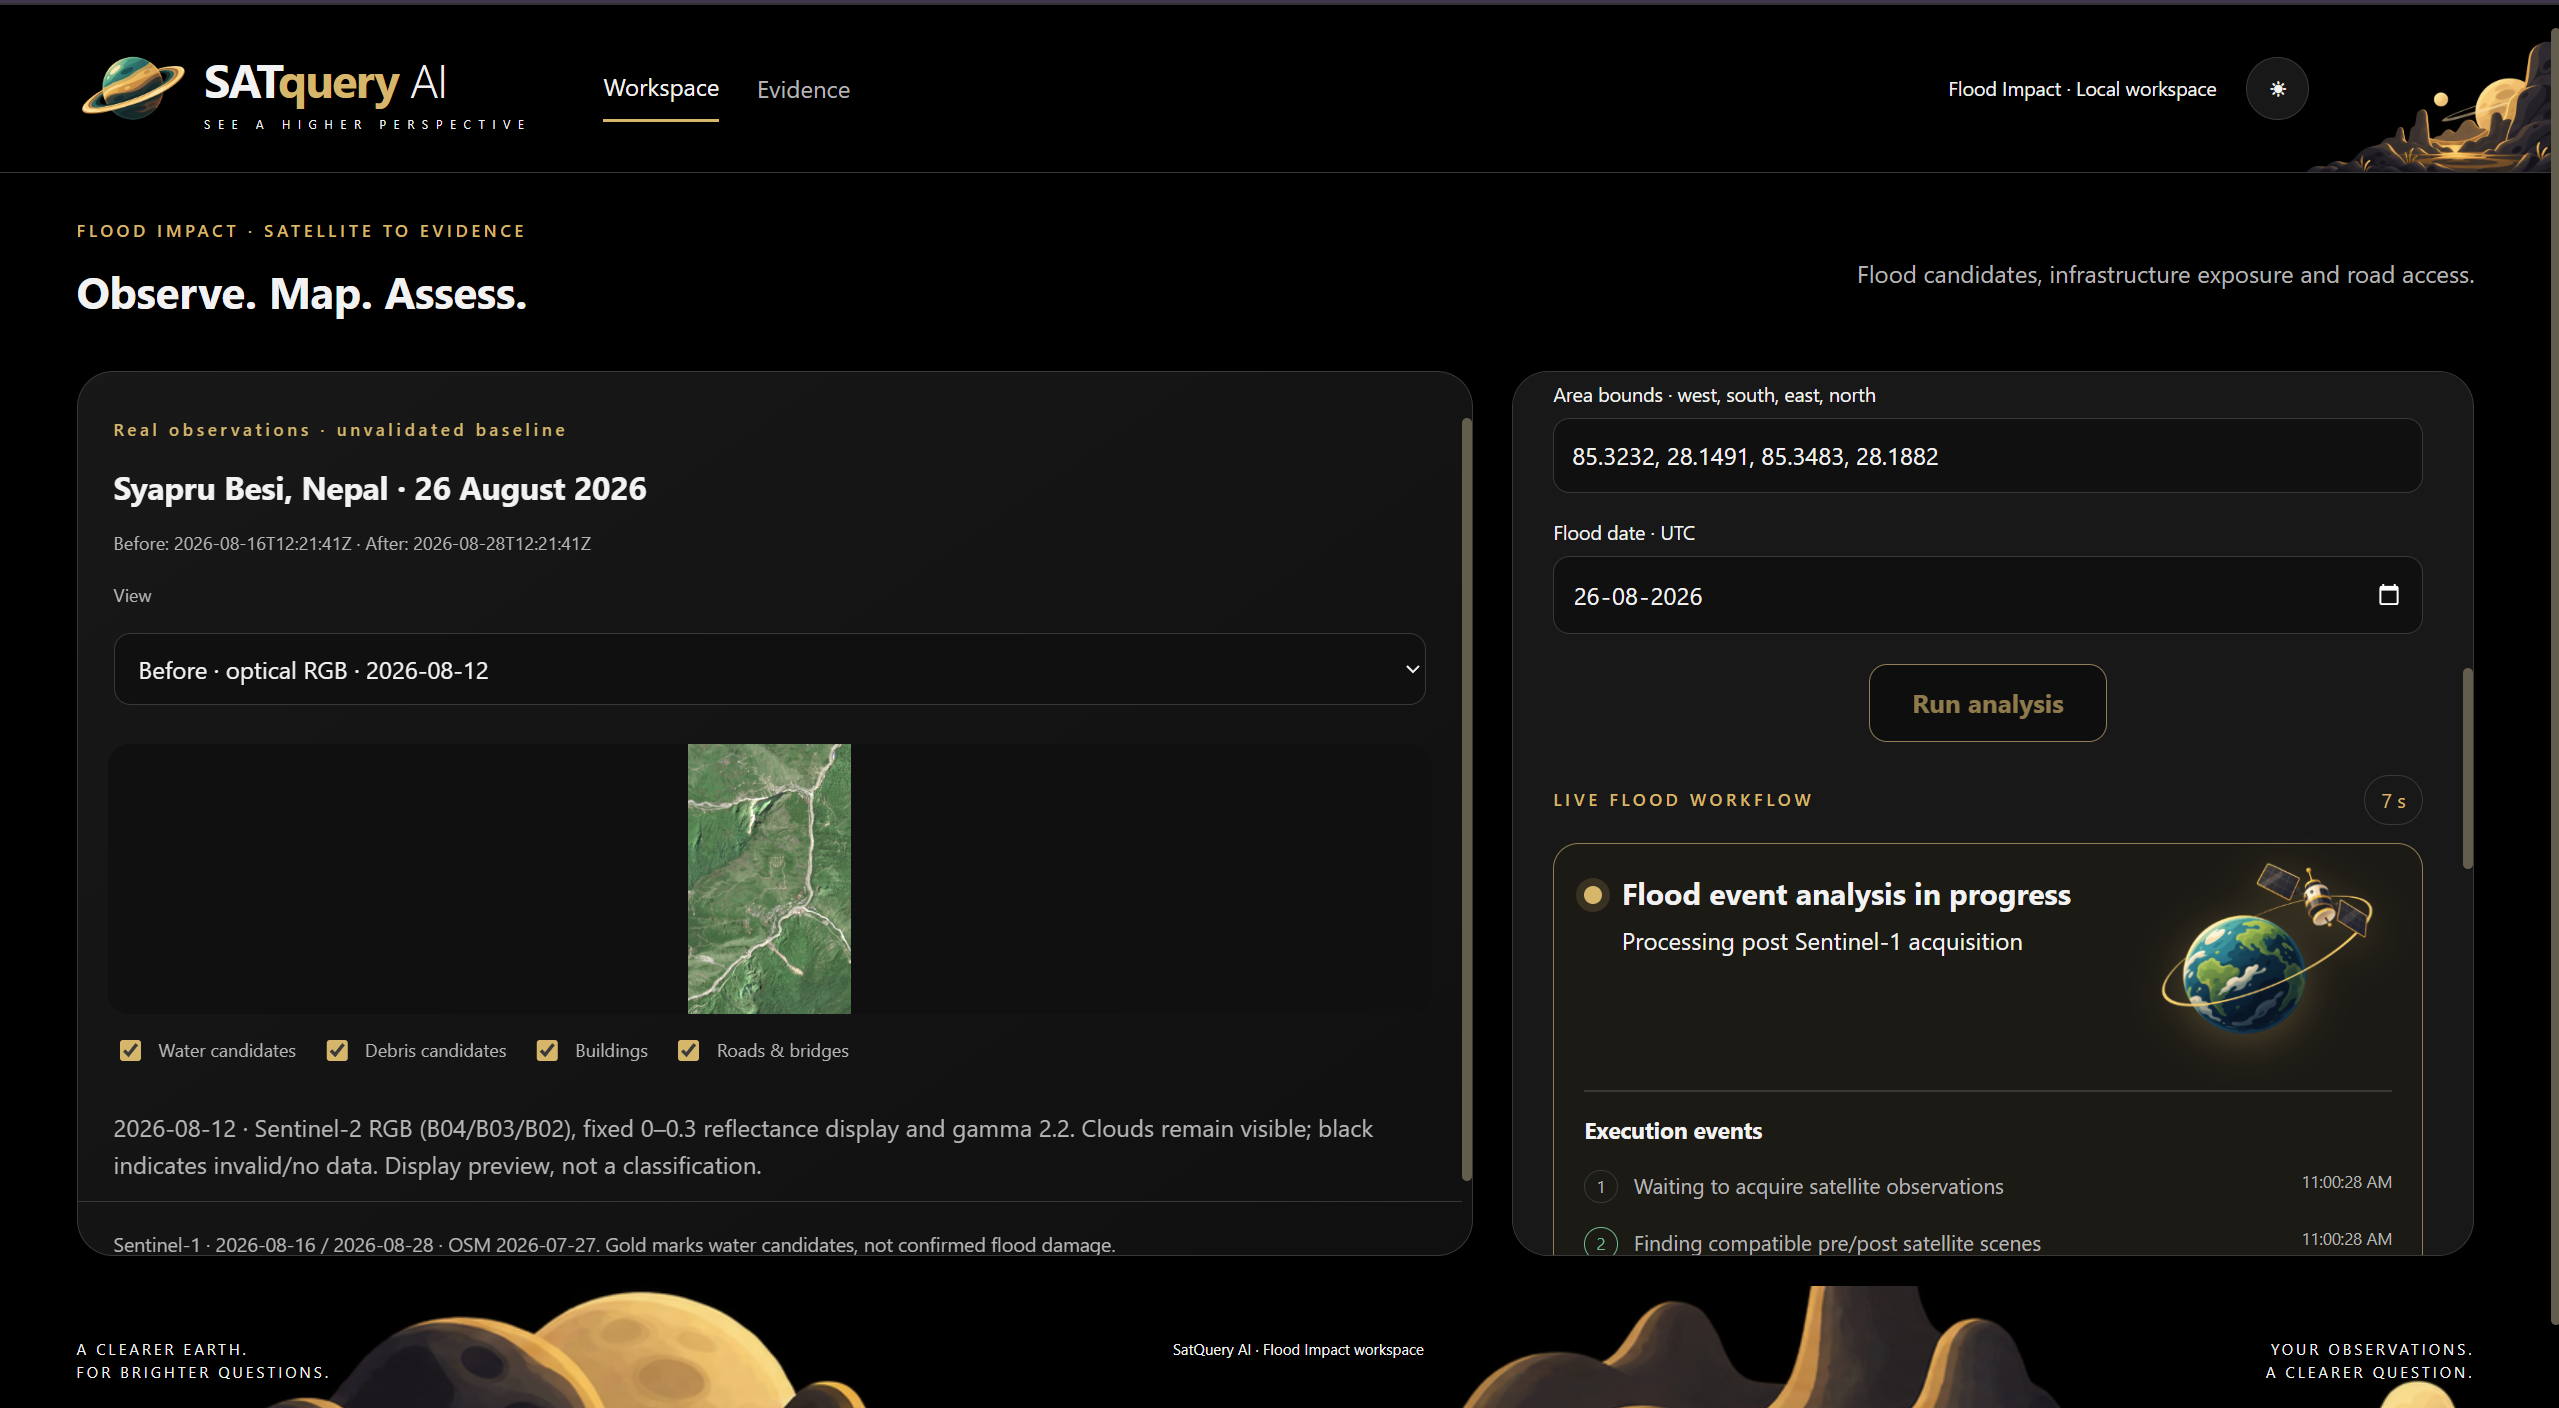
Live flood workflow — area/date input, Sentinel scene discovery and step-by-step processing status for the Nepal case.
-
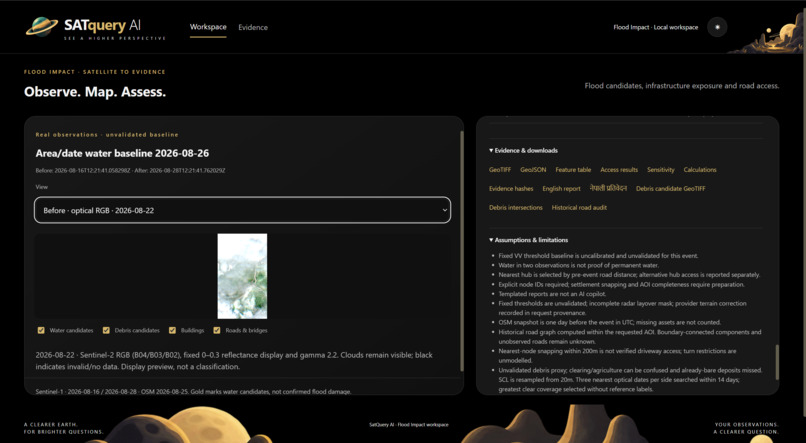
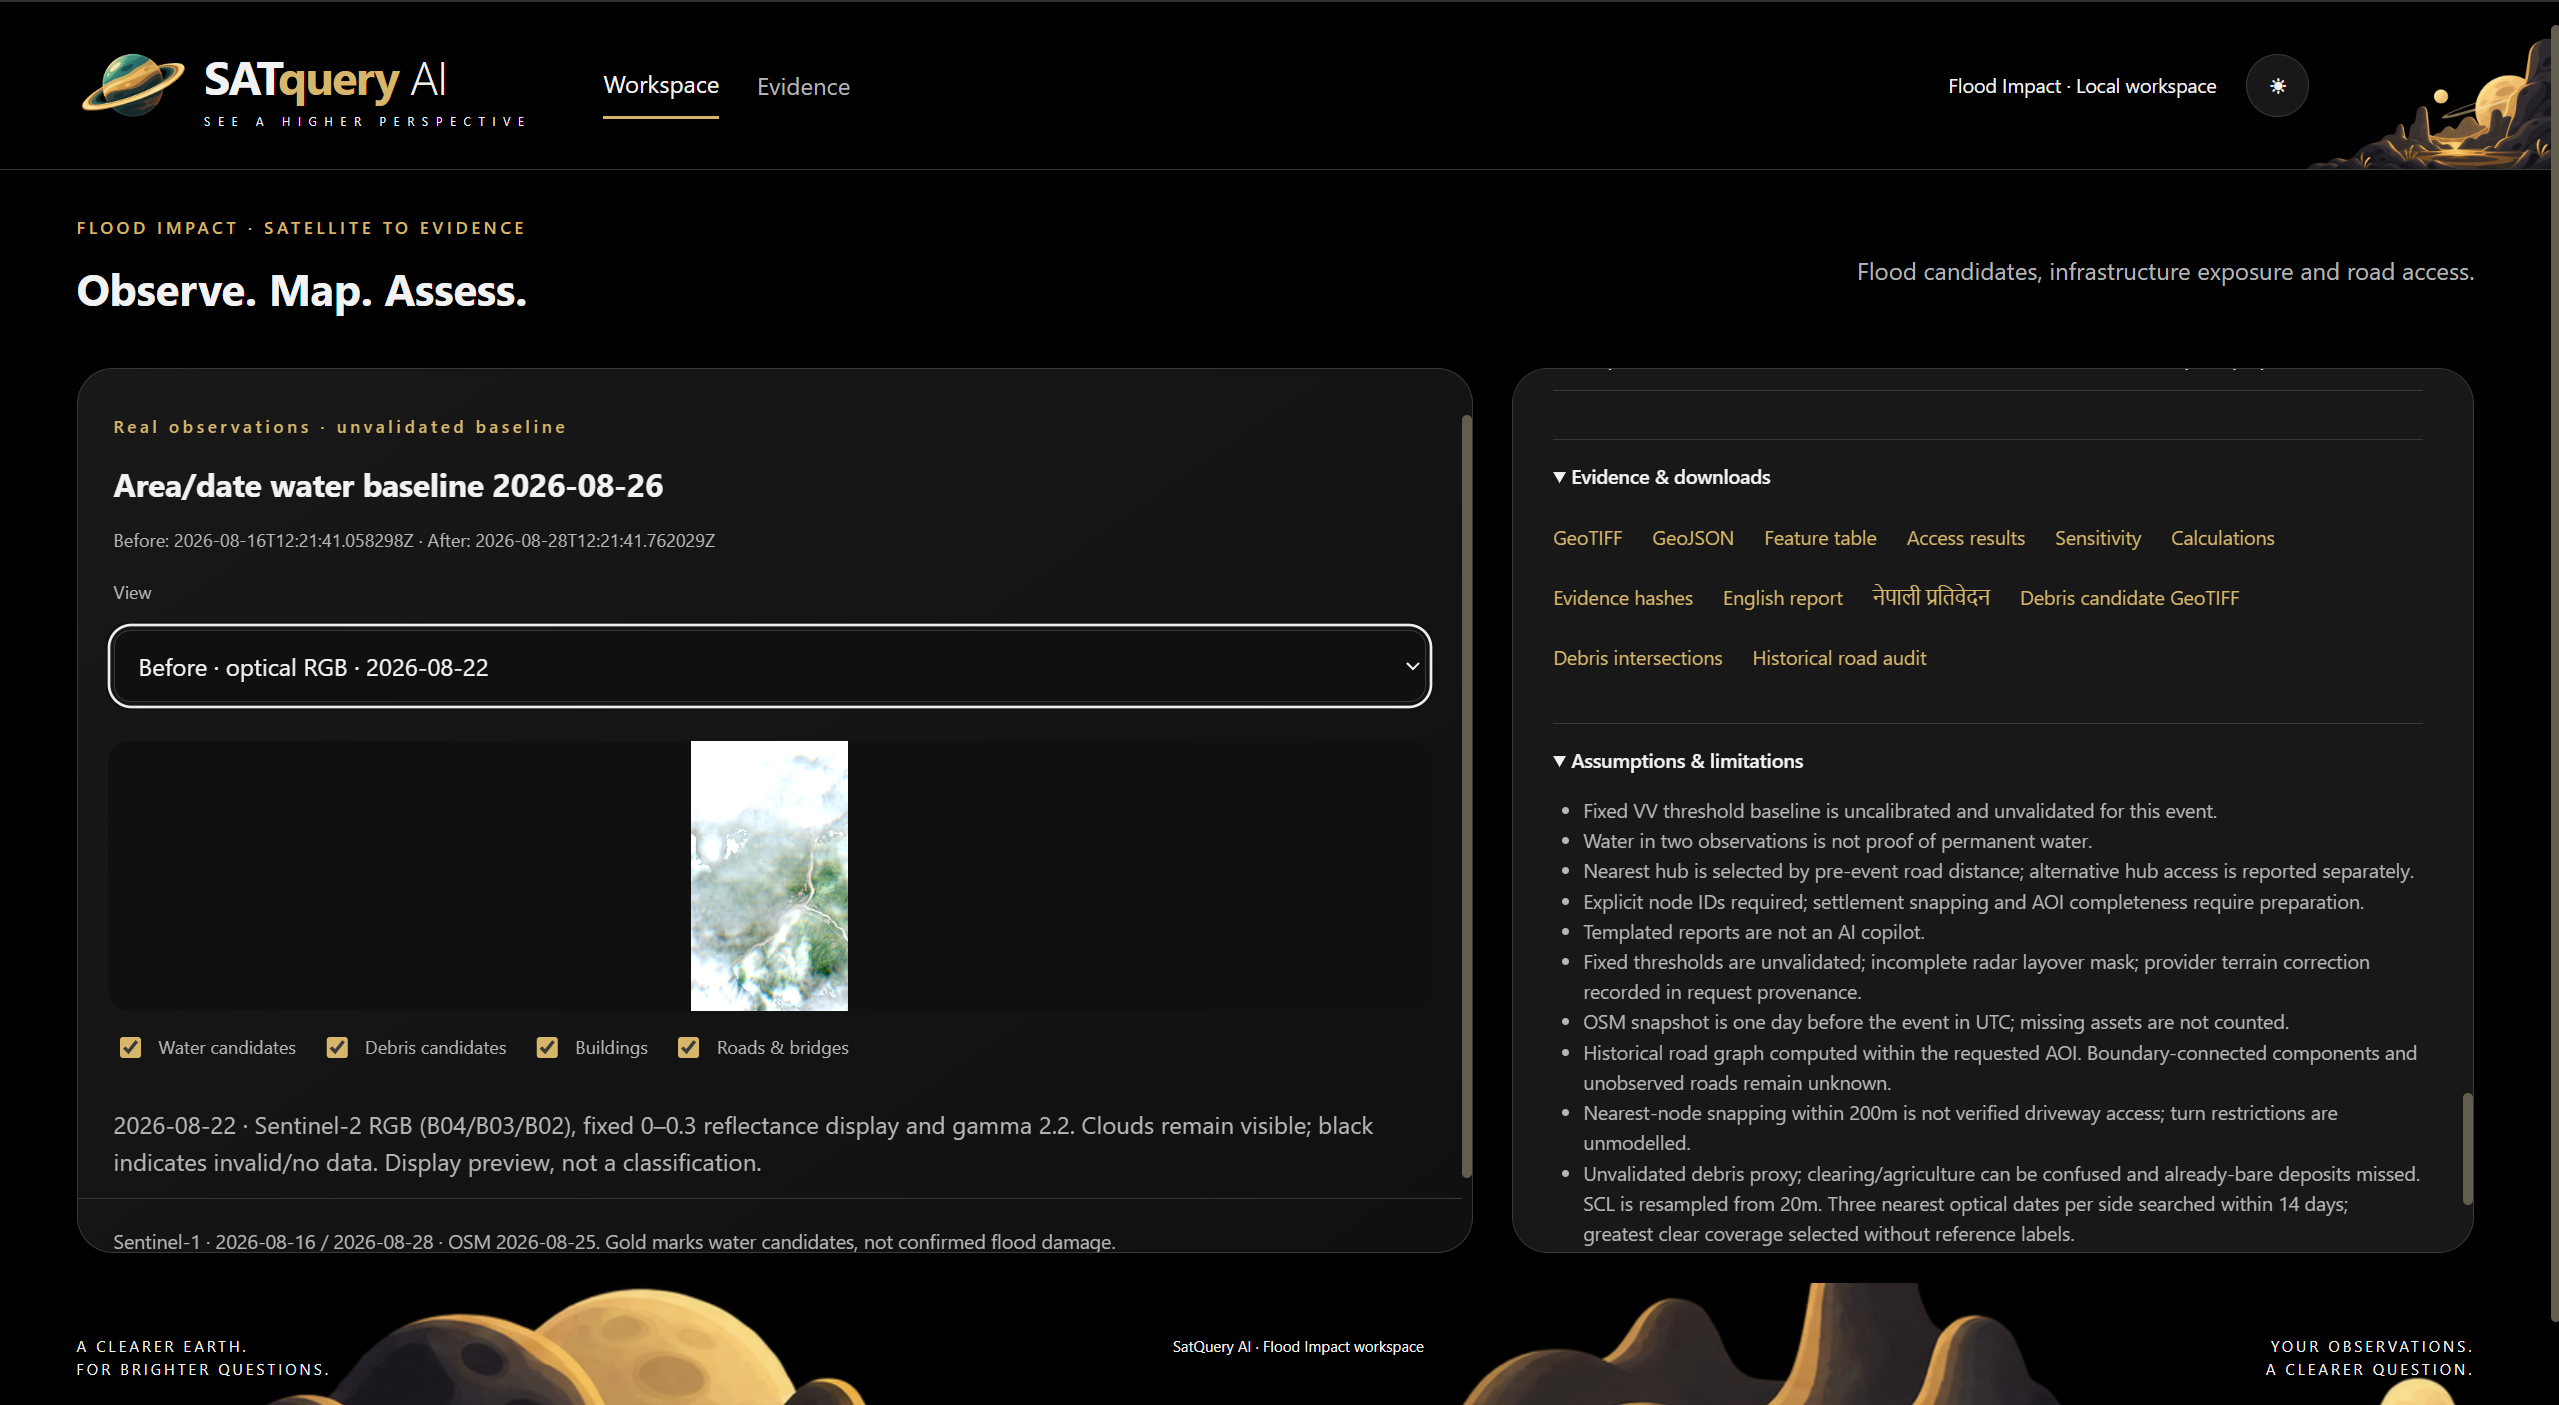
Inspectable evidence and limitations — downloadable GeoTIFF, GeoJSON, reports, hashes and explicit assumptions kept alongside every result.
Inspiration
Satellite imagery can reveal what changed after a disaster, but converting raw observations into something useful still requires several disconnected steps: finding suitable scenes, checking compatibility, processing imagery, identifying possible impact, matching it with infrastructure, and preserving enough evidence for someone to verify the result.
For the IIT Mandi Multimodal AI Hackathon, we wanted to build more than a flood mask. We wanted a reproducible workflow that could move from an event date and area of interest to satellite observations, impact candidates, infrastructure exposure, access analysis and inspectable evidence.
What it does
SATQueryAI - Flood Impact & Access Analysis is a retrospective disaster-screening workflow.
A user provides an event date and geographic area. The system then:
Discovers suitable Sentinel-1 SAR observations. Searches nearby Sentinel-2 optical imagery. Checks scene dates, orbit, grids, bands and data validity. Calculates new-water and debris-candidate regions. Retrieves historical OpenStreetMap roads, bridges and buildings. Intersects impact candidates with infrastructure. Builds a historical road graph for access analysis. Freezes calculations with hashes and downloadable evidence. Lets users question the saved evidence in English or Nepali.
The local language model only routes questions and presents values already stored in the evidence. It does not generate the measurements.
How we built it
We built the project as a separate experimental SATQuery workspace.
The workflow uses:
Sentinel-1 GRD for SAR observations. Sentinel-2 L2A for optical context. Copernicus Data Space and Sentinel Hub for scene discovery and processing. Copernicus DEM GLO-30 for terrain-aware processing. Historical OpenStreetMap data through the HeiGIT ohsome API. A road graph built from historical OSM node topology. Qwen3-0.6B locally for English/Nepali evidence-query routing.
Each run preserves scene metadata, masks, calculations, infrastructure snapshots, hashes and frozen outputs so the result can be inspected instead of treated as a black box.
Challenges we ran into
The hardest part was not building the interface. It was keeping the analysis scientifically honest.
We had to handle issues such as:
Cloud and invalid-pixel coverage. Different satellite acquisition dates. Orbit and grid compatibility. SAR terrain and layover limitations. Incomplete historical infrastructure data. Road-network cases where access cannot be confidently determined. The difference between detected water and confirmed floodwater. The difference between an intersected road and a confirmed road closure.
Our current water thresholds are still uncalibrated, the debris detector is an experimental proxy, and broad independent flood validation is still pending. We expose those limitations rather than converting them into confident-looking claims.
Accomplishments that we're proud of
70 automated regression tests passed with 0 failures. A complete fresh workspace request finished in about 66 seconds for one tested area/date. The local calculate/export stage averaged 1.18 seconds across 7 repeated runs on the same case. The automatic area/date run identified 95,600 m² of new-water candidates. It intersected 2 mapped buildings and about 185.85 m of road/bridge linework. The official AOI run identified 36,100 m² of new-water candidates, with 1 intersected building and 87.40 m of road exposure. The verified full job produced 15 downloadable, hash-checked artifacts.
We also compared our debris proxy against the EMSR927 reference only after freezing the prediction. It achieved IoU 0.328 and F1 0.494 on one AOI diagnostic. The result had high precision but low recall, so we kept it as an honest limitation rather than hiding an unfavorable benchmark.
What we learned
The biggest lesson was that disaster mapping is not only an AI-model problem.
A useful system also needs:
data contracts → provenance → geospatial processing → infrastructure context → uncertainty → reproducibility
We also learned that a failed or incomplete result can still be useful if the intermediate evidence survives.
Instead of only asking, “What did the model answer?”, we started asking:
“What data was used, what was calculated, where could it have failed, and what evidence can still be trusted?”
What's next for SATQueryAI - Flood Impact & Access Analysis
The current system is demo-ready as an experimental mapping and evidence workflow, but we do not claim validated general flood/debris accuracy or reliable settlement-isolation prediction yet.
Next, we want to:
Calibrate water detection on independent flood events. Improve SAR layover and invalid-area handling. Replace the debris proxy with a properly validated model. Test across more geographies and event types. Strengthen road-access analysis for settlements, towns and hospitals. Improve large-area performance. Have the Nepali outputs reviewed by a human speaker.
The long-term goal is not to replace disaster-response experts. It is to give them a faster first-pass workflow where every important result remains traceable to evidence.
Built With
- codex
- dem
- mngeo-geospatial-image
- ohsome-api
- python
- sentinel-monitoring
- tiff
- unavco-synthetic-aperture-radar

Log in or sign up for Devpost to join the conversation.