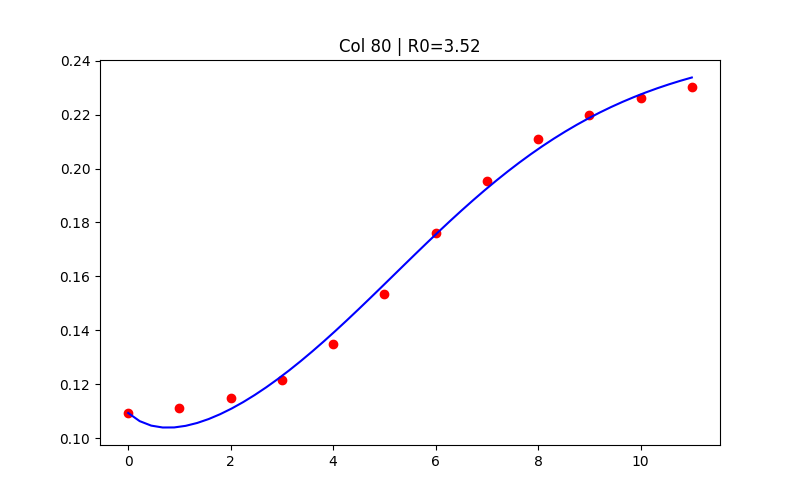
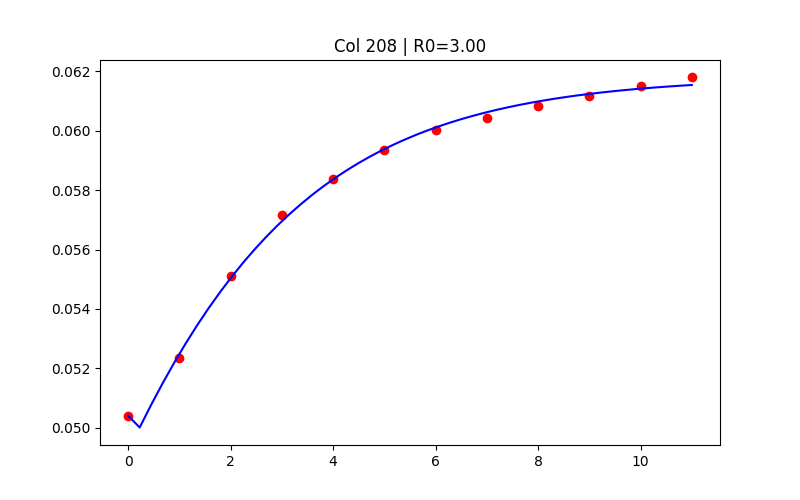
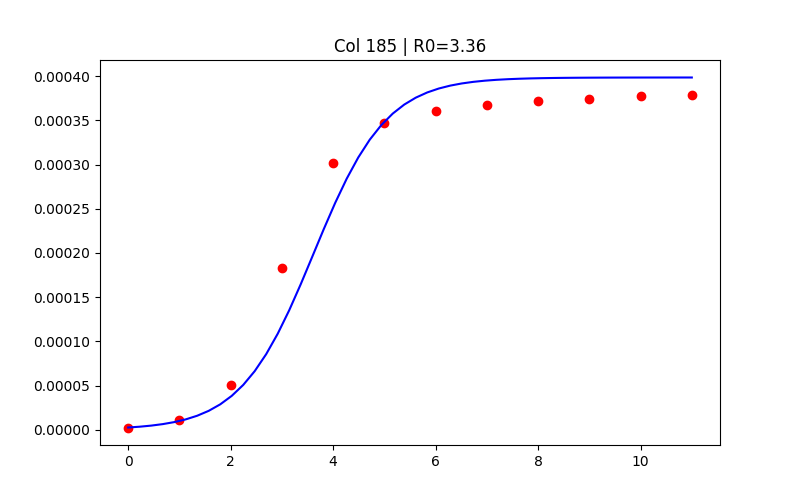
Inspiration: COVID-19 spread differently across countries due to varying population density, mobility, healthcare capacity, and policy responses. We asked: can we build a unified mathematical framework that explains these differences quantitatively, and predict future outbreaks from socioeconomic indicators alone? What it does: Models COVID-19 spatial spread using the Fisher-KPP reaction-diffusion equation: ∂u/∂t = D∇²u + ru(1-u/K) - γu Solves the inverse problem: fits D (diffusion), r (growth rate), and γ (recovery) to real infection curves for 240 region-quarter combinations using CUDA-accelerated 2D PDE solvers Uses stacking ensemble ML (XGBoost + ExtraTrees → RidgeCV) to map ~15 socioeconomic features to PDE parameters, achieving CV R² > 0.8 Provides an interactive web application for real-time epidemic simulation with adjustable parameters and NPI policy controls How we built it: PDE Solver: 2D finite-difference on circular domains (R = √(Area/π)), with CFL-stable adaptive time stepping. CPU version uses scipy least_squares; GPU version uses PyTorch to optimize all 240 regions simultaneously Feature Engineering: Socioeconomic features (density, mobility, hospital beds, testing rate, temperature) plus engineered interactions (mobility×density, climatic growth factor) and lag-1 temporal features ML Pipeline: Random Forest for feature importance analysis, then Stacking Ensemble (XGBoost + ExtraTrees → RidgeCV) for parameter prediction with 5-fold cross-validation Website: Interactive Fisher-KPP simulation built with vanilla JS + Canvas + KaTeX, dark theme, real-time parameter adjustment Visualization: Mathematica for 3D parameter space plots, Python matplotlib for fitting results Challenges we ran into: Fitting PDE parameters to noisy real-world data required careful initial condition calibration and adaptive residual weighting GPU batch optimization needed log-space parameterization to ensure physical positivity constraints Balancing ML model accuracy vs. overfitting with only 240 data points required lag-1 temporal features and region baselines as regularization Accomplishments that we're proud of: CUDA batch solver fits all 240 regions simultaneously on GPU, ~100× faster than sequential CPU Fitted R₀ values (2.0–4.0) are consistent with published COVID-19 literature The stacking ensemble achieves CV R² > 0.8, meaning socioeconomic features can reliably predict epidemic dynamics Interactive website lets users explore how parameter changes affect epidemic trajectories in real-time What we learned: The Fisher-KPP equation captures COVID-19 dynamics surprisingly well with just 3 parameters Hospital beds per capita and case fatality rate are the strongest predictors of spatial diffusion patterns Temporal continuity (lag-1 features) dramatically improves ML prediction of epidemic parameters What's next: Extend to variant-specific parameter tracking (Delta, Omicron) Incorporate real-time mobility data for dynamic D estimation Deploy as an early warning system for emerging outbreaks using only socioeconomic indicators Built with:
Built With
- cuda
- html/css
- javascript
- mathematica
- numpy
- python
- pytorch
- scikit-learn
- scipy
- xgboost

Log in or sign up for Devpost to join the conversation.