-
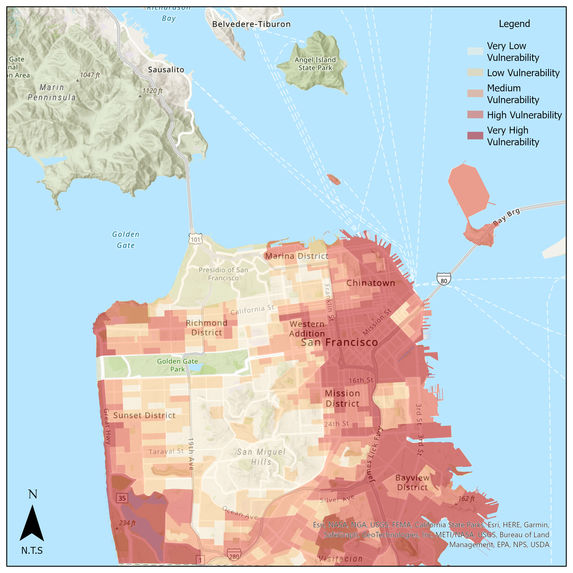
Flood Health Index of census block groups in San Francisco

Inspiration:
As graduate students at UNC, we are interested in using data-driven approaches to solve real-world problems and make an impact on other people’s life.
What it does:
This project aims to identify factors significant impactors to Flood Health Index (FHI) among San Francisco neighborhoods and suggest potential interventions to help the communities that are highly vulnerable to flooding or its related health outcomes.
How we built it:
The team first cleaned the data in Python, then reviewed the descriptive statistics of each variable to learn the distribution and variance of the dataset. After that, several machine learning models were fitted in Python to analyze the importance of features in the Flood Health Index. Housing equity and healthcare accessibility were identified as the targets for recommending mitigation strategies. The team looked for the related public datasets on San Francisco Open Data website and then analyzed the relationship between FHI and housing price, the number of eviction notices, and healthcare facilities. Besides the statistical results from Python, we also visualized our findings in ArcGIS to generate a series of maps.
Challenges we ran into:
It took us some time to find the correct map files to merge with the raw dataset because the census block group division of San Francisco changes every year.
Accomplishments that we're proud of:
Within 24 hours, we were able to create 5 maps and run multiple machine-learning models.
What we learned:
Bugs that didn't kill us made us more persistent.
Limitation and Next Steps:
As a quick-pace project, some of the statistical models in the analysis were conducted with many assumptions. The team would read more literature to refine the research design, tune machine learning models to improve their robustness, and also use real flood hazard data to verify the creditability of the Flood Health Index.


Log in or sign up for Devpost to join the conversation.