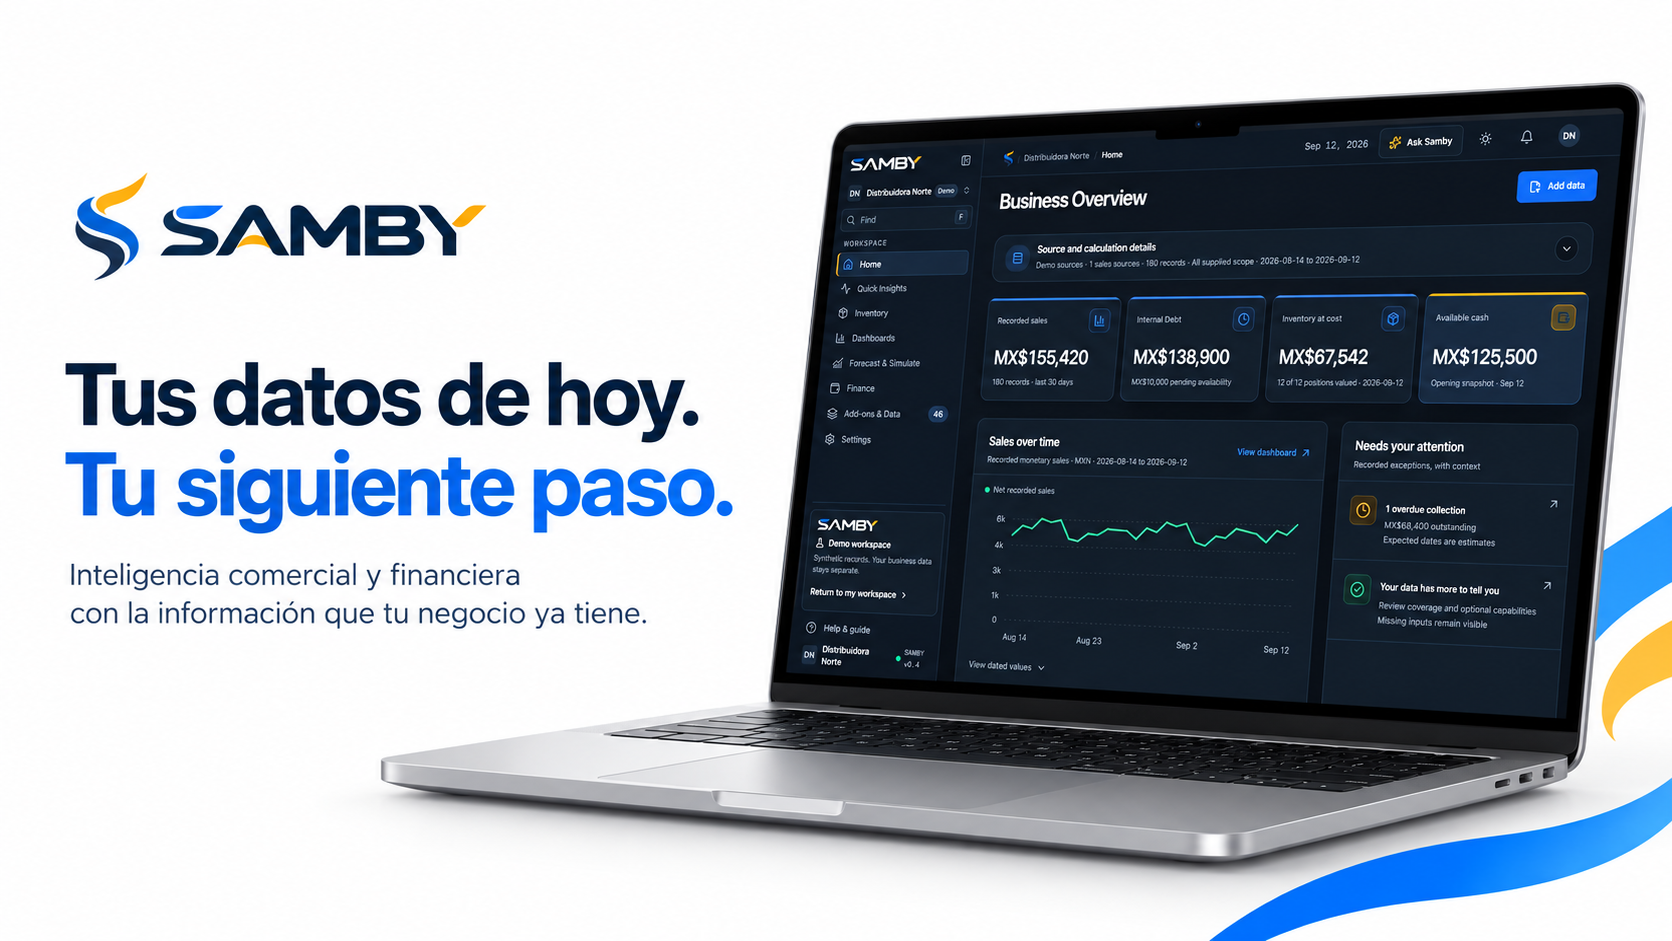
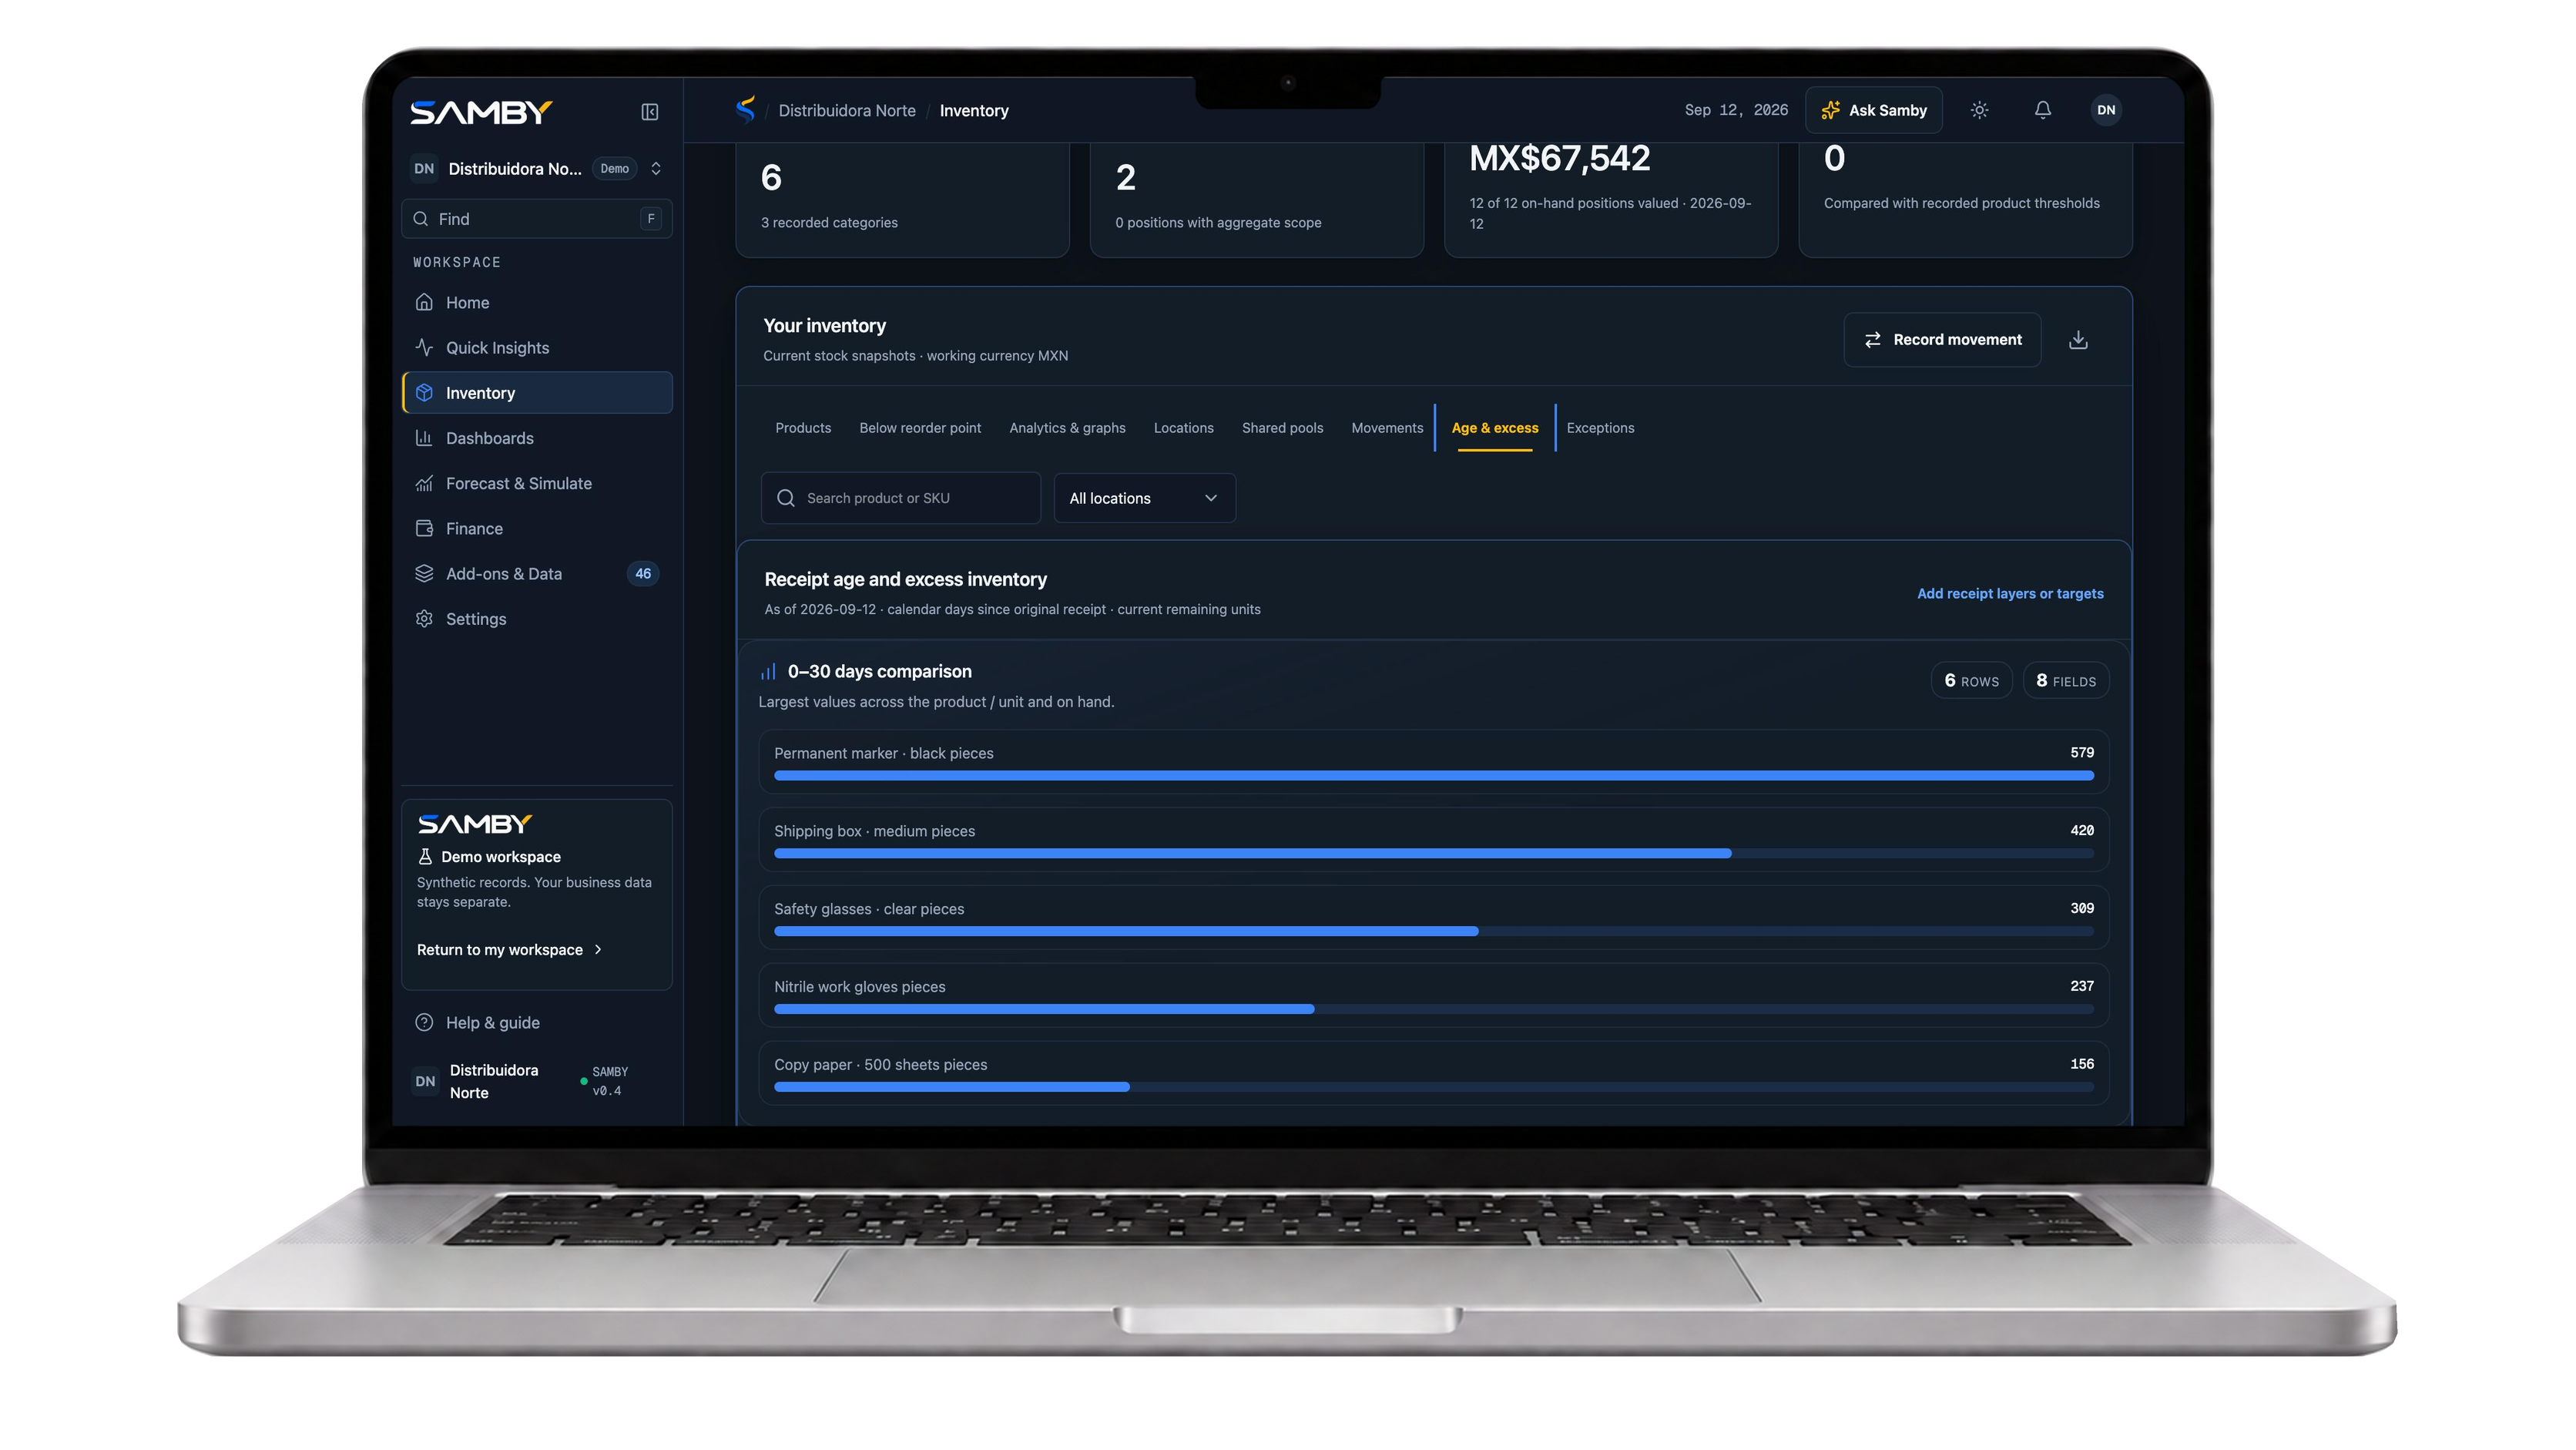
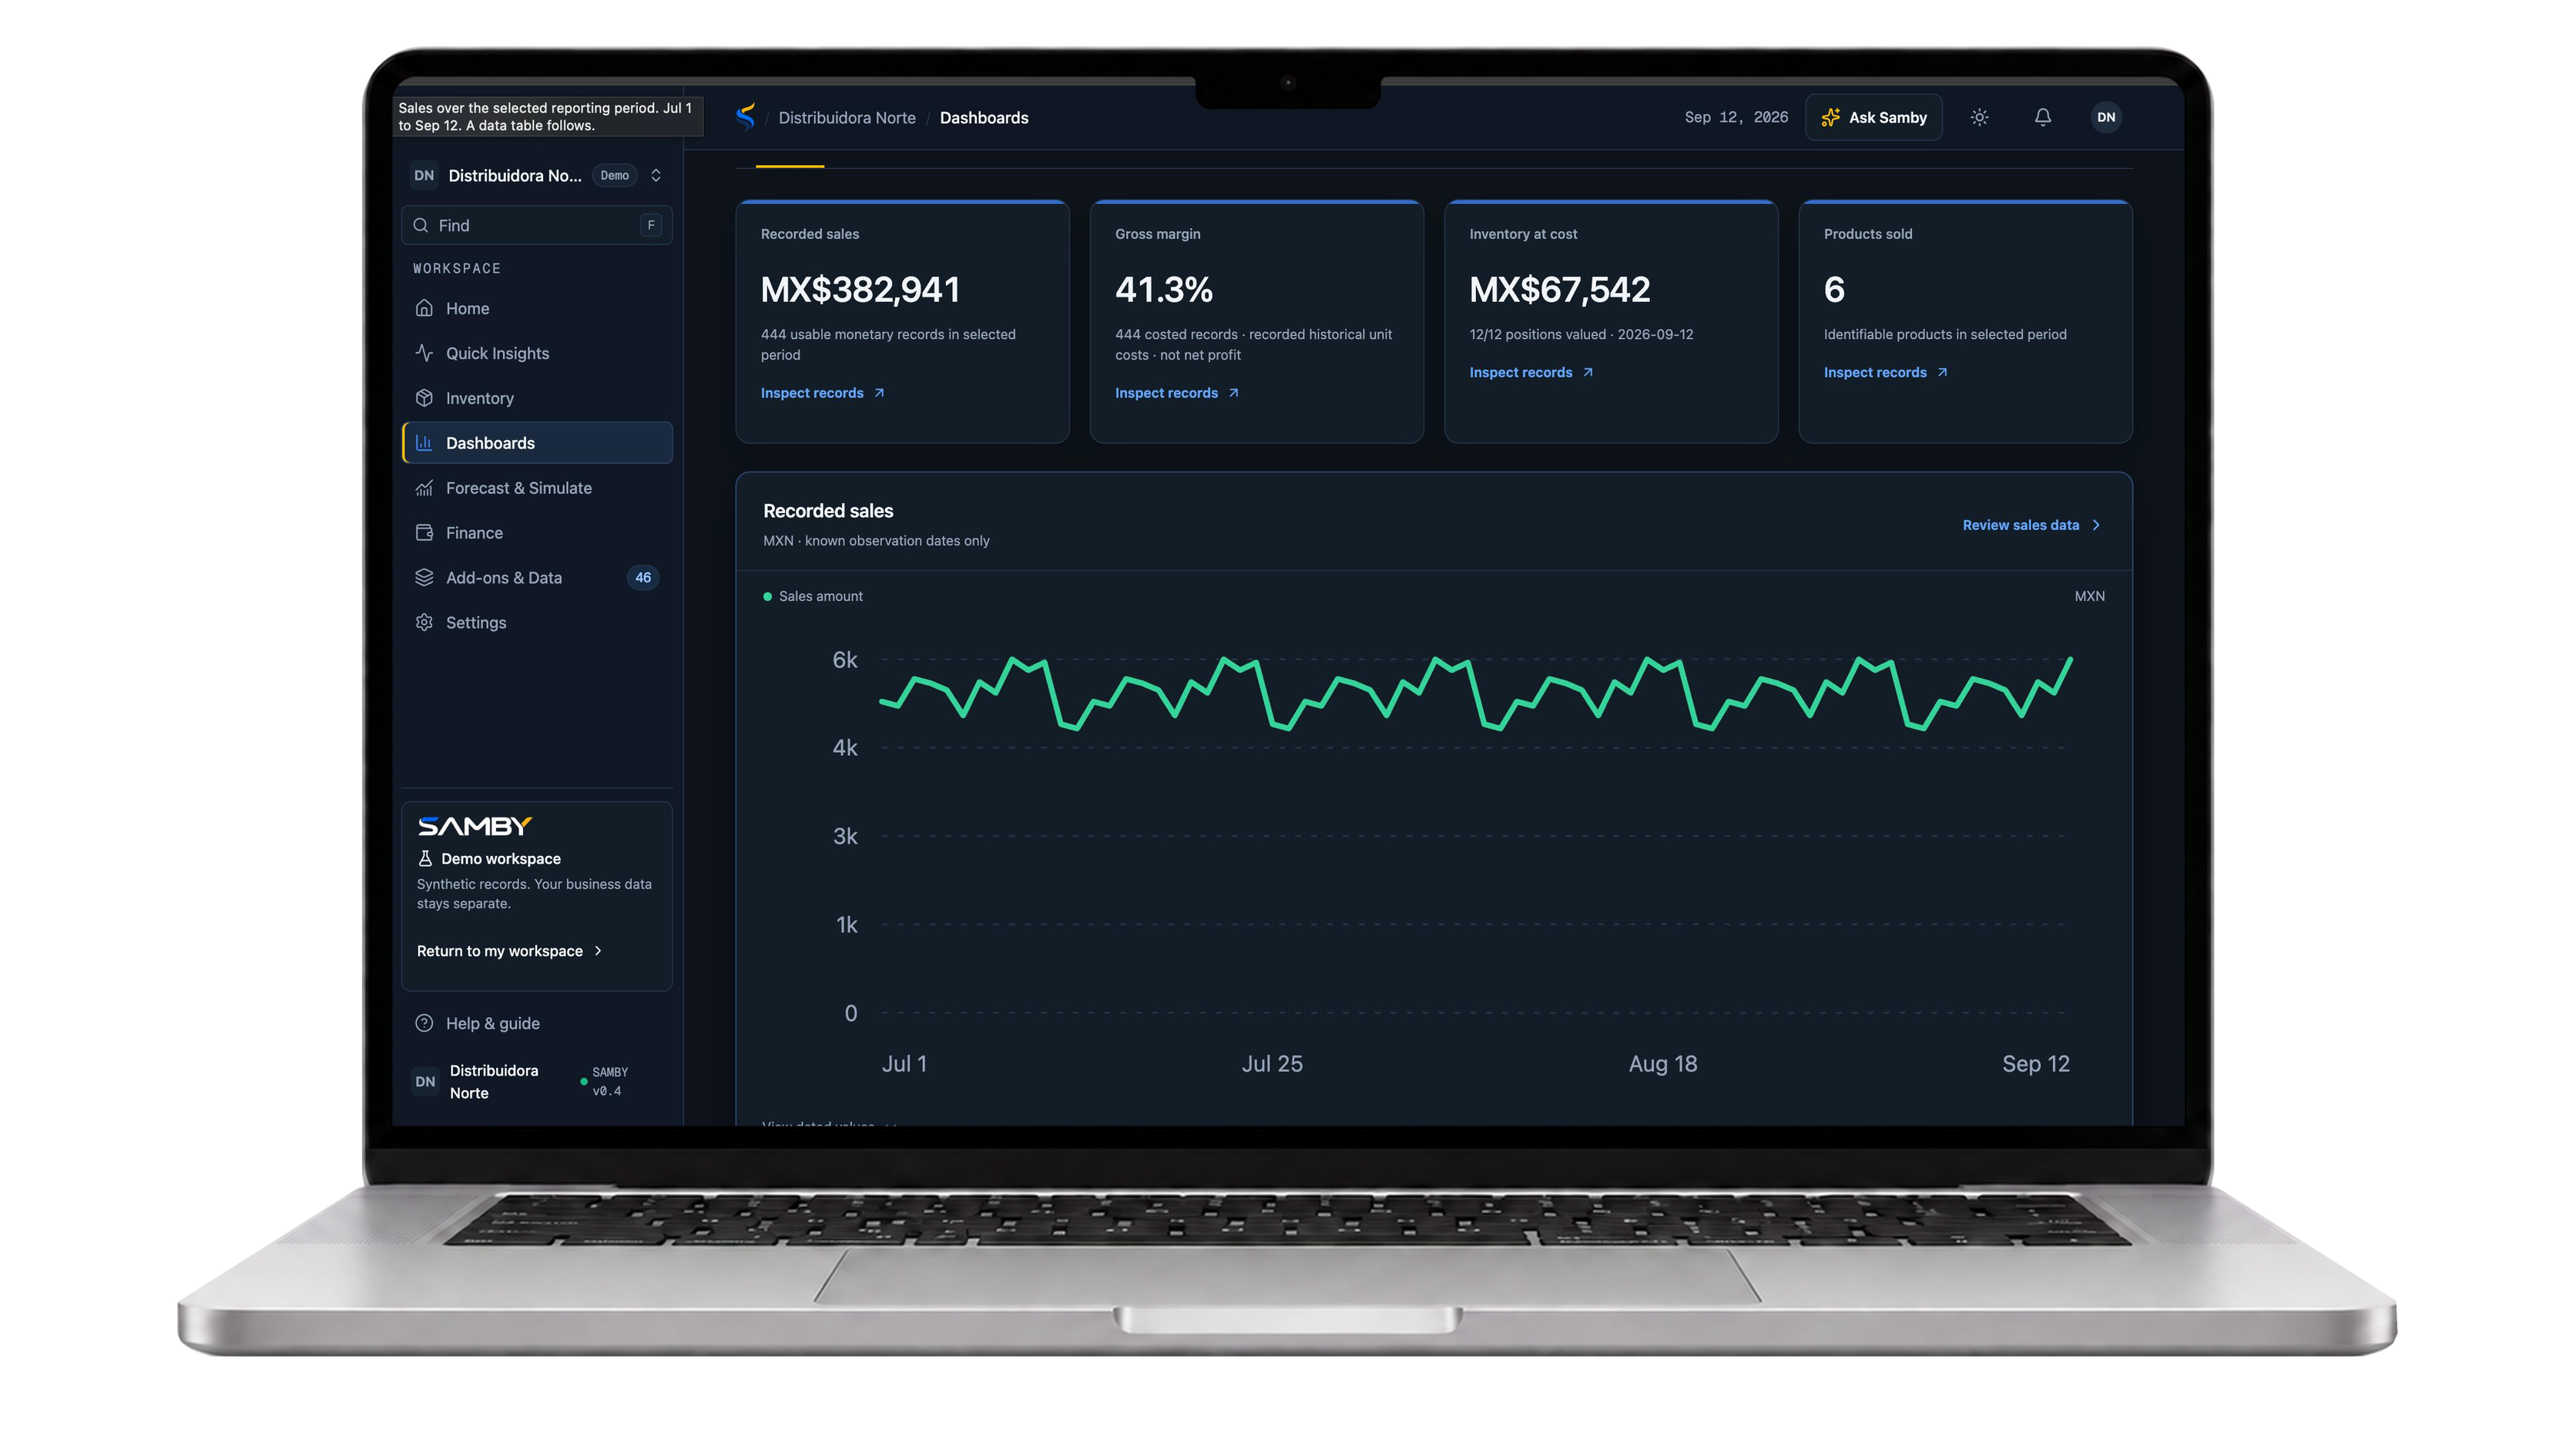
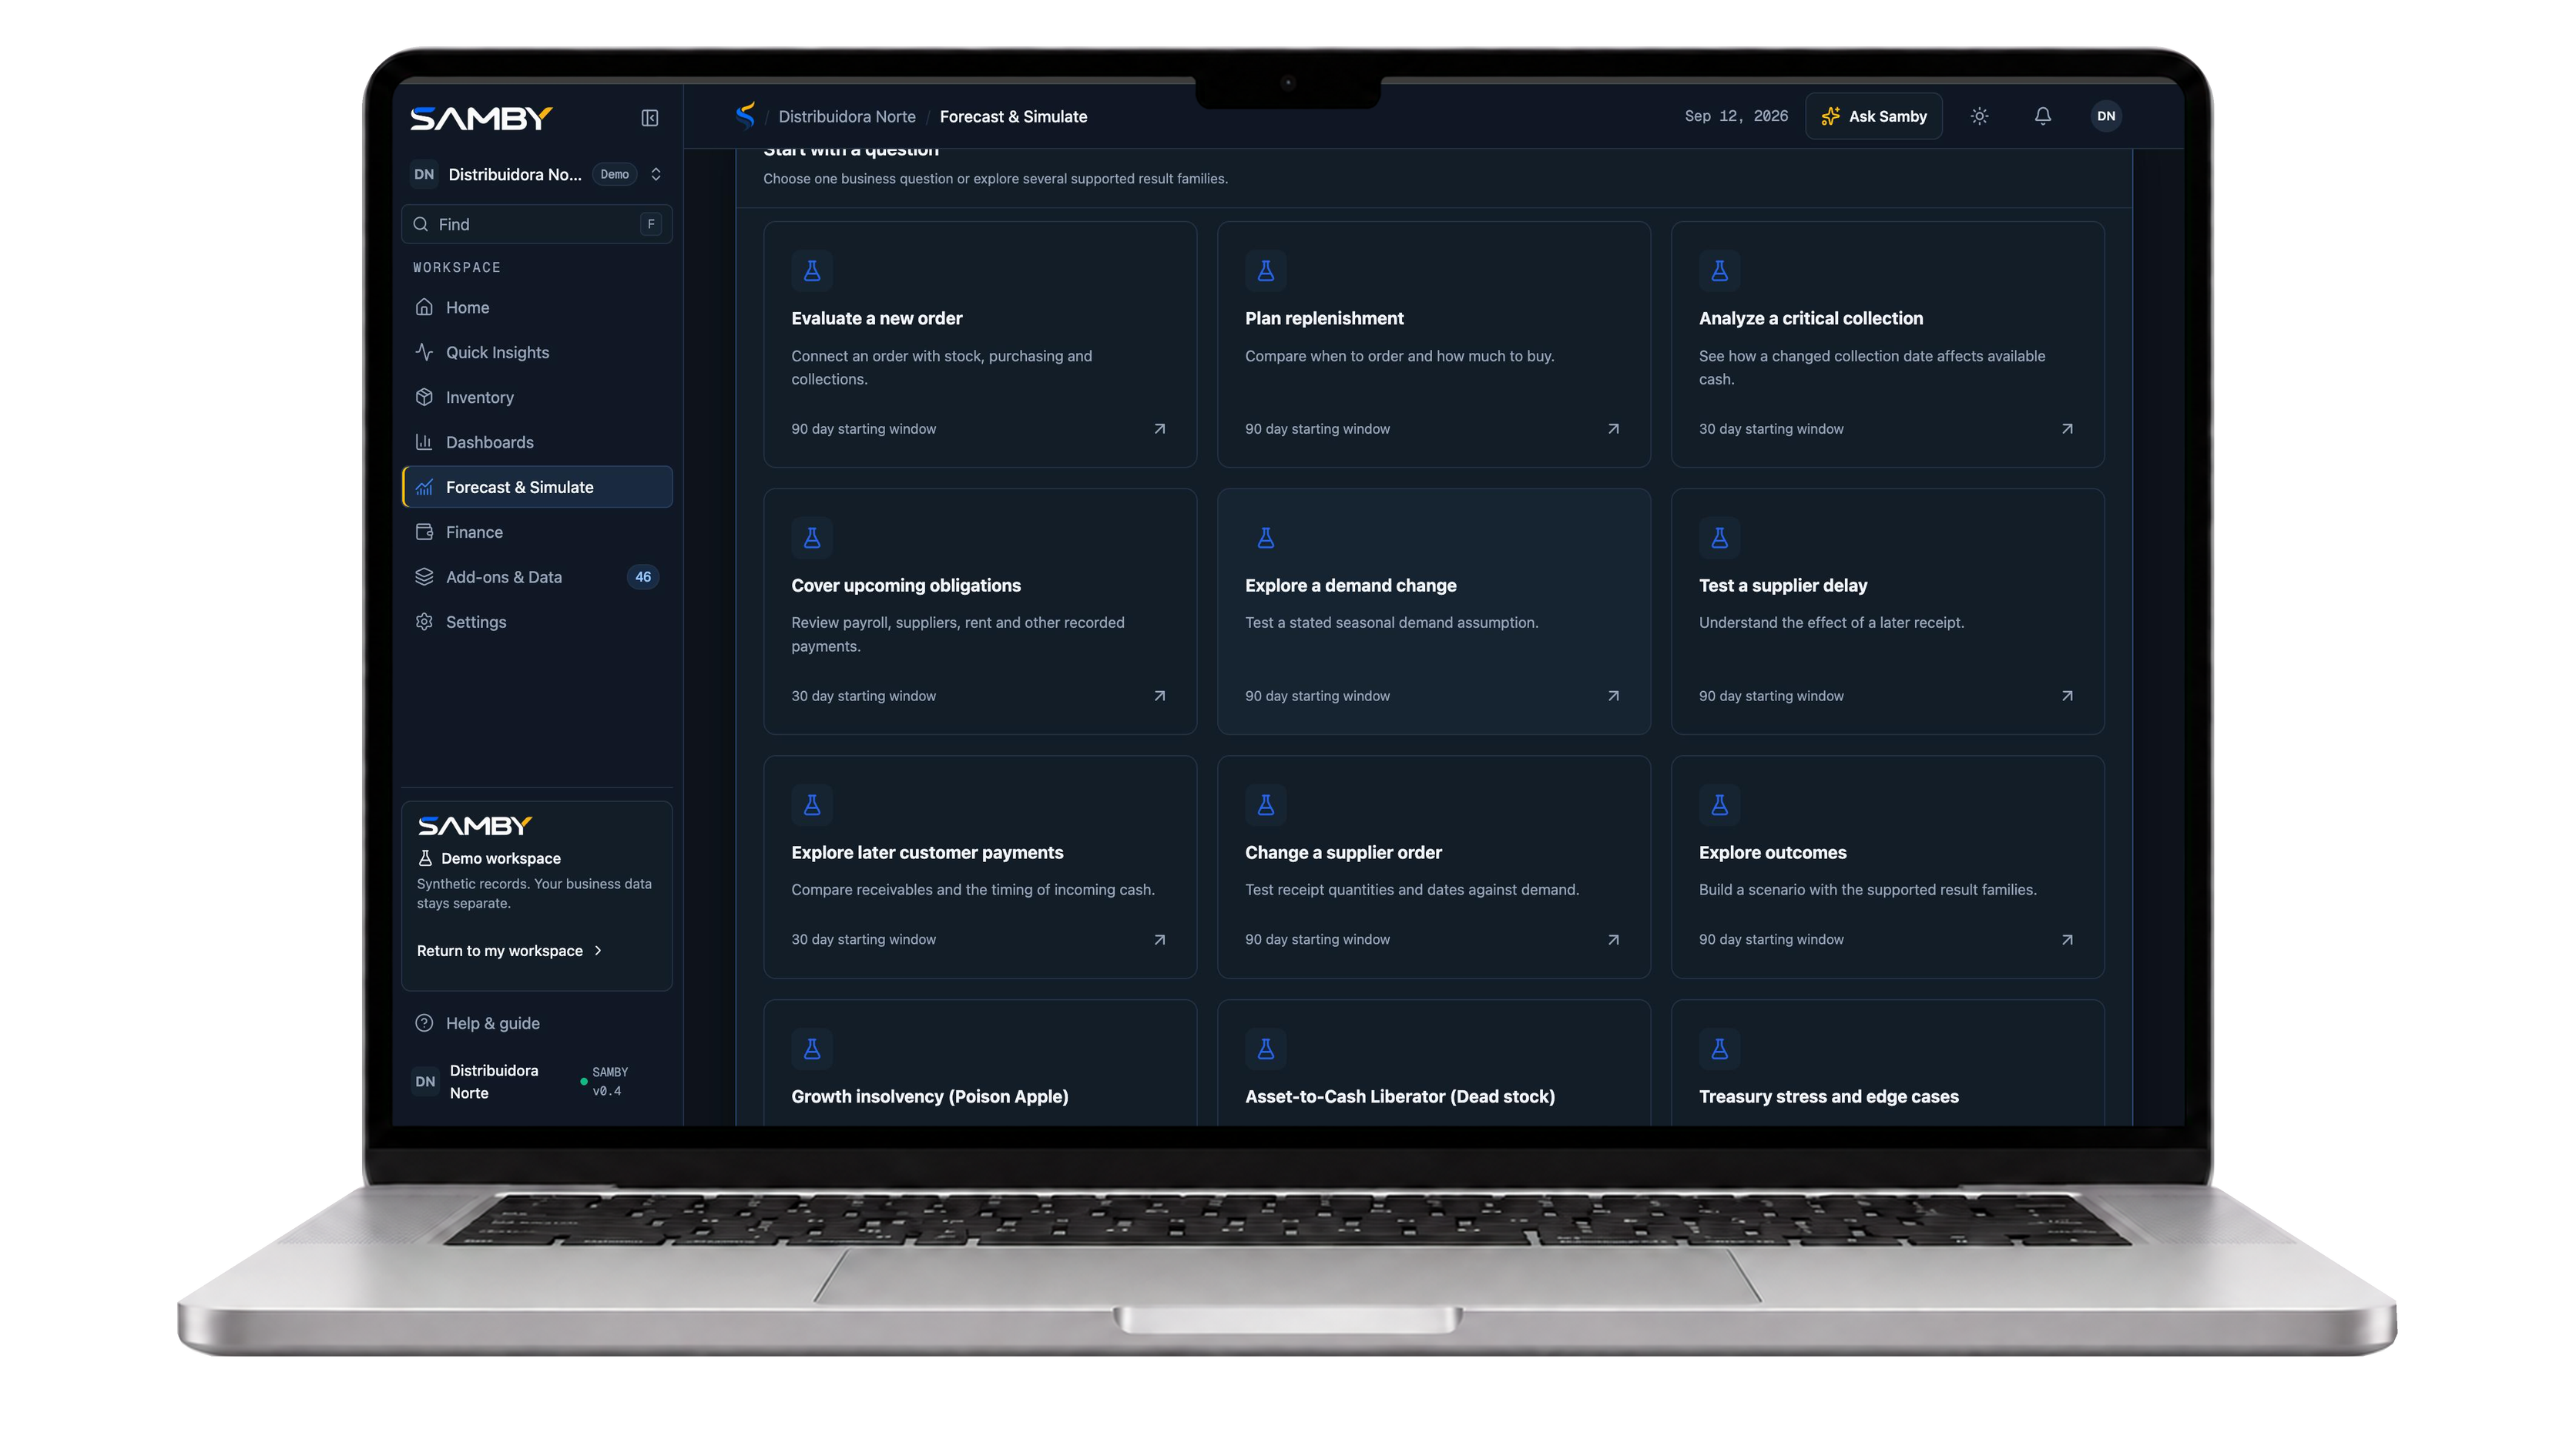
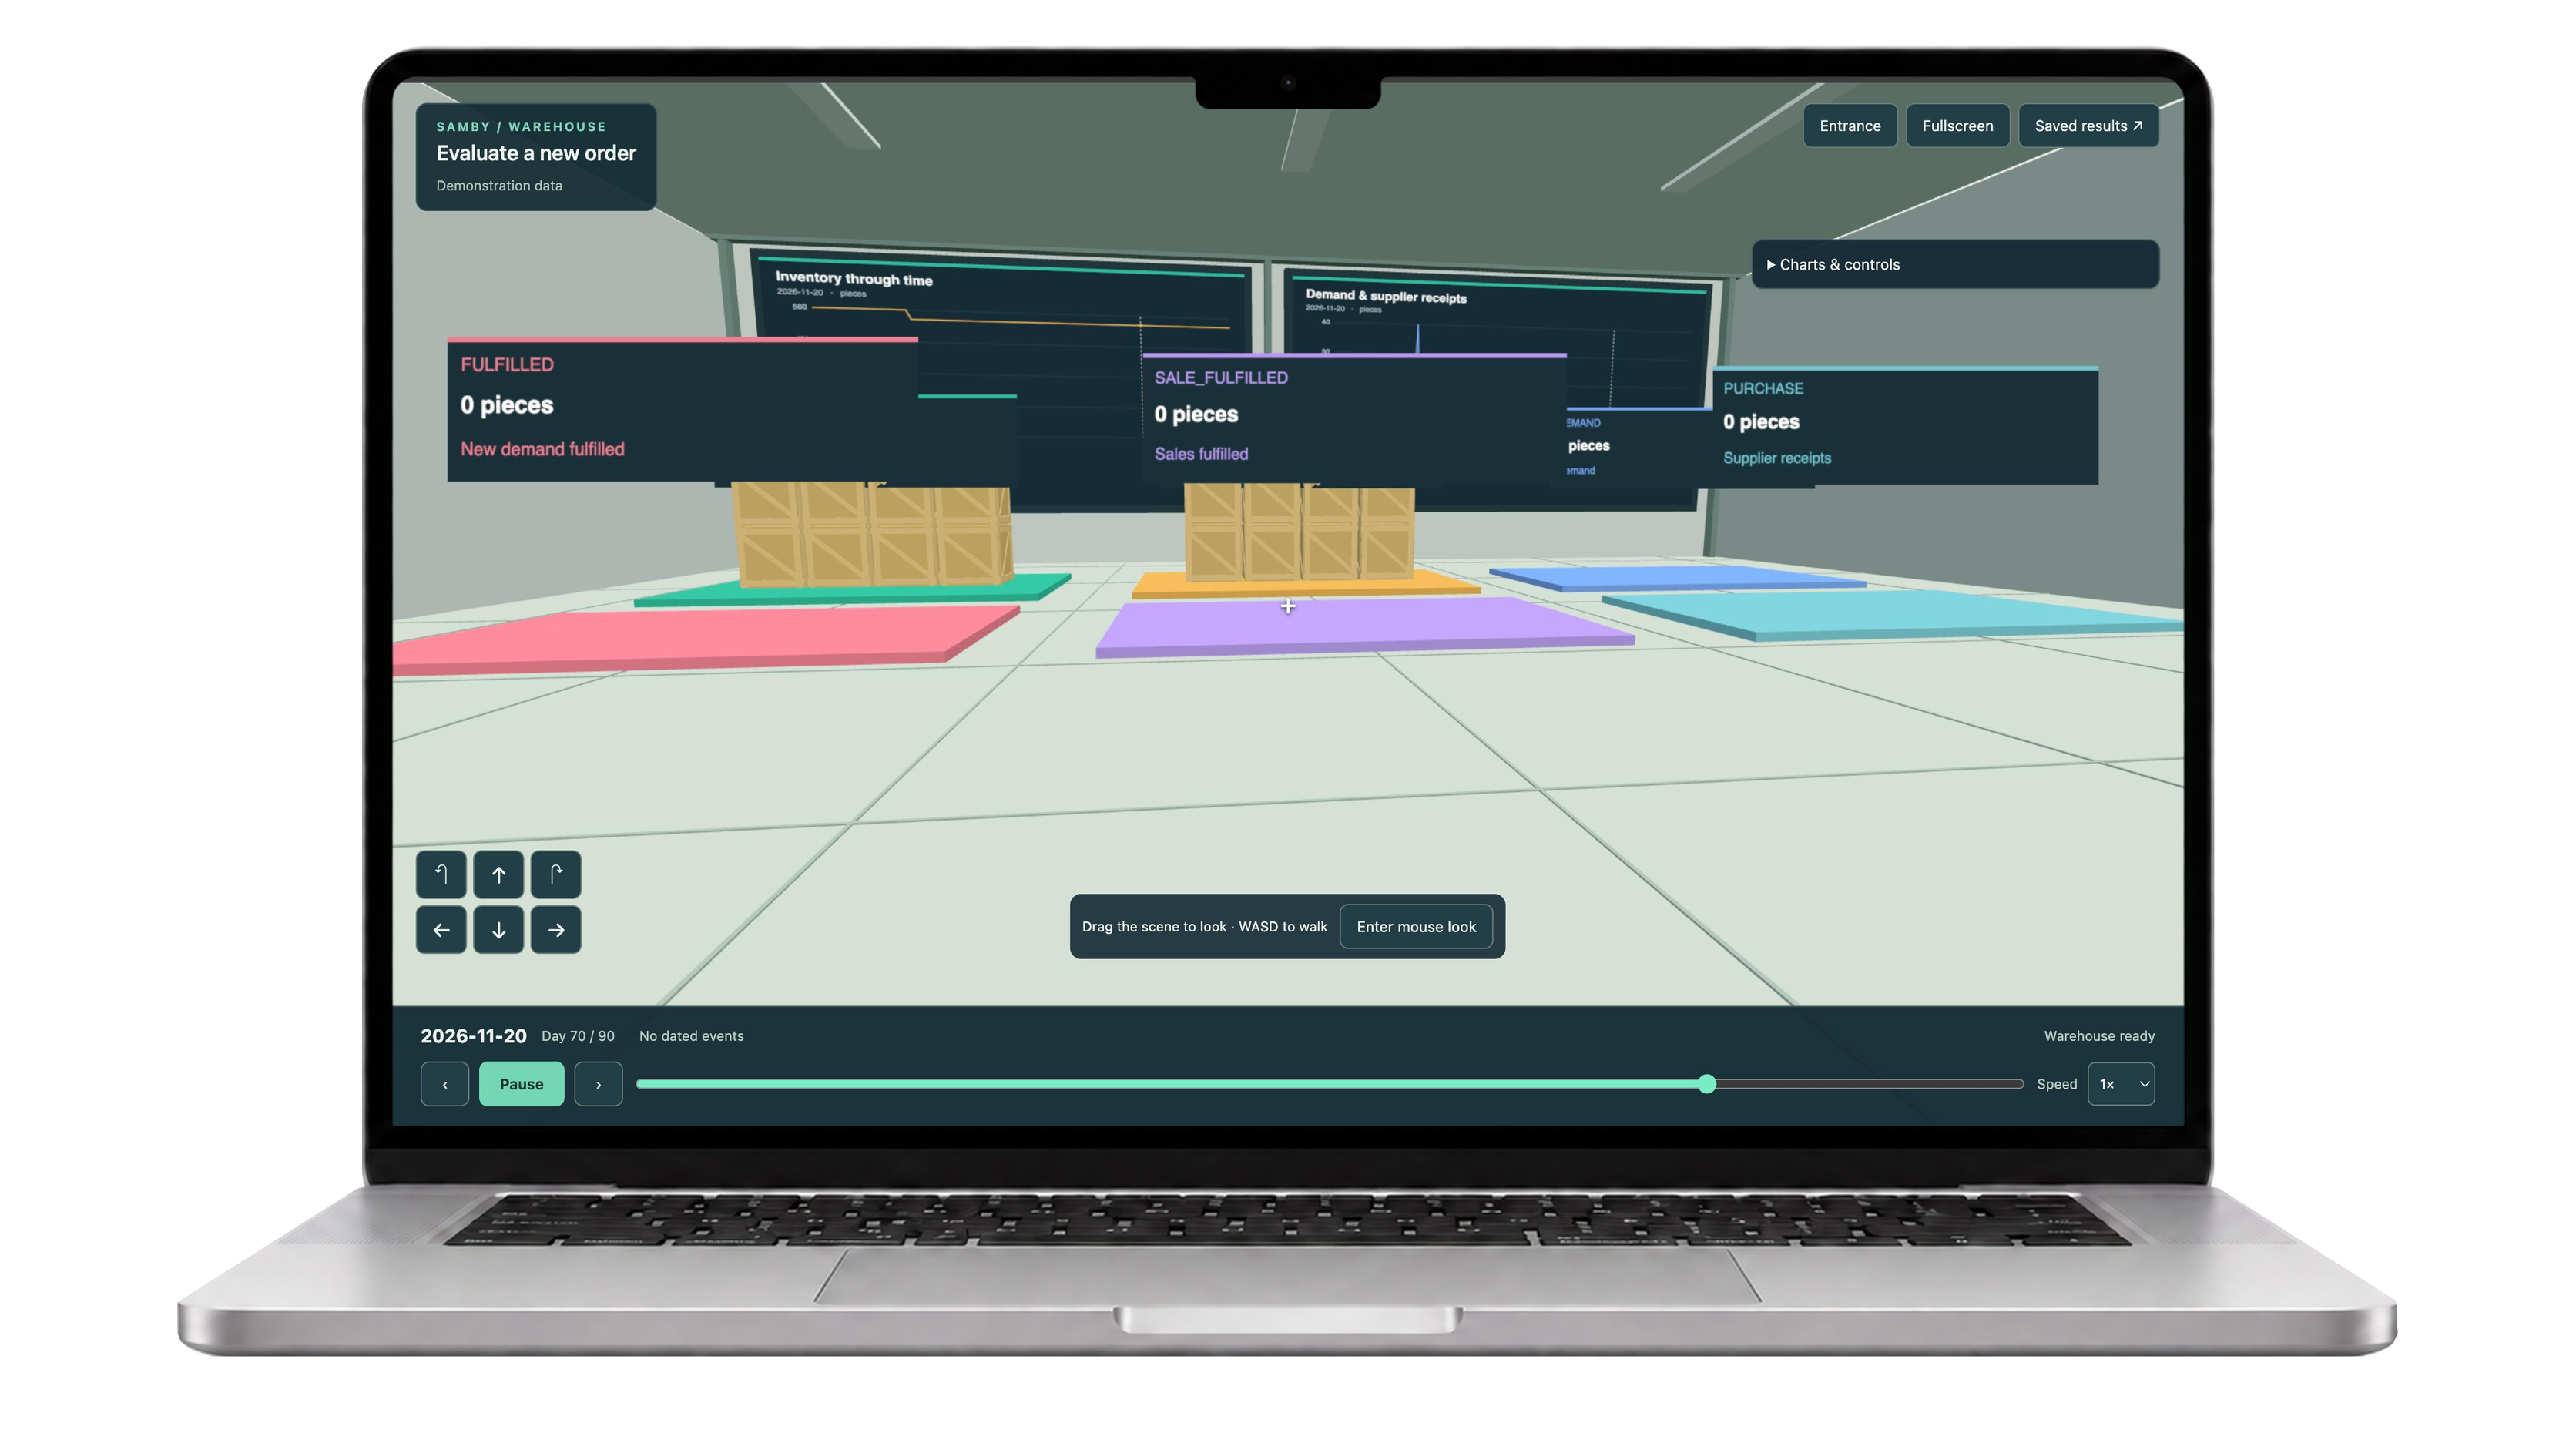
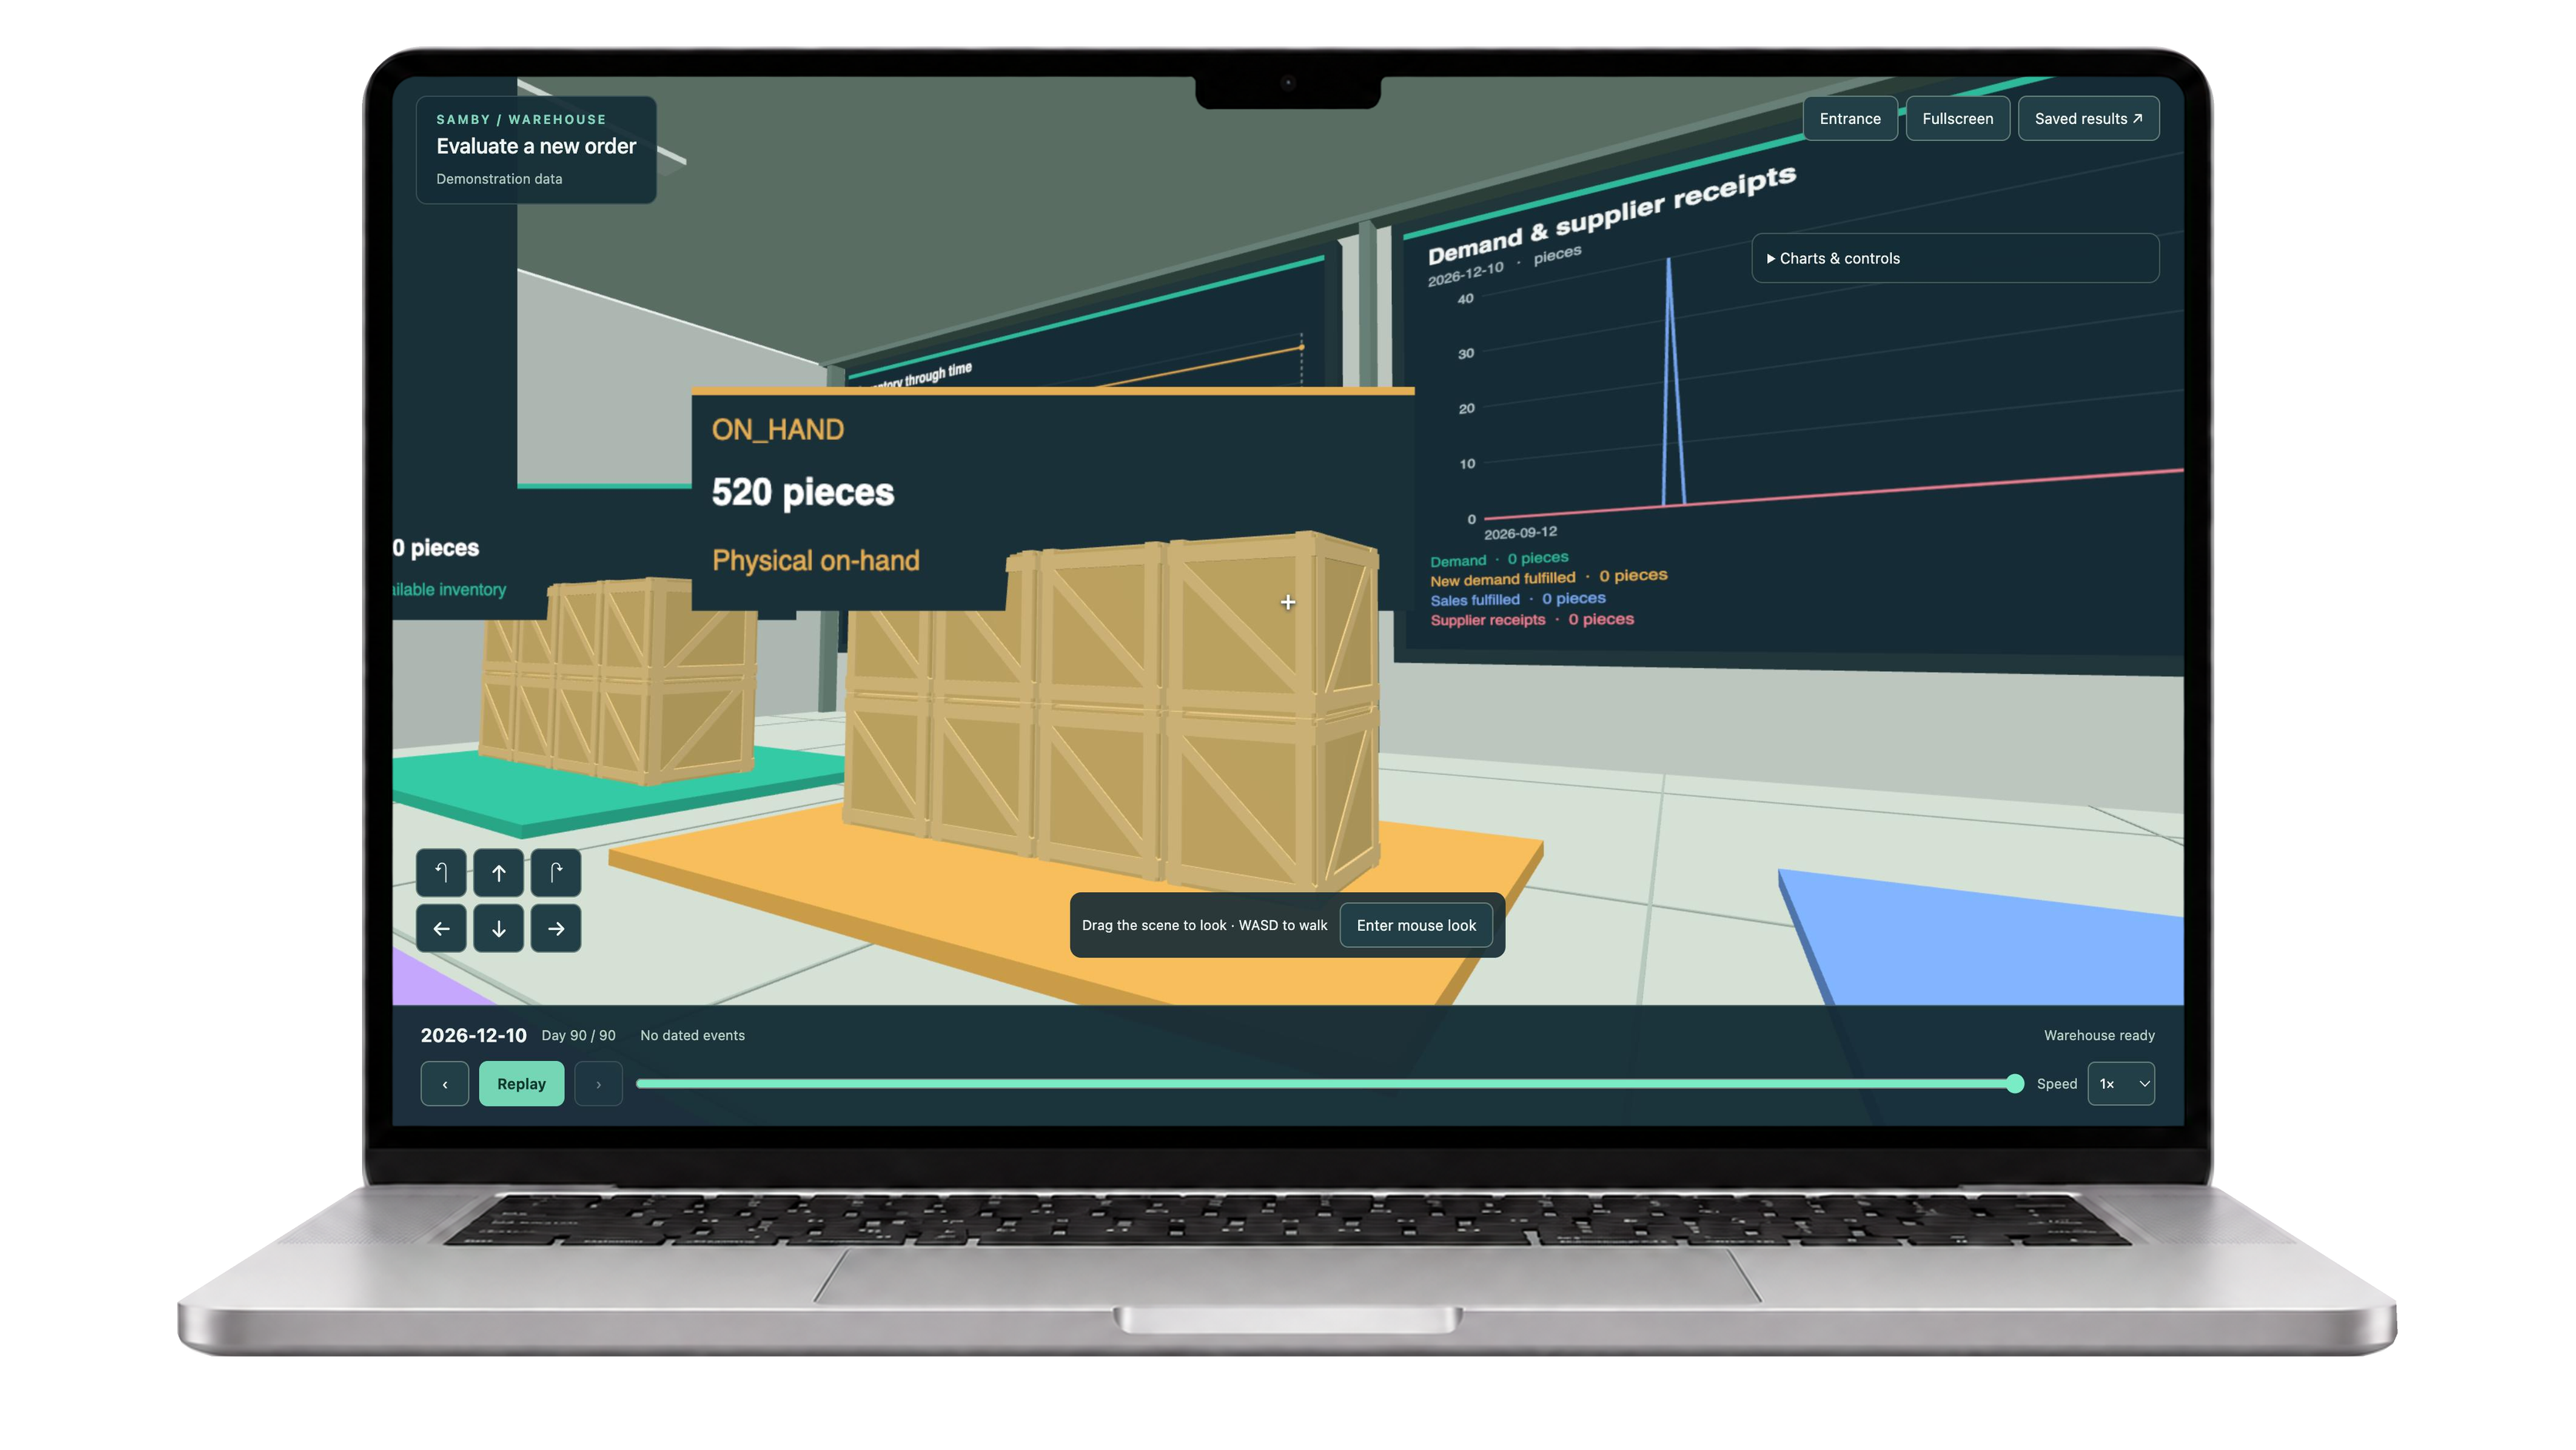
Inspiration Small business owners make critical decisions every day: what to buy, when to restock, and whether they have enough cash to cover upcoming payments. The information they need often lives in separate spreadsheets, sales records, and inventory lists. We built Samby around a simple idea: business intelligence should begin with the information a business already has. We wanted to help owners understand their situation and evaluate their next move without needing to become data analysts. What it does Samby turns business data into a connected view of sales, inventory, and finances.
- Guided onboarding helps users import their existing data.
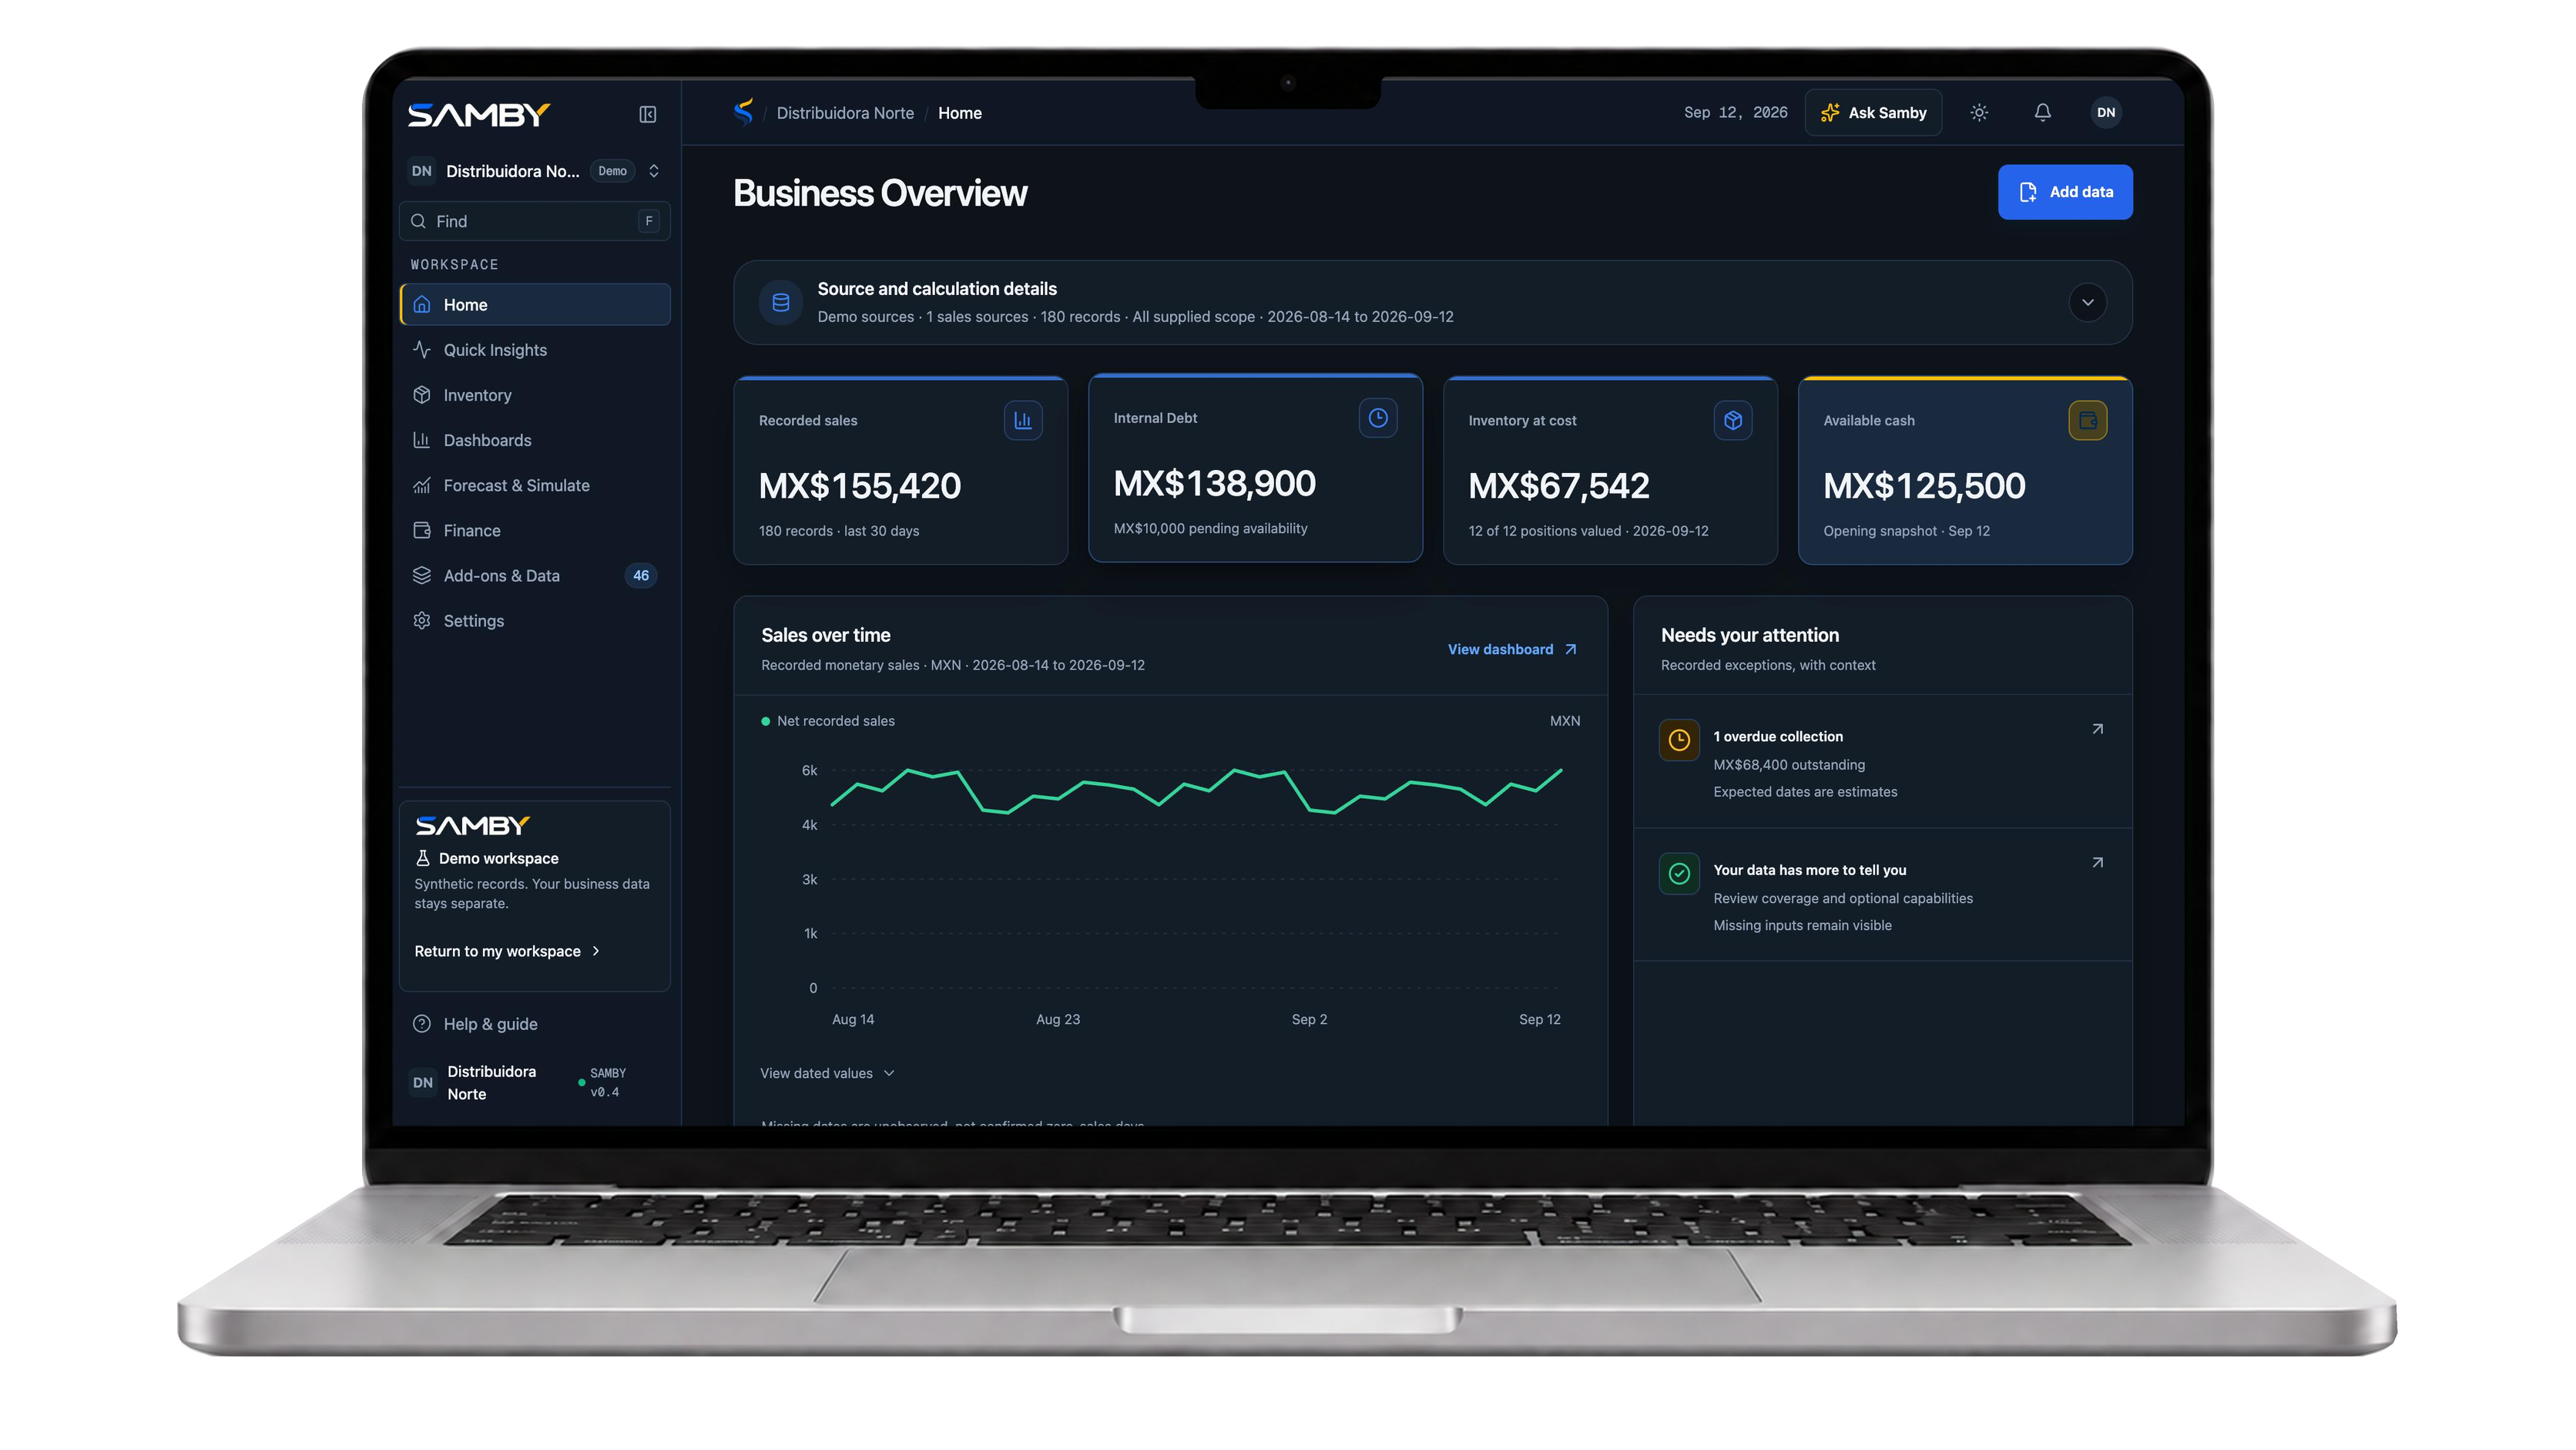
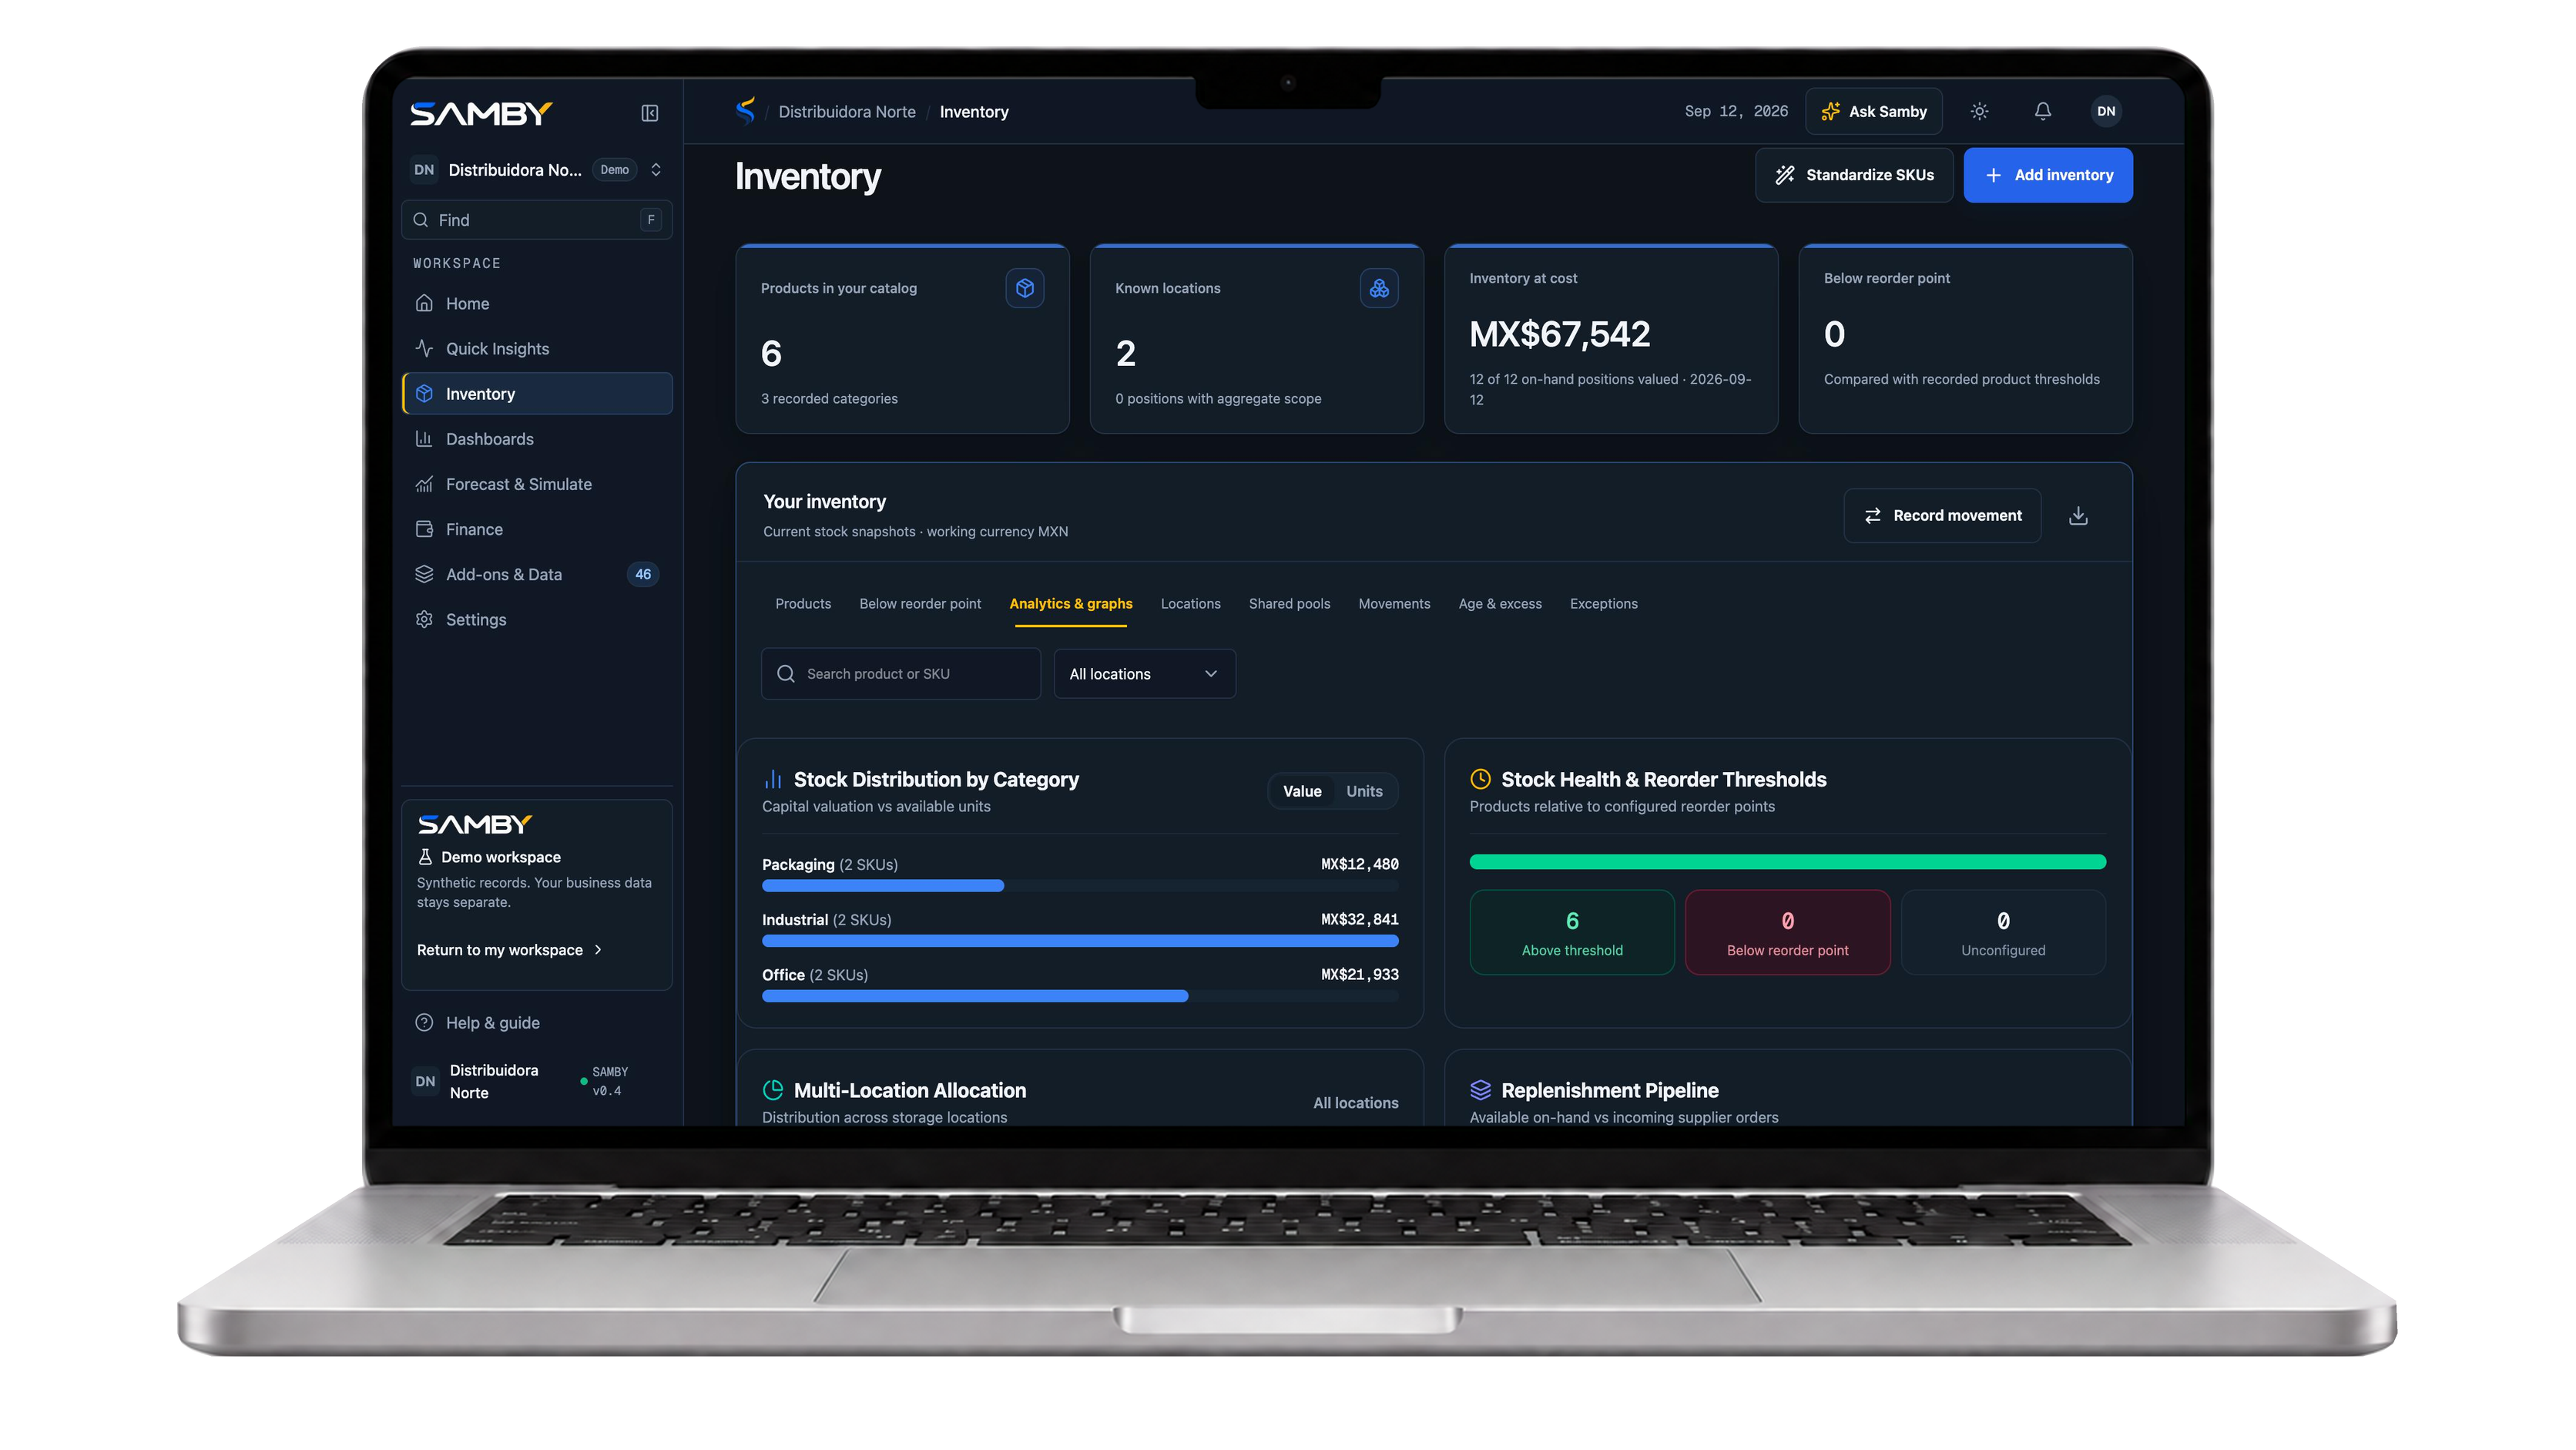
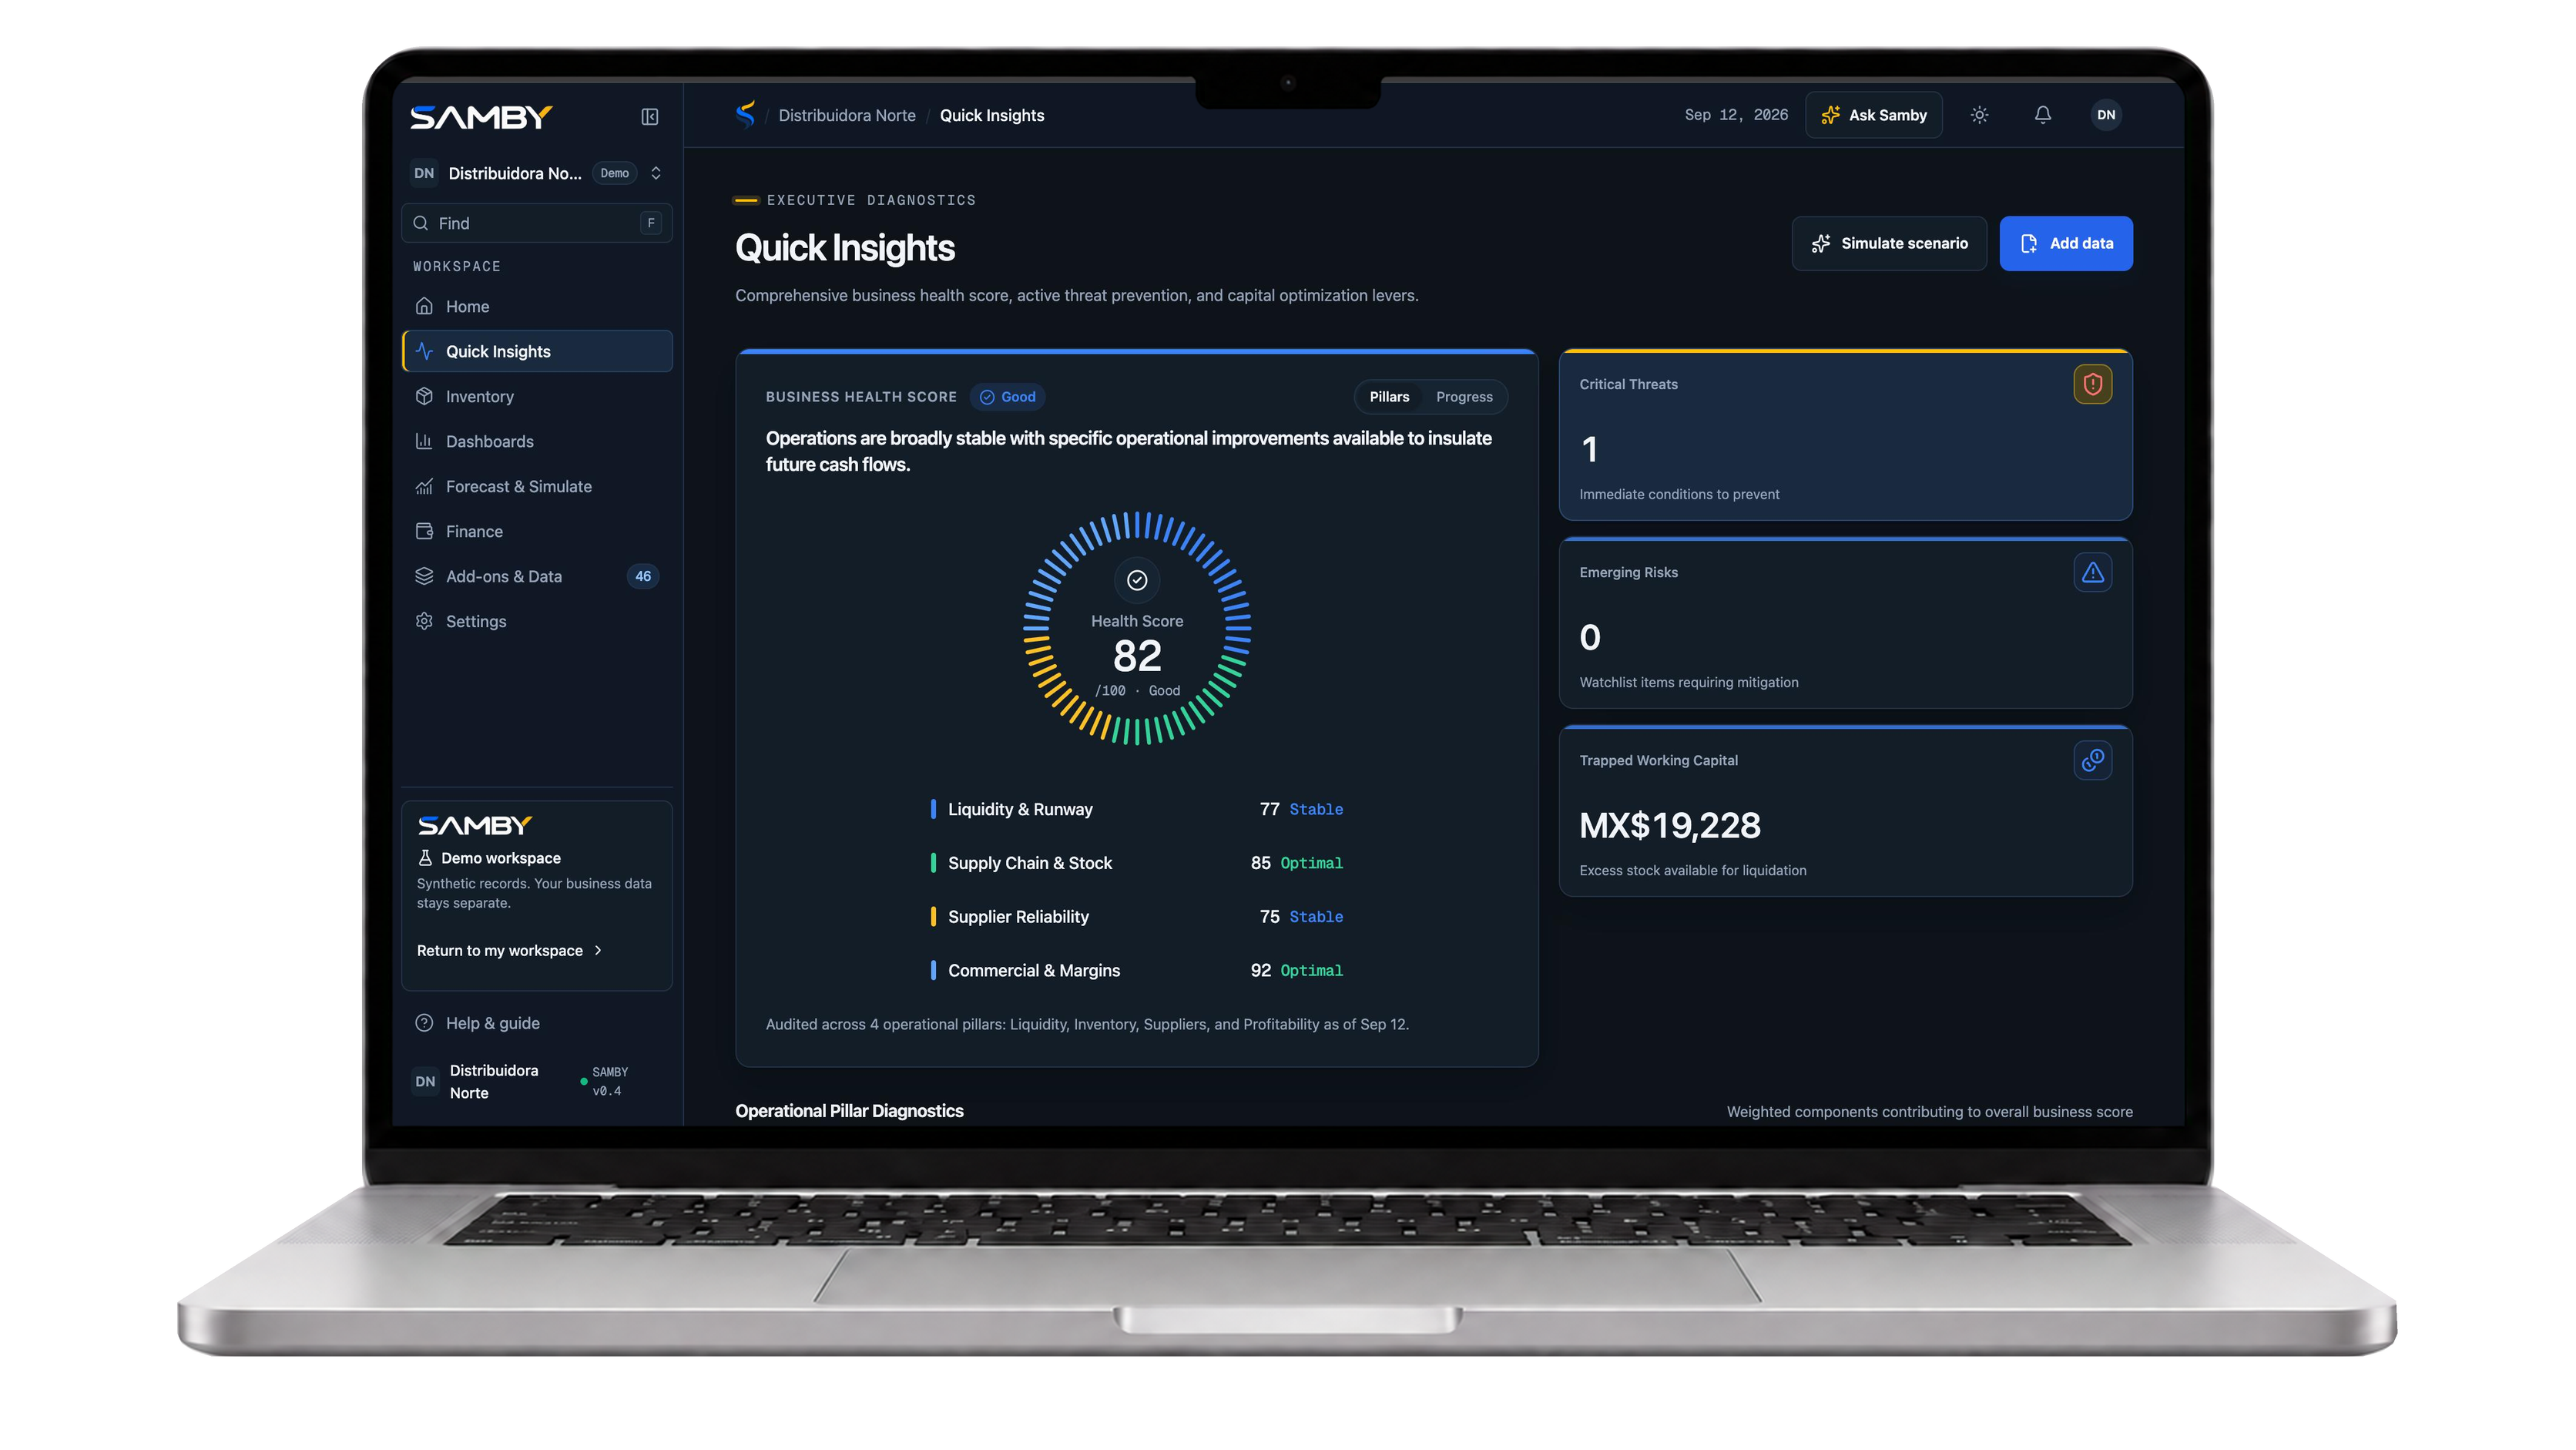
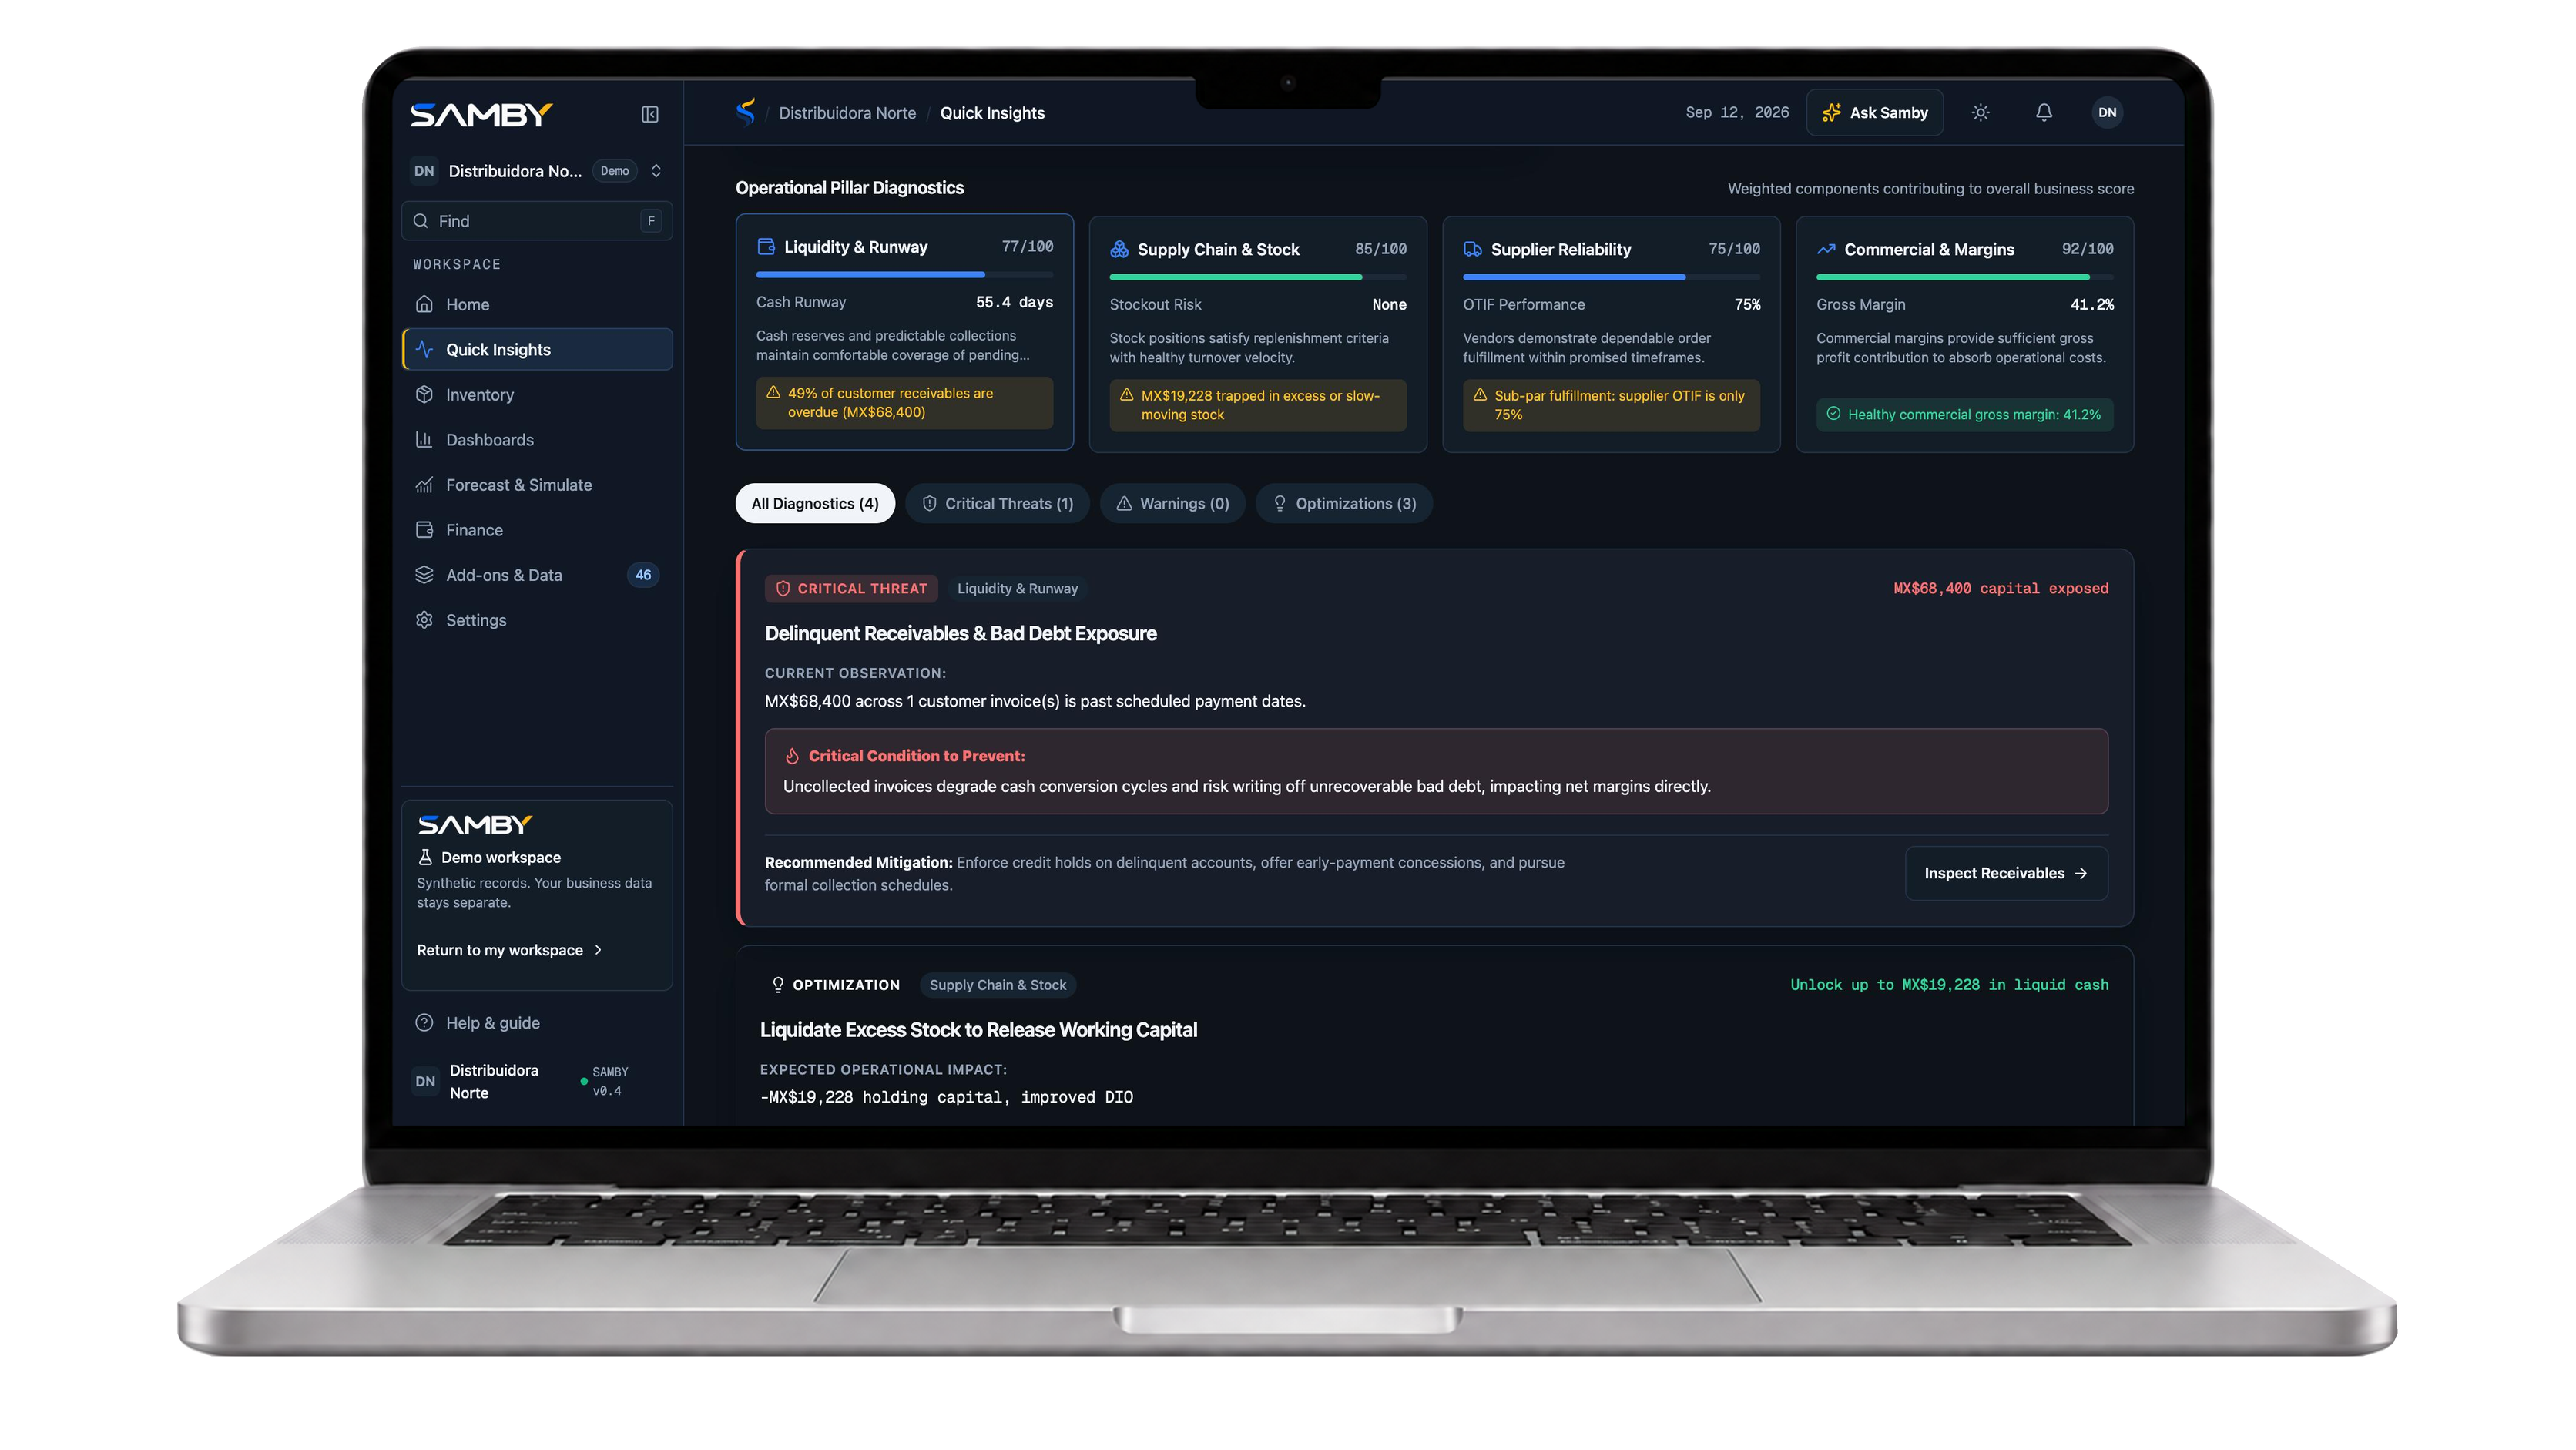
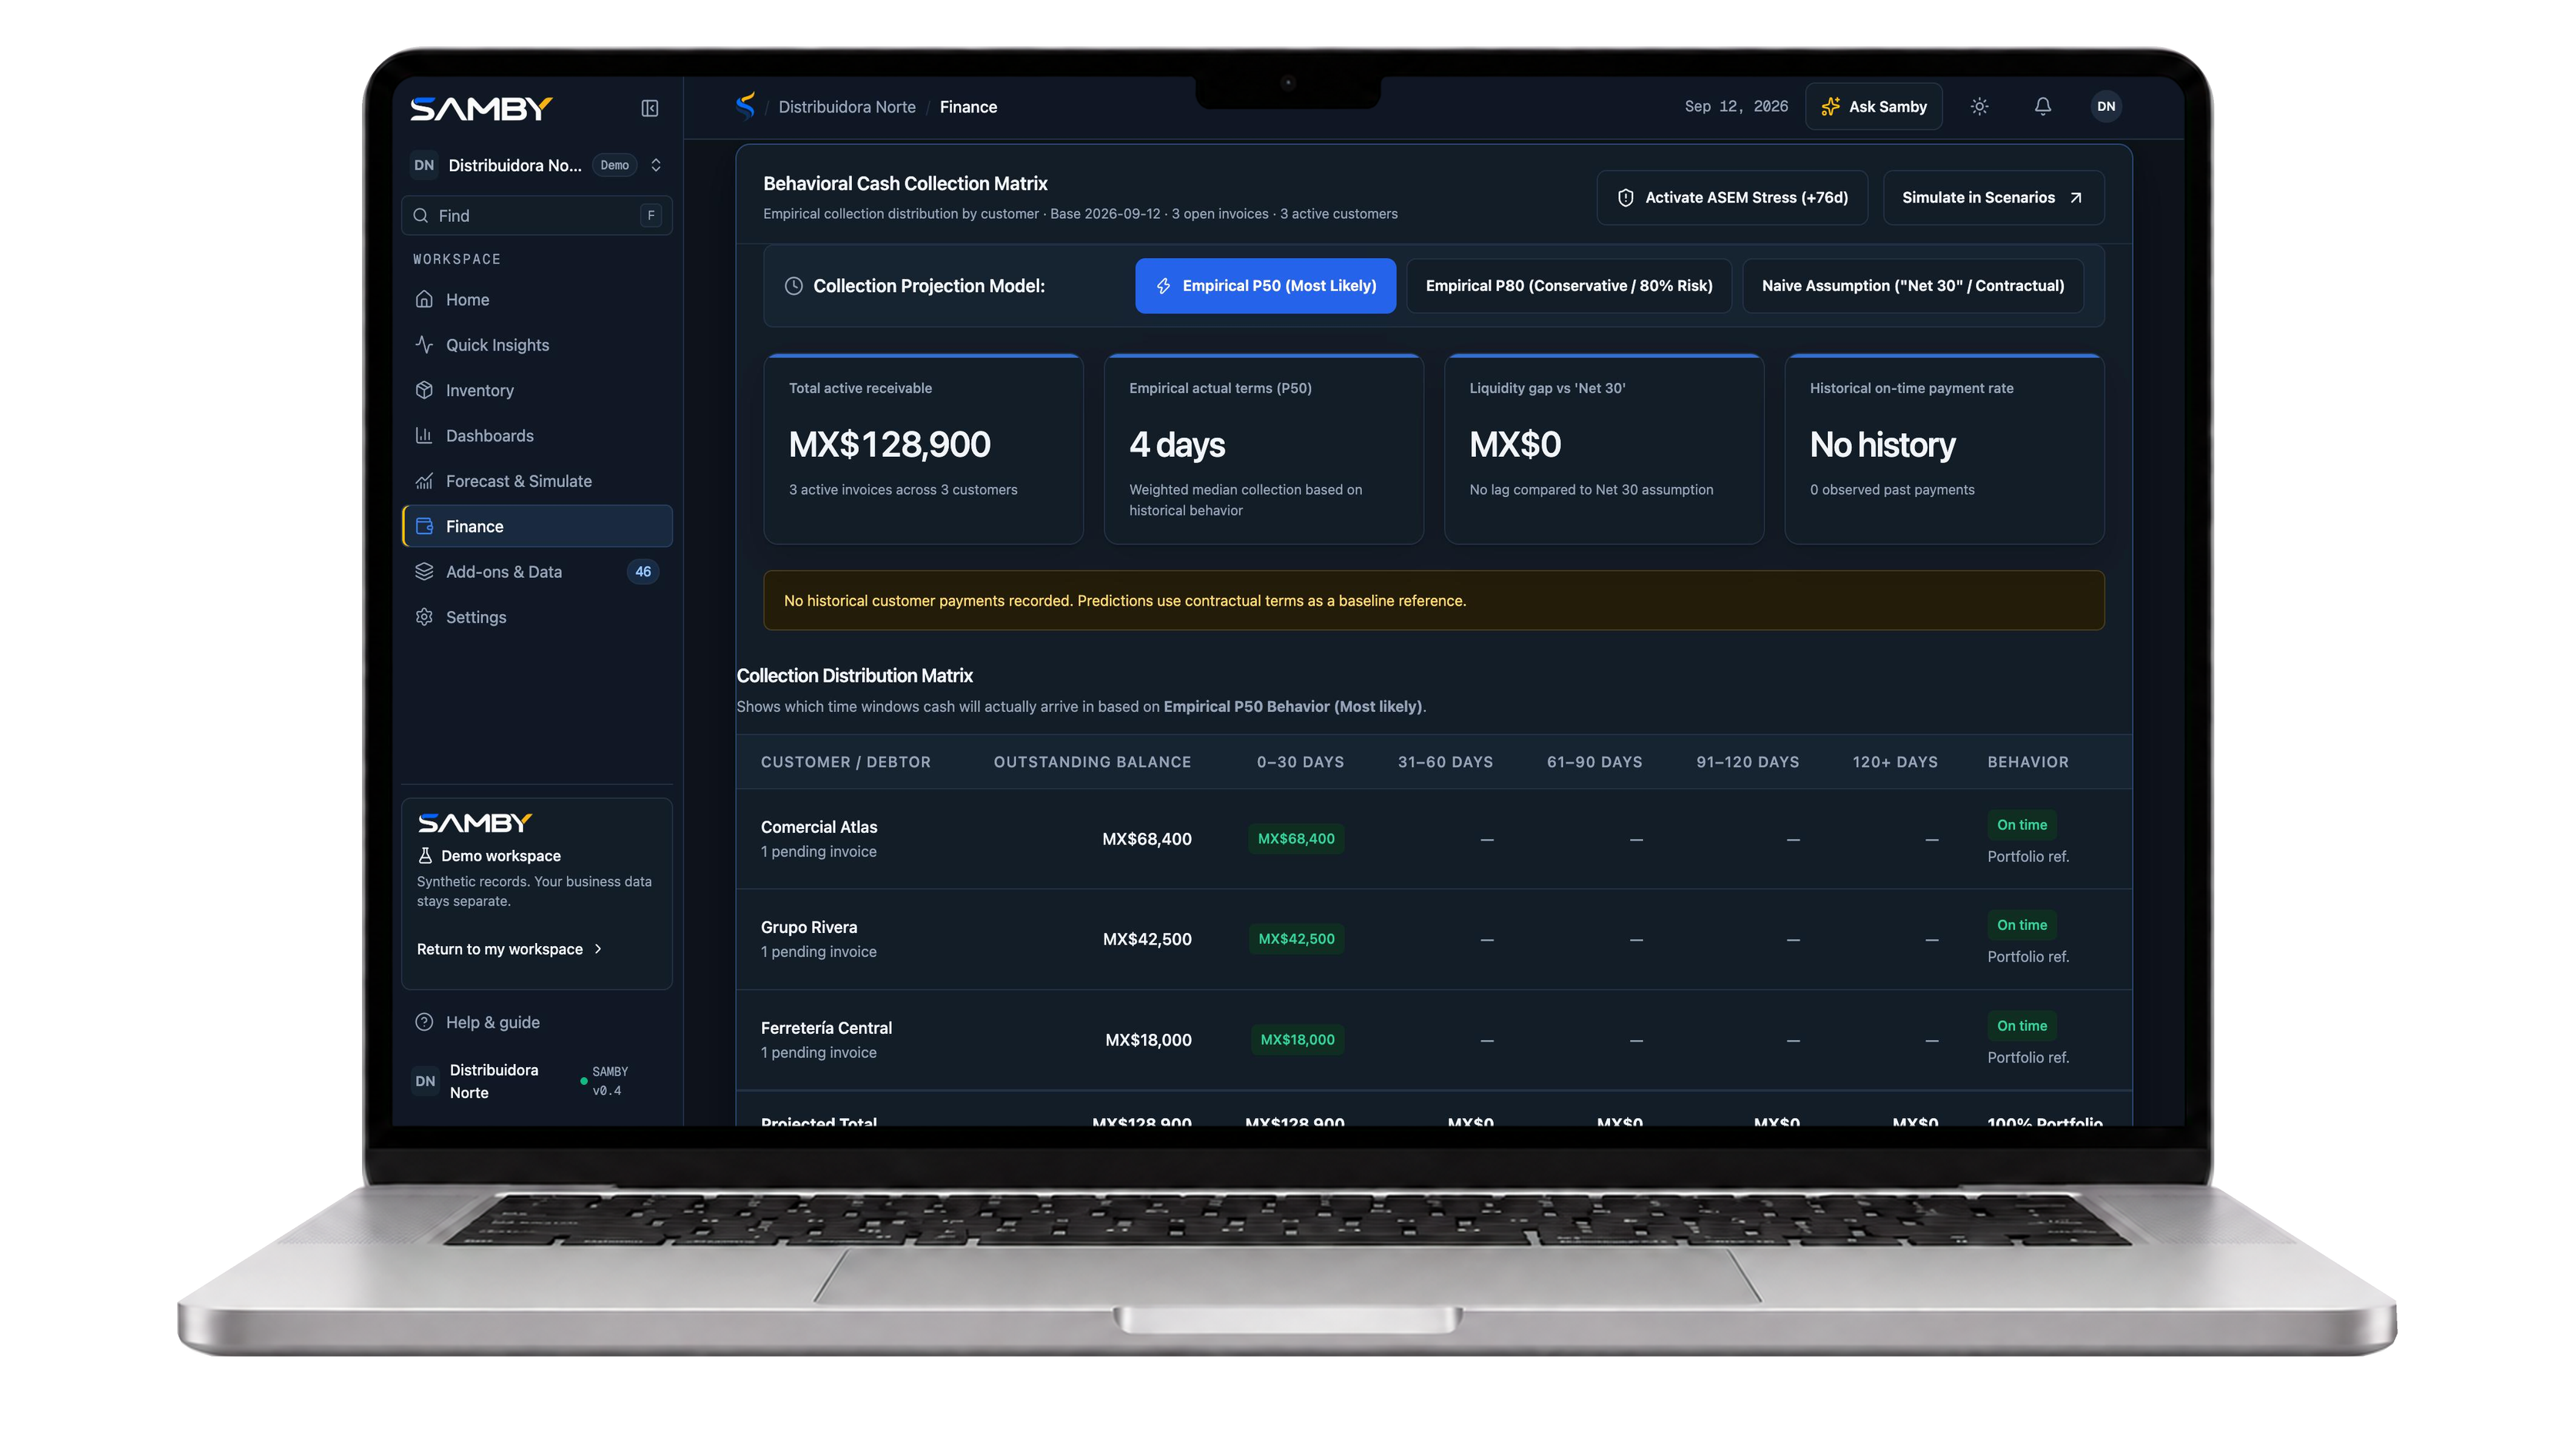
- Dashboards and Quick Insights highlight business performance, overdue collections, inventory risks, and opportunities to release working capital.
- Ask Samby, our AI assistant, lets users ask questions about their business and understand what their dashboards show.
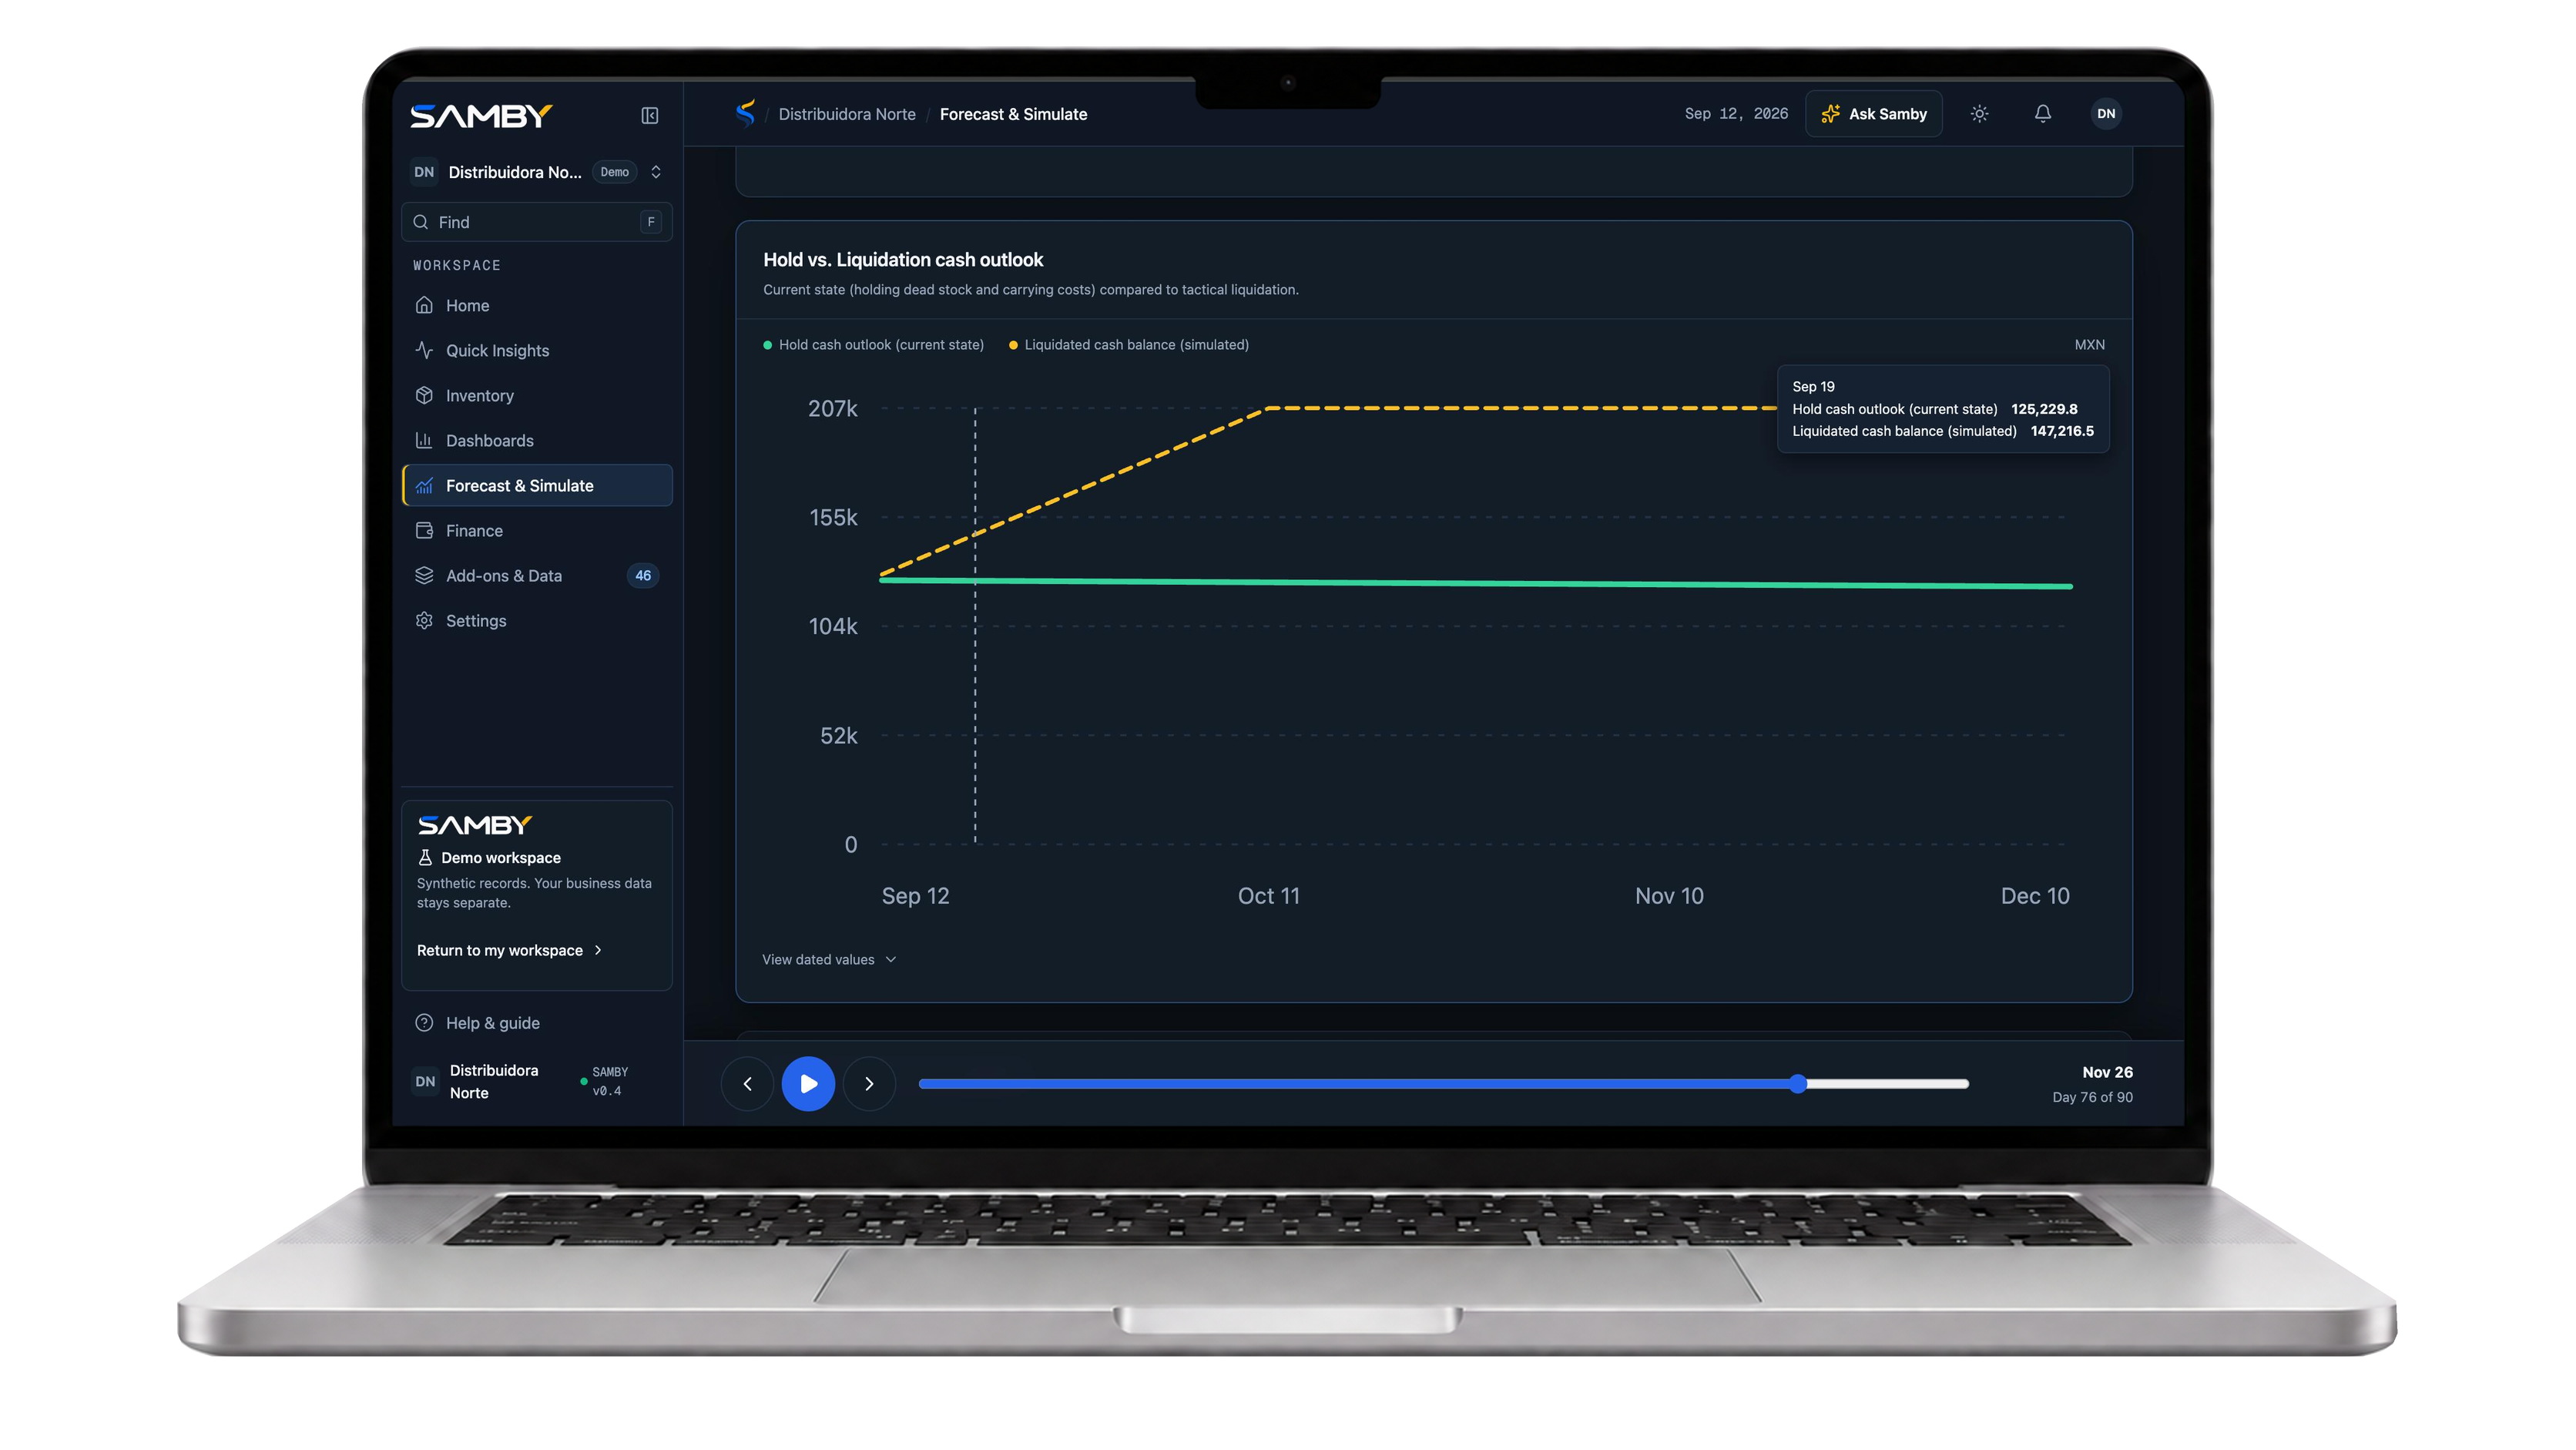
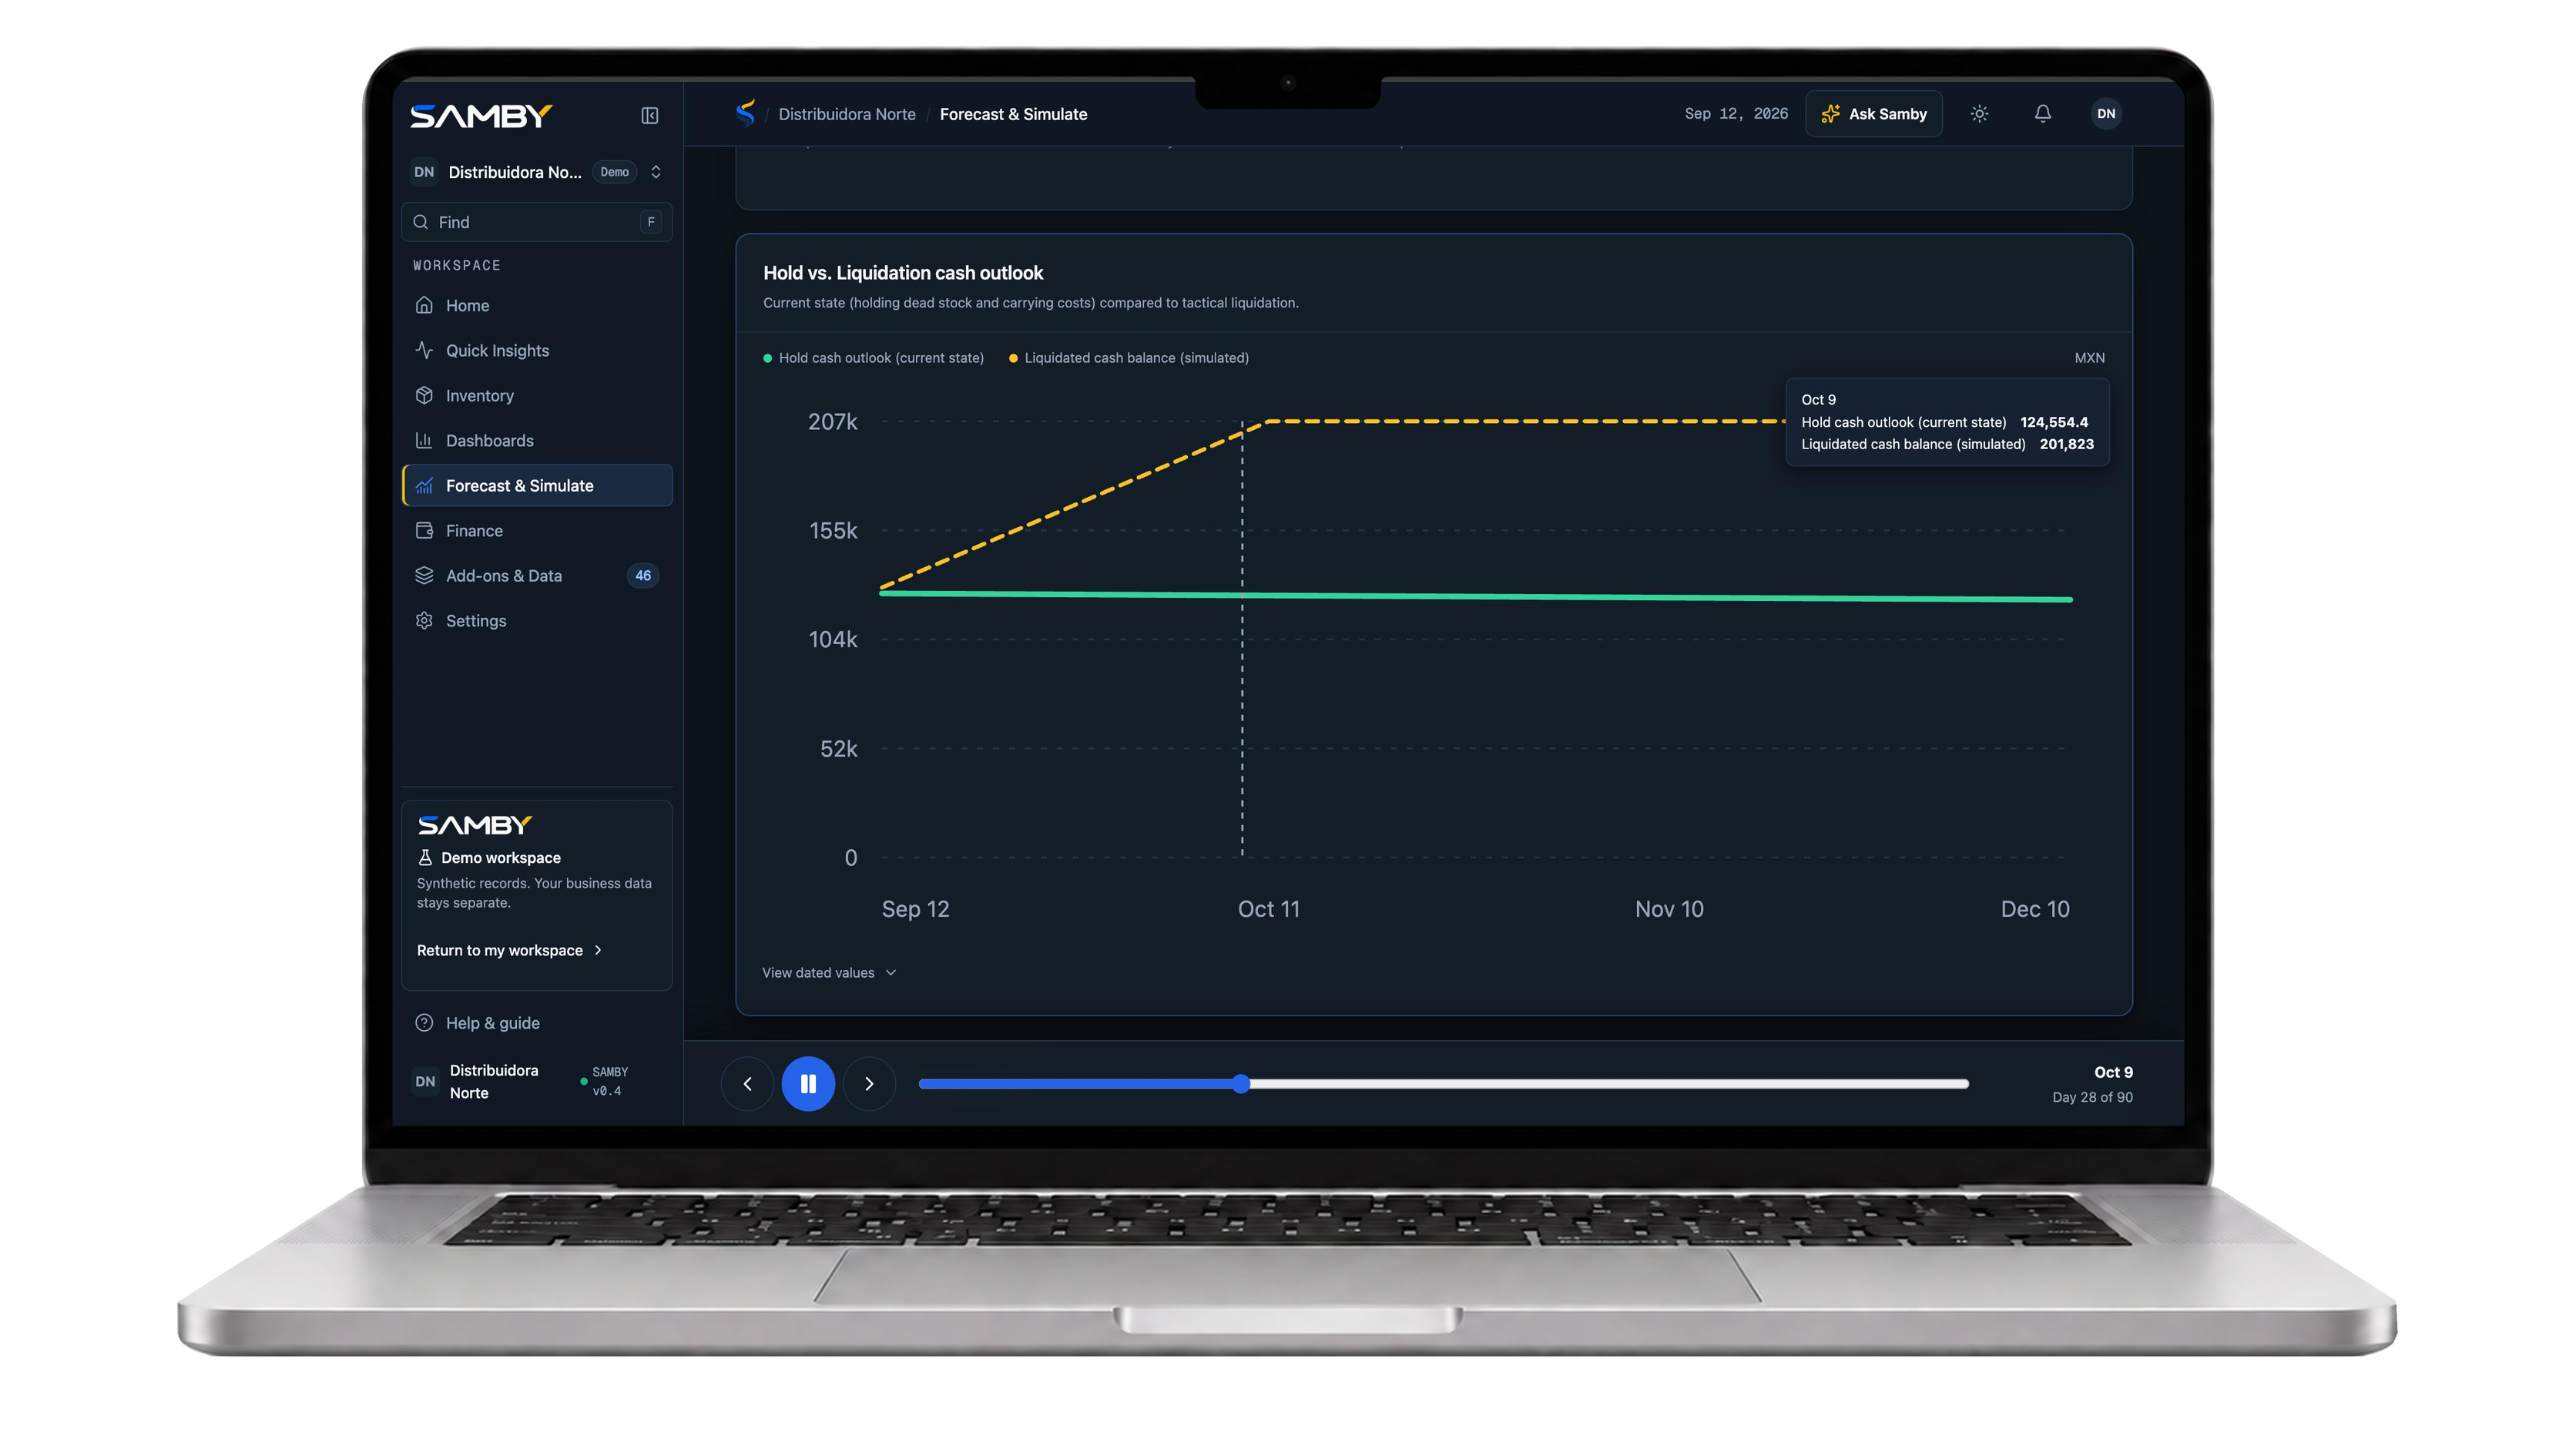
- Forecasting and simulations help users explore scenarios such as supplier delays, demand changes, new orders, and inventory liquidation.
- An interactive 3D warehouse makes inventory changes visible over time.
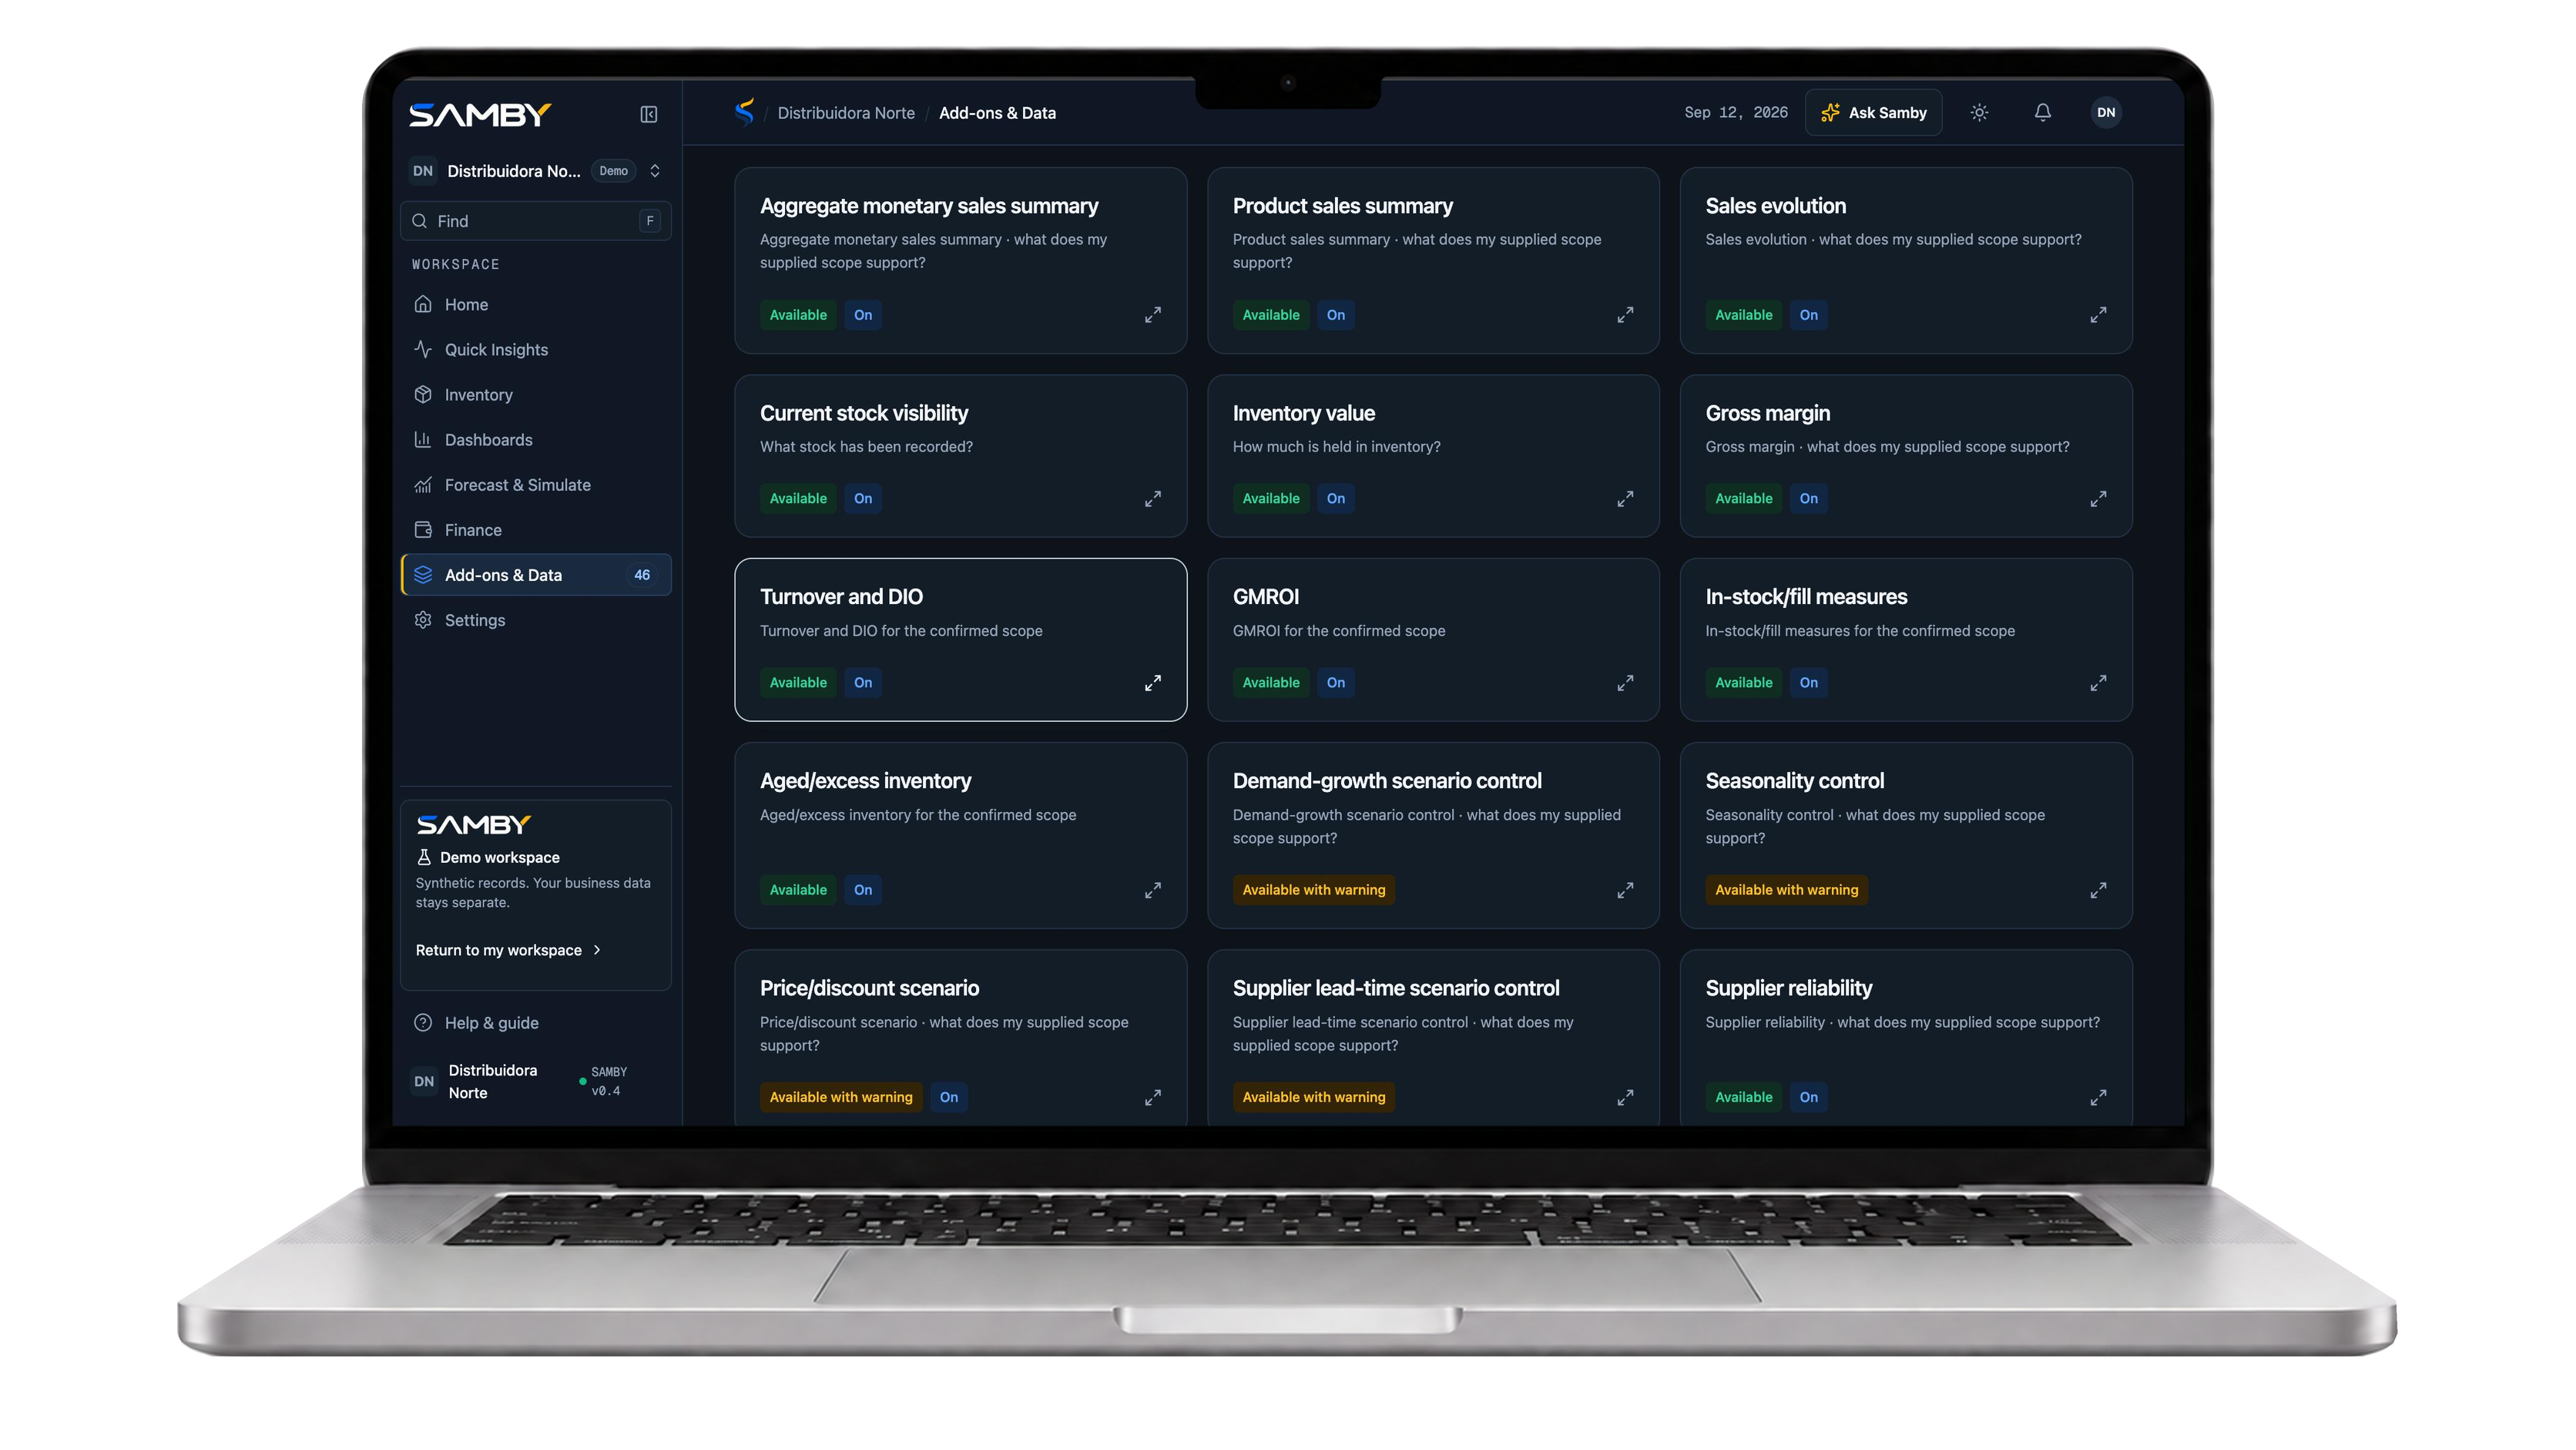
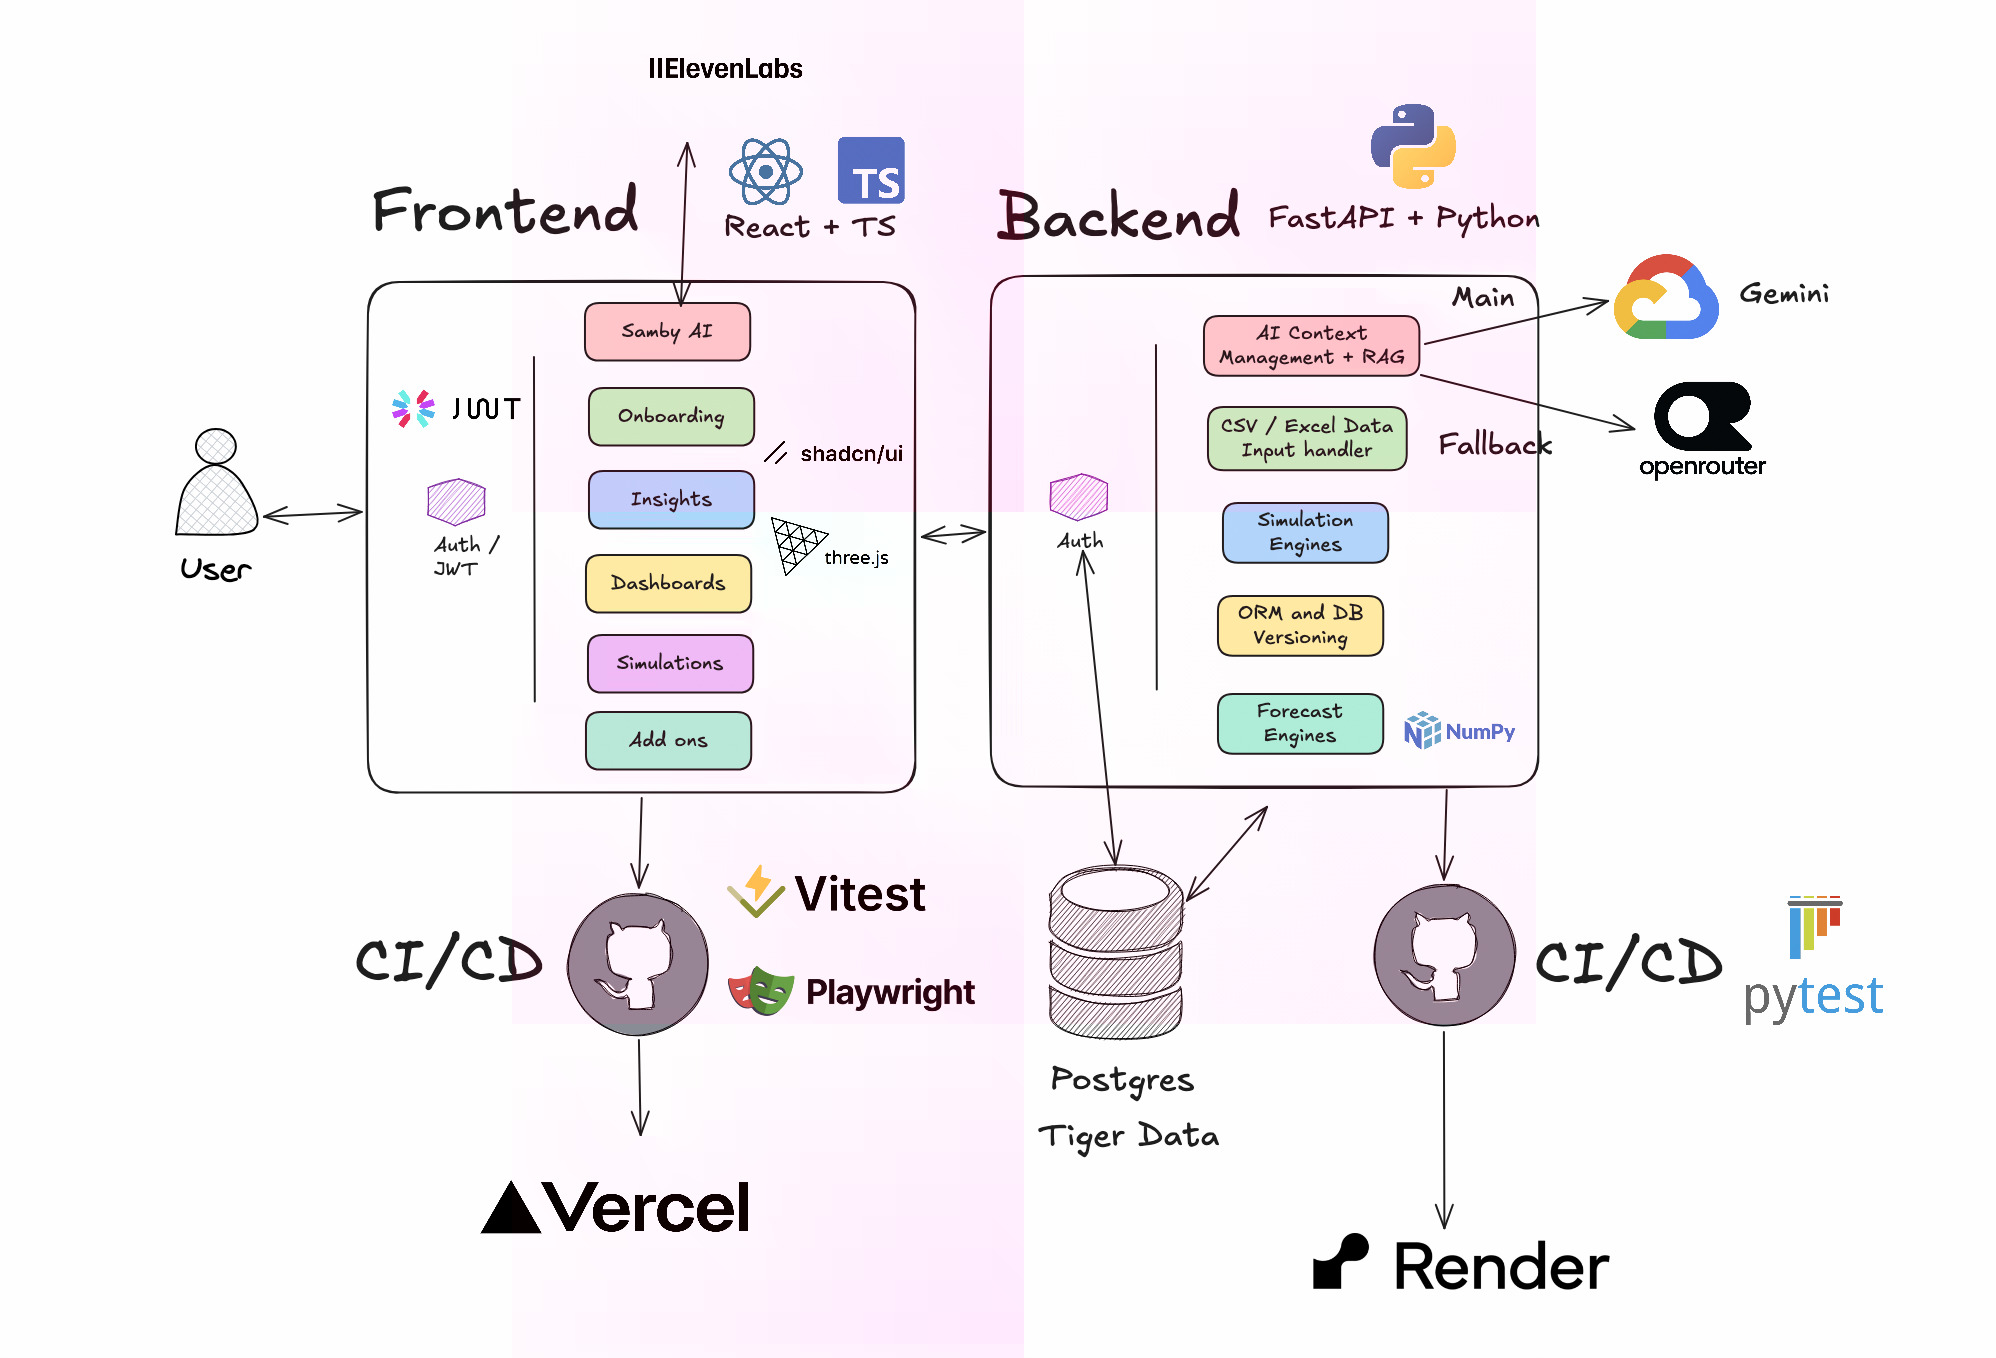
- Modular add-ons let users explore additional capabilities as their data supports them. The goal is to help owners connect a number on a dashboard to a practical business decision. How we built it We built the interface with React and used Three.js for the interactive warehouse simulation. We organized the experience around a journey: bring in data, understand the current situation, ask questions, and explore possible outcomes. The analytical views connect sales, stock, and financial records. The AI assistant adds a conversational way to interpret that information, while scenario controls let users explore how different assumptions affect projected outcomes. We also created demonstration datasets to exercise the workflows and show how the features work together. Challenges we faced One of the hardest challenges was handling incomplete data honestly. A business may have inventory records without historical payments, or sales totals without enough detail to calculate every metric. We needed to distinguish missing information from a recorded zero and make limitations visible. Another challenge was keeping simulations understandable. Users need to know what comes from their records, what they changed, and what is an estimate. We also worked to balance depth with simplicity. Financial diagnostics and inventory analysis can become overwhelming, so we focused on clear navigation, explanations, and visual context. What we learned We learned that useful business intelligence depends as much on explaining data as calculating it. A chart becomes valuable when someone understands what it means for their next purchase, collection, or payment. We also learned that AI explanations and visual simulations serve different purposes: conversation helps users ask better questions, while simulations help them explore consequences. What’s next We want to expand data integrations, strengthen validation with real business workflows, and improve the connection between an insight and the steps an owner can take. Samby: tus datos de hoy, para decidir tu siguiente paso.


Log in or sign up for Devpost to join the conversation.