Inspiration
Small sellers often have sales data they can't read. Charts, trends and KPIs don't mean much to someone who just wants to know what's selling and what to do next. I wanted to build something that explains those numbers in plain words, the way a person would.
That's how SalesSimp started: your sales, made simple.
What it does
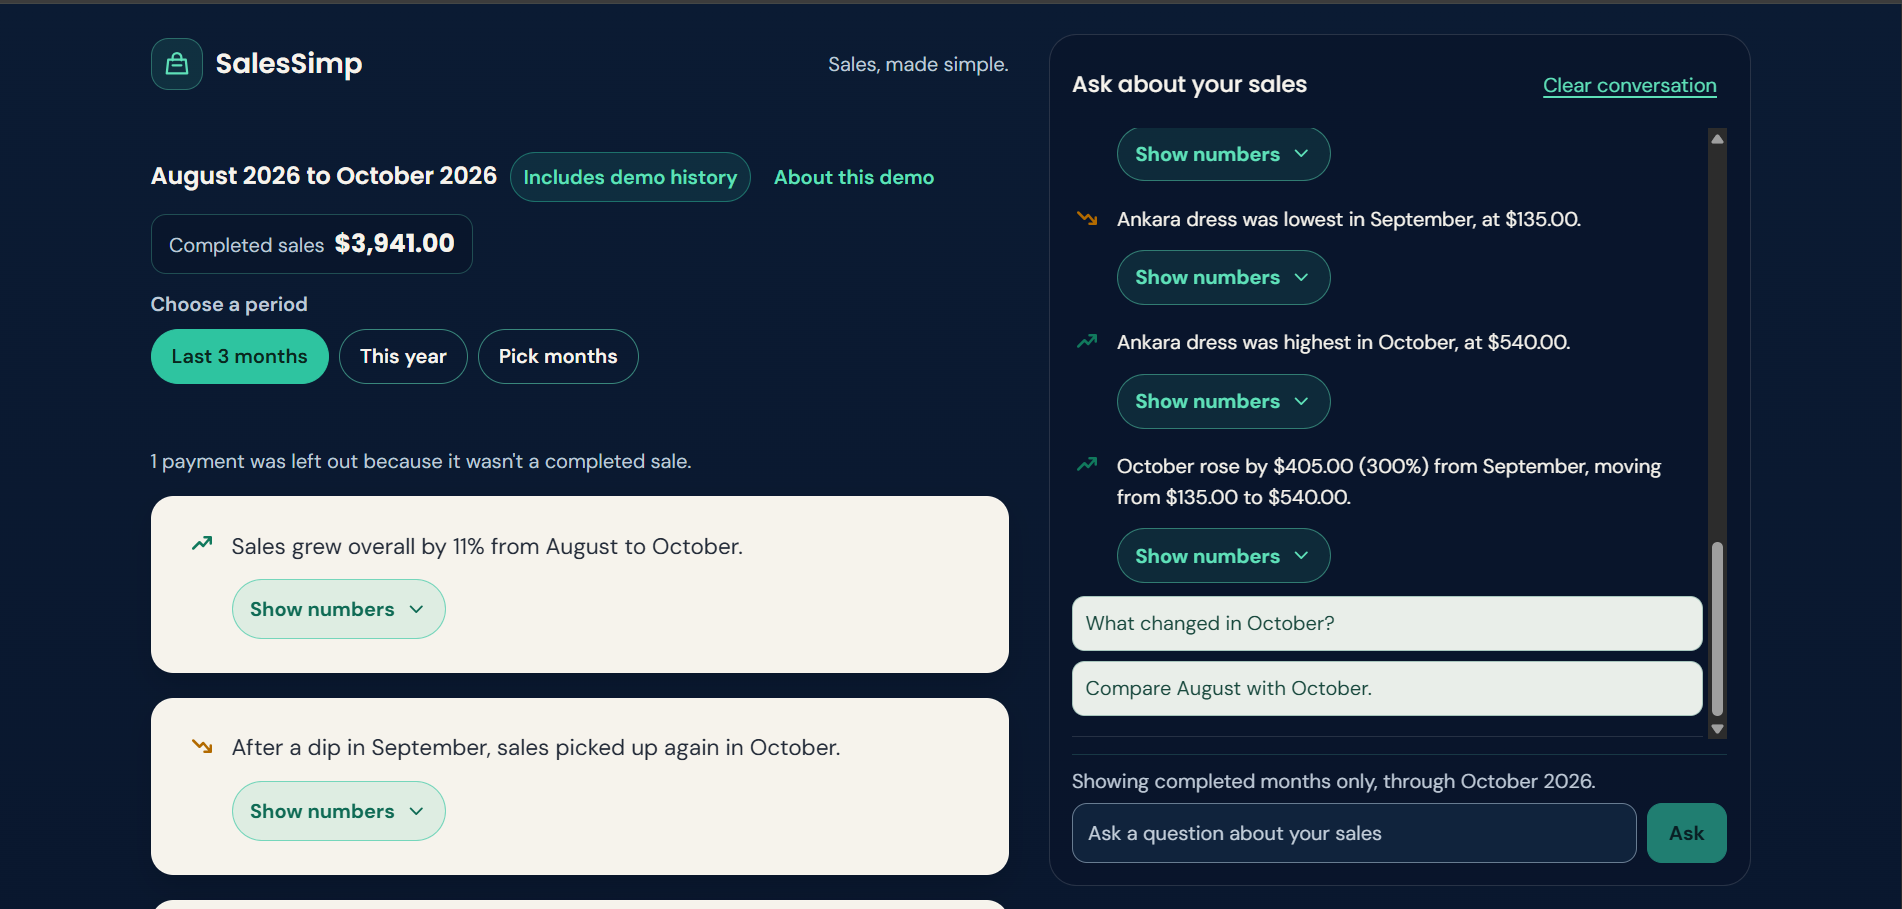
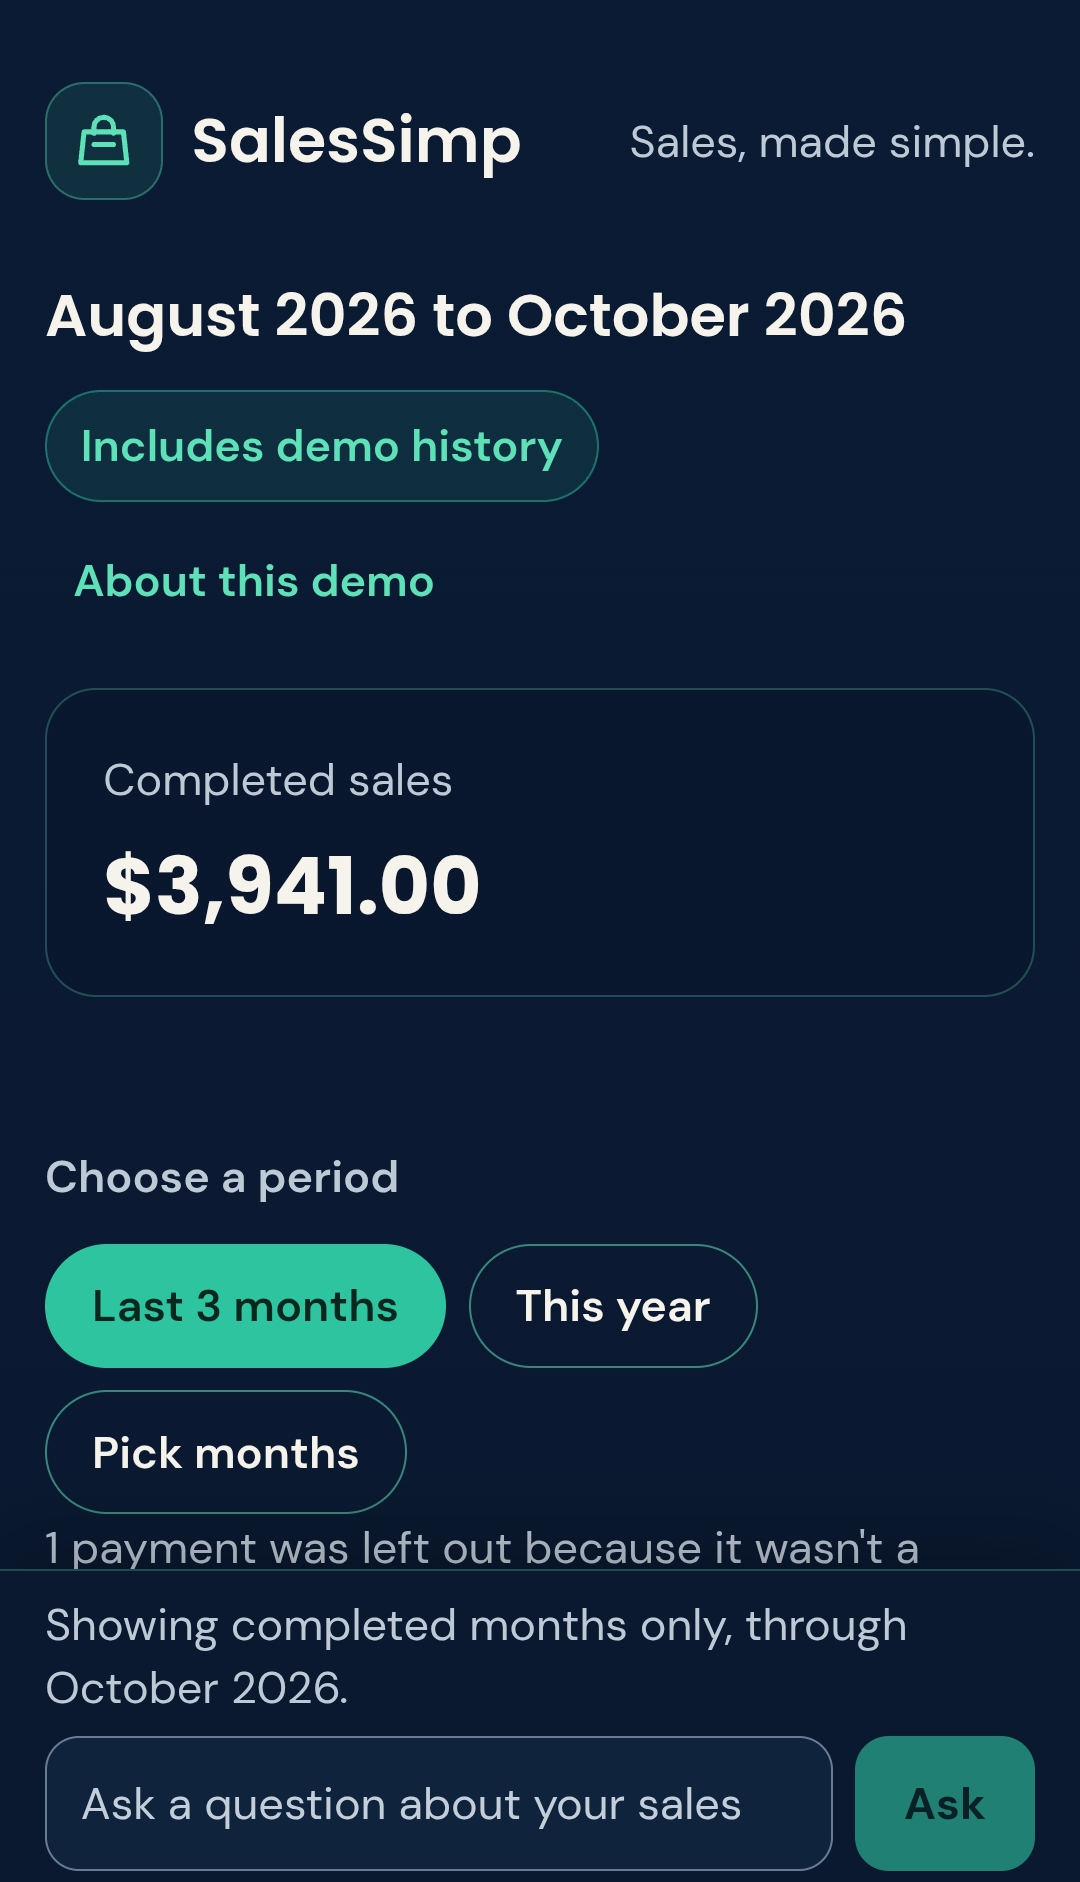
A seller opens SalesSimp and sees a short story about her sales. She can choose a period with a tap, and every sentence has a "Show numbers" button that reveals the figures behind it. She can also ask a question in plain words, such as "Which month was my best?" or "How did Denim jacket do?", and get a written answer.
SalesSimp reads sales from PayPal's Transaction Search API. It counts only completed payments, leaves out anything else, and compares only completed calendar months. A line in the app says how many payments were left out and why.
Revenue is quantity times price, and the change between two periods is
$$\text{change} = \frac{\text{later period} - \text{earlier period}}{\text{earlier period}} \times 100$$
How I built it
I built SalesSimp with Next.js, React, TypeScript and Tailwind CSS, deployed on Vercel. I used GitHub Copilot's agent, working from a scope, a product requirements document and a technical spec that I wr
Built With
- github-copilot
- groq
- next.js
- papaparse
- paypal
- react
- tailwindcss
- typescript
- vercel
- vitest
