Inspiration
Sales teams rely heavily on Salesforce CRM to manage large and complex sales pipelines. However, during my experience exploring CRM analytics, I noticed that pipeline visibility alone is not enough. Sales managers often discover risks too late—when deals have already stalled, forecasts drop, or revenue slips.
Seeing that the judges for this hackathon are from Salesforce and Tableau, I was inspired to build a solution that directly addresses a real-world Salesforce Revenue Operations problem: early detection of pipeline risk with explainable and actionable analytics.
What it does
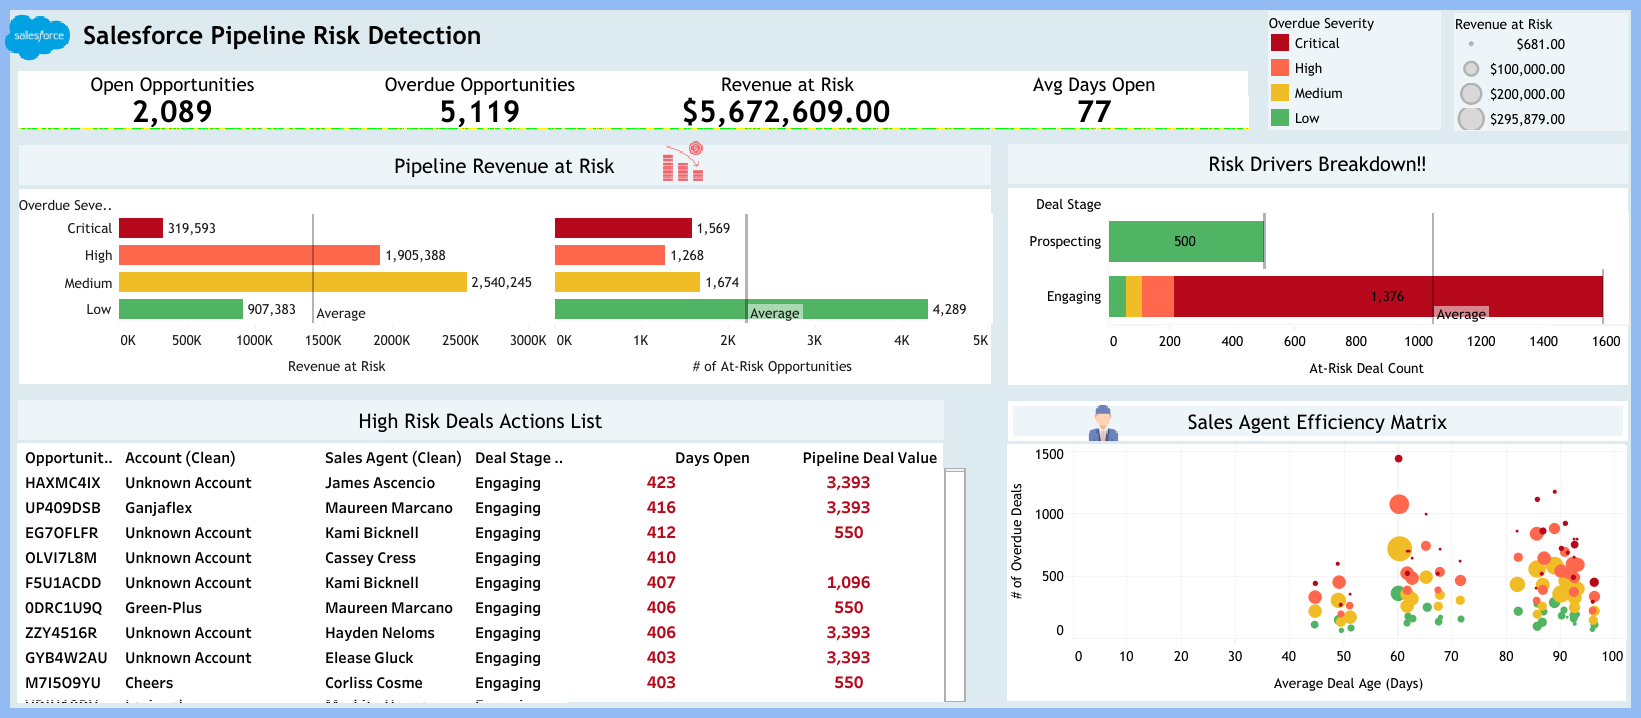
Salesforce Pipeline Risk Detection is an early warning analytics system built with Tableau Cloud that proactively identifies at-risk sales opportunities.
The dashboard:
- Detects overdue and aging deals
- Classifies risk severity (Low, Medium, High, Critical)
- Quantifies revenue exposure
- Explains why each deal is risky
- Provides an action-ready list of high-risk opportunities
All insights update dynamically as data changes, enabling proactive decision-making instead of reactive reporting.
How we built it
The solution was built entirely in Tableau Cloud using a Salesforce-style pipeline dataset.
Key implementation steps included:
- Modeling relationships across accounts, products, sales teams, and pipeline data
- Handling real-world data issues such as null values using calculated fields
- Creating rule-based risk logic using deal age and configurable thresholds
- Building KPIs, bar charts, scatter plots, and action tables
- Adding dashboard actions and parameters to enable interactive, AI-like behavior
- Designing an intuitive dashboard layout focused on clarity and usability
No physical joins were used—Tableau’s logical data model ensured flexibility and scalability.
Challenges we ran into
One of the biggest challenges was handling incomplete and inconsistent CRM data, including missing dates and values. Instead of removing data, I implemented logic inside Tableau to safely handle nulls while preserving analytical accuracy.
Another challenge was balancing complexity with usability—ensuring the dashboard remained intuitive while still delivering advanced, explainable insights within a limited timeframe.
Accomplishments that we're proud of
- Built a fully interactive, end-to-end analytics solution in Tableau Cloud
- Created explainable, enterprise-safe risk detection without black-box AI
- Designed an action-ready dashboard aligned with real Salesforce use cases
- Delivered a polished, professional UI suitable for executive decision-making
What we learned
This project reinforced the importance of explainable analytics in enterprise environments. Instead of focusing only on predictions, delivering clarity, context, and actionability is what truly drives business impact.
I also gained deeper experience in Tableau data modeling, dashboard actions, and building analytics solutions that mirror real-world CRM challenges.
What's next for Salesforce Pipeline Risk Detection Dashboard
With more time, this solution could be enhanced by:
- Integrating Tableau Next Semantic Models
- Adding Agentforce or Slack alerts for newly at-risk deals
- Implementing predictive risk scoring using historical patterns
- Enabling scenario-based forecasting and what-if analysis
- Embedding natural-language insights us
Built With
- crm
- data
- salesforce-style
- tableau-calculated-fields
- tableau-cloud
- tableau-dashboard-actions
- tableau-logical-data-model
- tableau-parameters


Log in or sign up for Devpost to join the conversation.