Inspiration:-Inspired by real business need to analyze Superstore sales data quickly. Companies need fast insights into sales performance, profitability, and regional trends.
What it does:-Complete sales analysis dashboard built in Tableau:
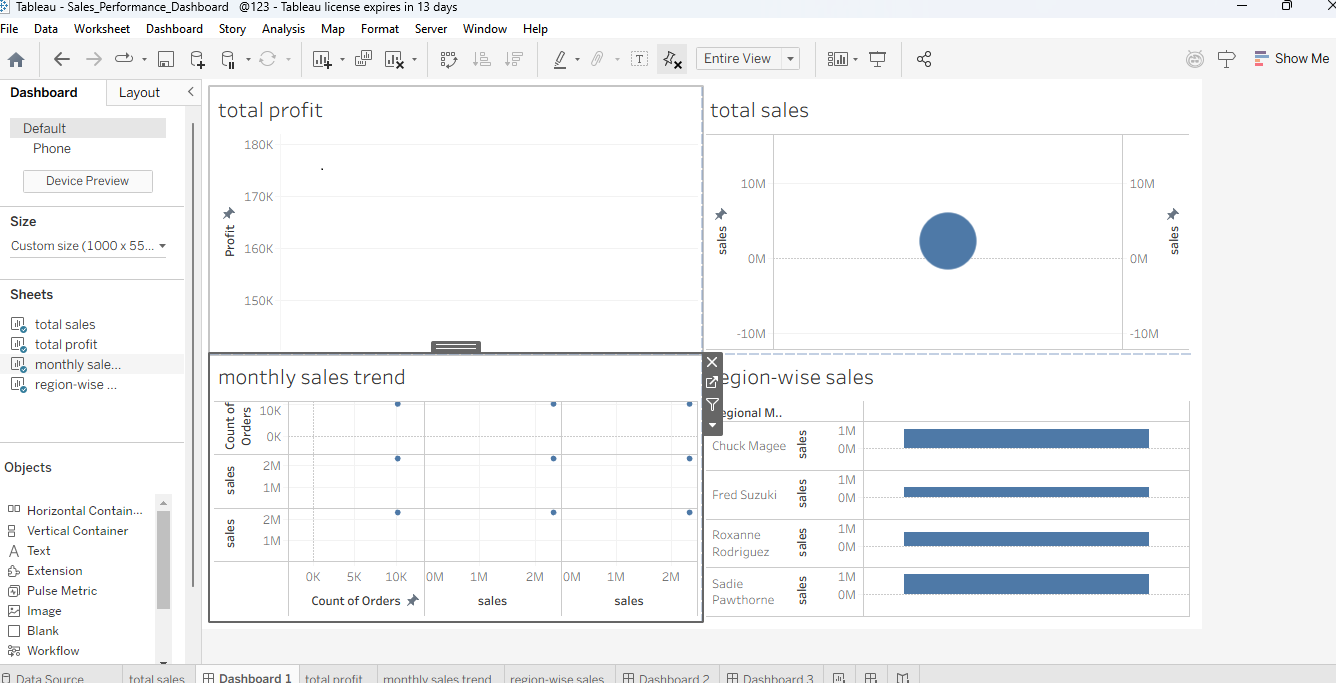
✅ Total Sales & Profit (big number KPIs)
✅ Monthly Sales Trend (line chart)
✅ Region-wise Sales comparison (bar chart)
Perfect tool for business decision-making!
How we built it:-Built step-by-step in Tableau Public:
- Sheet 1: Total Sales KPI (Sales column drag-drop)
- Sheet 2: Total Profit KPI
- Sheet 3: Order Date + Sales → Monthly Line Chart
- Sheet 4: Region + Sales → Bar Chart
- Dashboard → Dragged all 4 sheets and arranged layout
- Screen recording → YouTube PUBLIC upload ## Challenges we ran into:-- Arranging sheets properly in dashboard was tricky
- Perfecting font sizes and layout took time
- Screen recording with clear voice was challenging
- YouTube PUBLIC visibility setting was confusing ## Accomplishments that we're proud of ✅ First time building complete Tableau dashboard! ✅ Professional-looking sales KPIs + charts ✅ Clear 2 minutes 37-second video demo ✅ Followed all requirements exactly ✅ Ready before deadline! 🔥 ## What we learned:-✅ Power of Tableau drag-drop interface ✅ Dashboard design principles (layout + readability) ✅ Screen recording + YouTube upload process ✅ Hackathon submission format ✅ Business sales metrics fundamentals ## What's next for Sales Performance Analysis Dashboard:-1. Add interactive filters (Region, Year-wise)
- Advanced charts (Heatmap, Treemap)
- Live data connection (real-time sales)
- Mobile-responsive design
- Power BI version

Log in or sign up for Devpost to join the conversation.