Inspiration
In the fast-paced world of retail, data is often trapped in static spreadsheets or clunky, outdated dashboards. We wanted to bridge the gap between raw data and executive decision-making. The inspiration for Lumina Analytics came from the desire to create a business intelligence tool that feels less like a spreadsheet and more like a conversation with a data scientist. We wanted to combine the visual elegance of modern SaaS applications with the cognitive power of Generative AI.
What it does
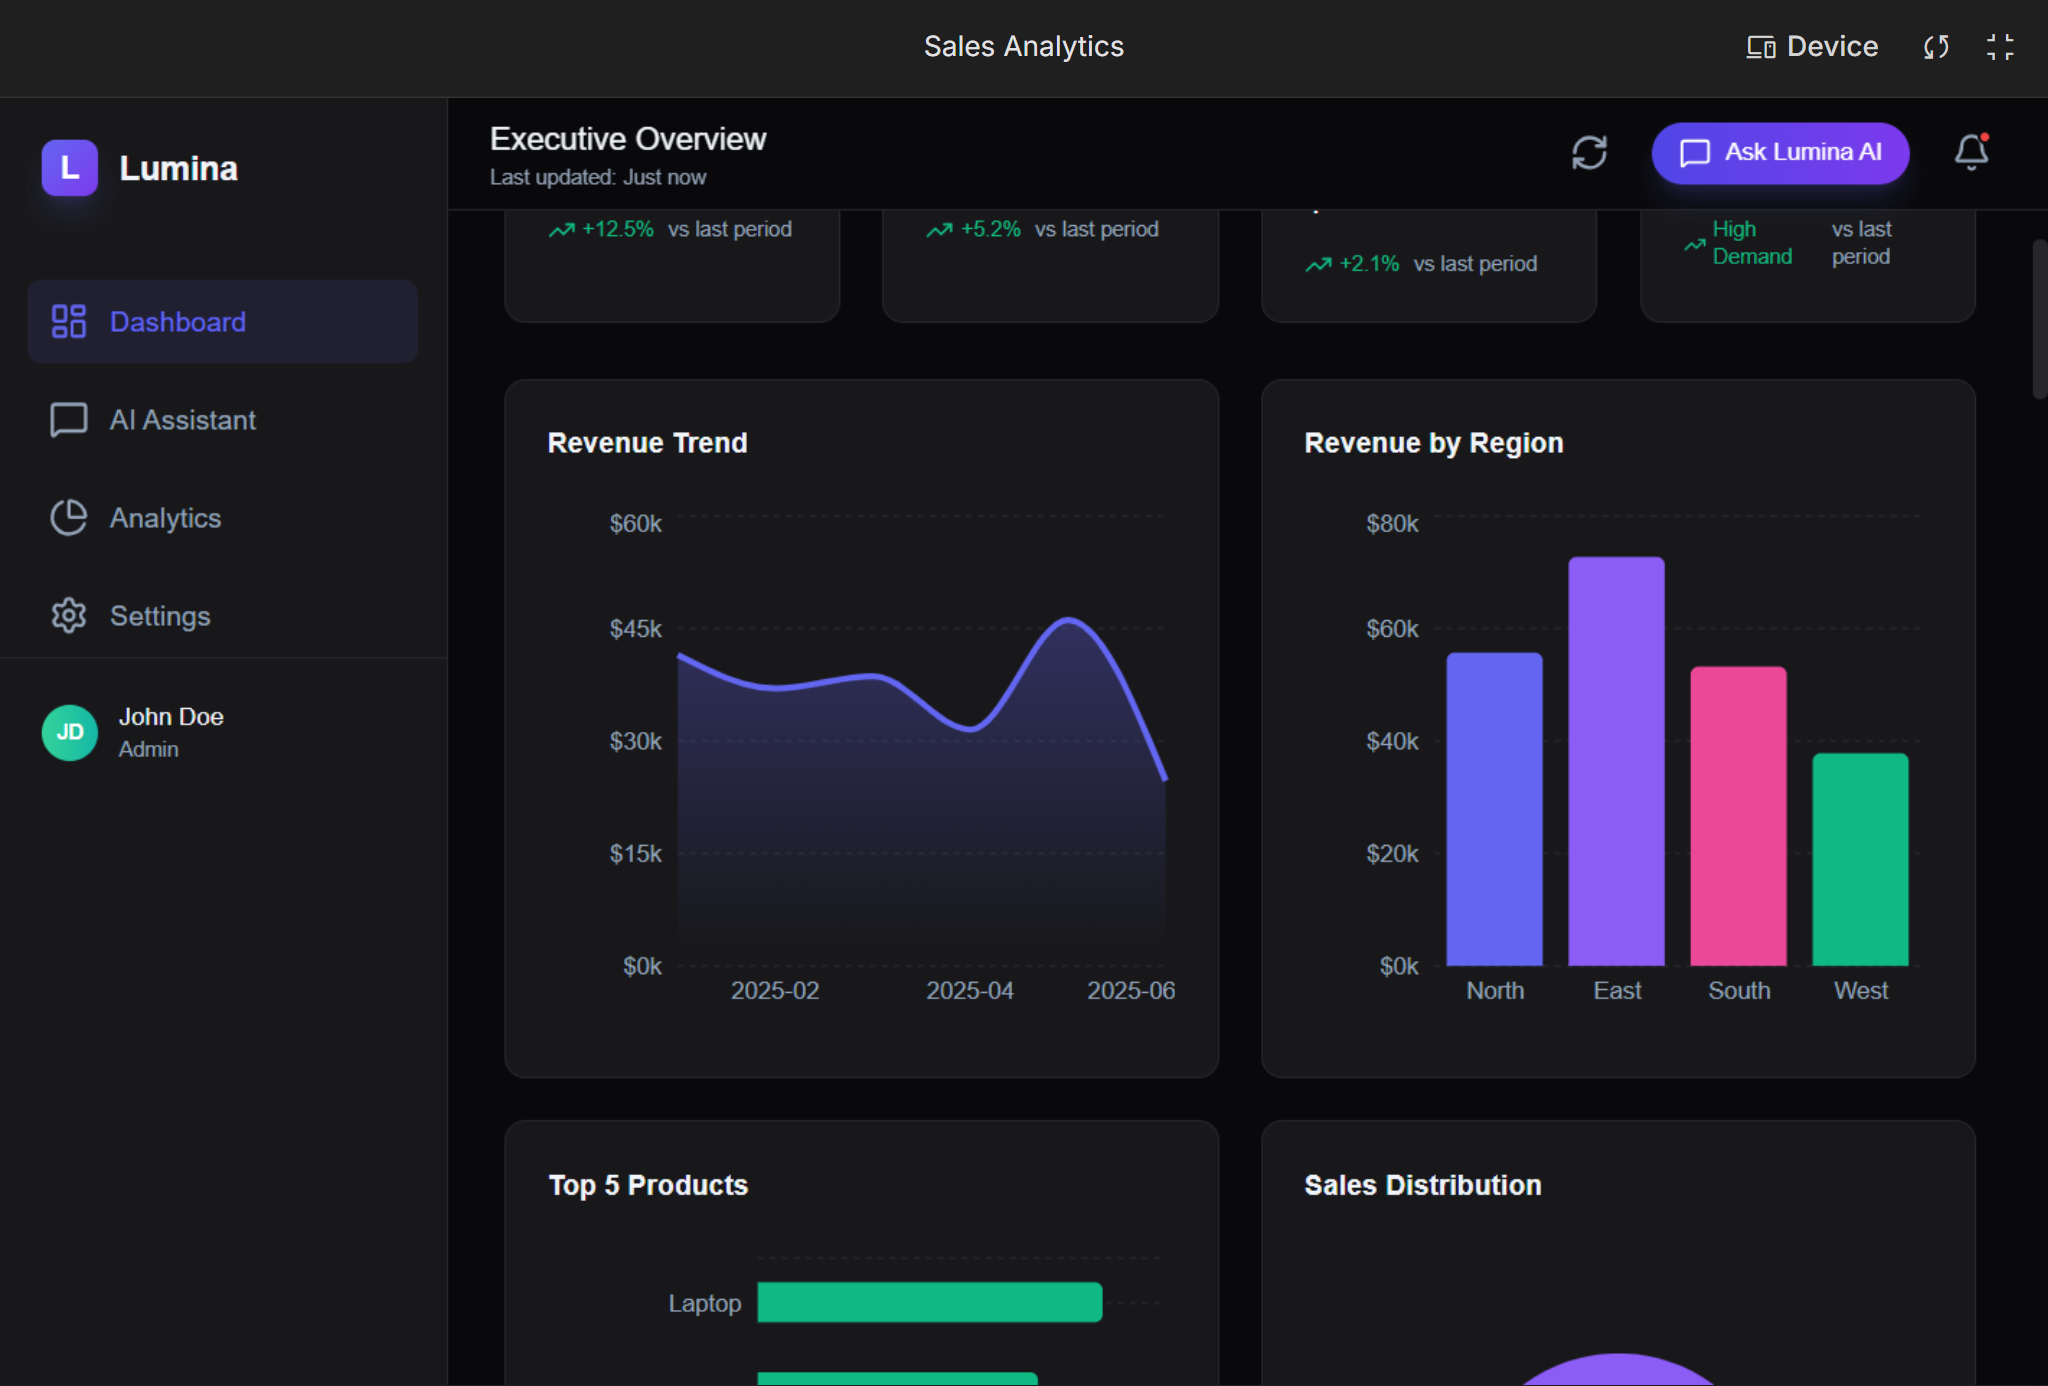
Sales Analytics is a premium, dual-theme (Dark/Light) sales dashboard that transforms raw CSV sales data into actionable insights.
- Executive Overview: Instantly displays critical KPIs (Revenue, Orders, AOV), revenue trends over time, and category performance.
- Advanced Analytics: Features a dedicated analytics page with:
- Sales Rep Performance: Bar charts comparing team members against monthly targets (with visual annotations).
- Geographic Distribution: A creative visualization mapping orders to regions.
- Pricing Strategy: Scatter plots analyzing the correlation between unit price and order quantity.
- Interactive Filtering: Users can slice and dice data by Region and Category in real-time.
- Lumina AI Assistant: A built-in AI sidebar powered by Google Gemini. Users can:
- Ask natural language questions about their specific dataset.
- Get strategic business advice.
- Generate marketing images for products directly within the app.
- Customization: Full support for Light and Dark modes with a semantic color system.
How I built it
- Framework: Built with React and TypeScript for robust component architecture.
- Styling: Used Tailwind CSS with a custom semantic variable system (
--surface,--textMain, etc.) to handle smooth transitions between Light and Dark modes. - Visualization: Leveraged Recharts for highly responsive and customizable charts.
- AI Integration: Implemented the @google/genai SDK.
- We feed the current data context (KPIs and CSV samples) into the system prompt.
- We use
gemini-3-flash-previewfor rapid text analysis and reasoning. - We use
gemini-2.5-flash-imagefor generating marketing assets on command.
- Data Handling: Wrote custom CSV parsing logic to process raw sales data entirely on the client side.
Challenges we ran into
- Theming Architecture: Creating a color system that looked "Premium" in both dark and light modes was tricky. We had to abstract our Tailwind colors into CSS variables to ensure every border, chart color, and background shifted seamlessly without code duplication.
- Visualizing Geography: I wanted a map view but didn't want the overhead of a heavy library like Leaflet. We solved this by using a Recharts ScatterPlot and mapping regions (North, South, East, West) to simulated coordinate ranges, effectively creating a "stylized" map using standard charting components.
- AI Context Management: Balancing the amount of data sent to the AI model to provide accurate answers without exceeding context windows or increasing latency.
Accomplishments that we're proud of
- The UI/UX: The dashboard looks professional and polished. The glassmorphism effects and gradient accents give it a high-end feel.
- The "Map" Hack: successfully visualizing geographic distribution using a Scatter Chart was a fun technical workaround that kept the bundle size small.
- Deep AI Integration: It's not just a chatbot bolted on; the AI knows the context of the specific sales data loaded into the application.
What I learned
- I deepened our understanding of Semantic CSS variables for theming.
- I learned how to use the specific configuration options in Recharts to add Reference Lines and Annotations for business targets.
- I gained experience prompting the Google Gemini API to act as a specific persona ("Business Intelligence Analyst") to get high-quality, professional responses.
What's next for Sales Analytics
- Data Upload: allowing users to drag and drop their own CSV files to analyze their own companies.
- Exportable Reports: Generating PDF snapshots of the dashboard for meetings.
- Predictive Analytics: Using Gemini to forecast future revenue based on the historical trend lines.
Built With
- coding
- html
- tsx
- vibe

Log in or sign up for Devpost to join the conversation.