-
-

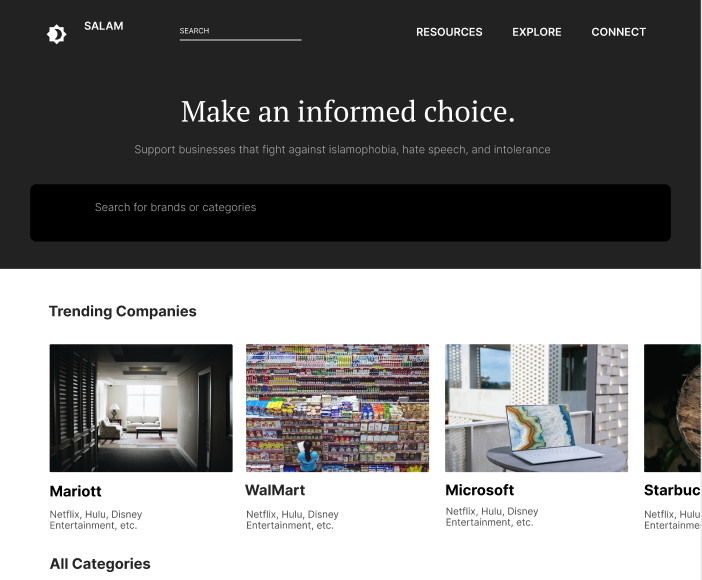
Landing page
-

Resources page
-

Social Network Analysis
-

Packed Circle chart
-

stocks


->>> SLIDE DECK: https://docs.google.com/presentation/d/1AQzv2gop8_Agh-b_ZOwfCvlTX64VMqESwNVQTszJO5Q/edit?usp=sharing Devpost:
Inspiration
Just months ago, the mosque near my home was vandalized by a group of students from my high school (see article: https://www.thestar.com/news/gta/2020/02/25/vandals-recently-urinated-on-this-markham-mosque-muslim-leaders-responded-by-opening-their-doors-to-everyone.html) - a school of diverse religions and cultures. Despite having friends of this religion, and having open conversations about respect for others, Islamophobia is prevalent and the unfortunate fact is that it is a problem that a majority of Muslims will face in their lifetime unless we take action right now.
Inspired by Fifth Tribe/America Indivisible’s #hackislamophobia challenge, we wanted something that would allow consumers and investors to be able to access a platform which allowed them analyze the types of companies that they were supporting. It is important that we continue to support companies that are doing the right thing, enabling consumers to support those companies and simultaneously come together to create a consumer force against donation funding of anti-Muslim organizations.
To analyze, the actions of these companies and how they are contributing to the Muslim community and combatting islamophobia, we look at data surrounding how a company supports the Muslim community, provide resources for support, and a discussion forum for users of the website. We aim to present this data in an unbiased way, allowing consumers to make informed choices.
What it does
Our website, Salam, meaning peace in Arabic, was created to provide consumers and investors the ability to determine the ethical nature of the companies that they invest and support through purchases.
We gather our data for organizations through public 990 tax forms from the IRS, processes and categorizes the information to make it more accessible.
The website presents the data collected through a packed circle chart, and a short summary describing the most recent actions of the company. While the primary user base is a general consumer, we also wanted to consider the potential business impact of tracking and presenting this information publicly. Investors are able to analyze stocks of the company and decide if they agree with the public stance presented, as well as an email alerter where they can subscribe to any updates for interesting companies. Finally, we also provide resources and blog posts to allow the community to discuss and seek further understanding about issues and share their own experiences with companies.
How I built it
As a team of 4, we had 2 team members who were stronger in front-end and 2 that were stronger in the back-end.
In terms of the tools used, Front-end Dev: HTML/CSS, Javascript Design: Figma For the backend, the data analysis was done via the request to the Propublica API to obtain organization tax return forms and processed with pandas library in Python. We used Google Cloud BigQuery to load our data to tableau to make our magical bubble mappings.
Challenges I ran into
-- The majority of the tax forms were scanned, not directly published which did not allow parsing.
For the front end, we typically present design mockups using Figma as opposed to coding a fully functional website. For the first time, we chose to design and code the full front-end during a hackathon and this proved a bit difficult as we sacrificed various components of the design process for the sake of coding the website. Being consistent in terms of styling of elements and mimicking the Figma and those interactions was also challenging in the shorter time frame.
Accomplishments that I'm proud of
-- Created a fully functional web application in 24 hours with a pretty cool design -- Able to work on a social cause that we are passionate about and would make a difference in the world -- Experimented with new pieces of technology, especially in terms of the data visualization
What I learned
Julia: This was my first time designing and not just developing and it was a ton of fun
Shaahana: I typically design for each of the hackathons I’ve been apart of before, and it was a very different experience coding the front-end of the site but it was interesting to recognize the different ways in which a design could be implemented!
Grace: I know way, way too much about the 990 IRS forms now. How could a tax form be 17000 pages long?
Ayla: All about data visualization and how to use Tableau!
What's next for salam
In terms of next steps for Salam, this data visualization method is something scalable and could potentially be used for other social issues. We’d like to: Work on the design process and iterate on our current feature set Expand datasets Identify more methods of data visualization
Sources and reference
How we defined hate groups: https://www.splcenter.org/fighting-hate/extremist-files/groups?f%5B0%5D=field_ideology%3A179
More hate group funding tracing that includes Fidelity and Vanguard: http://www.islamophobia.org/reports/243-hijacked-by-hate-american-philanthropy-and-the-islamophobia-network.html
NPR article about research above: https://www.npr.org/2019/05/07/720832680/mainstream-charities-are-unwittingly-funding-anti-muslim-hate-groups-report-says
Support Muslim community organizations: https://www.bustle.com/p/7-muslim-advocacy-groups-to-support-through-donations-volunteering-32913
Built With
- css3
- figma
- google-bigquery
- html5
- javascript
- propublica
- tableau


Log in or sign up for Devpost to join the conversation.