-
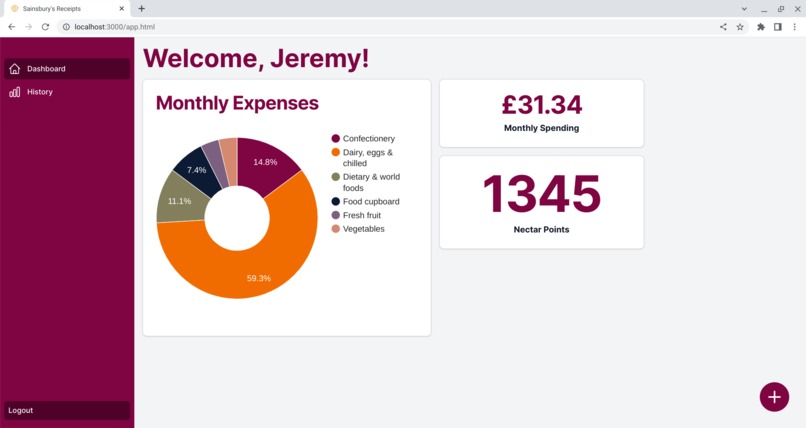
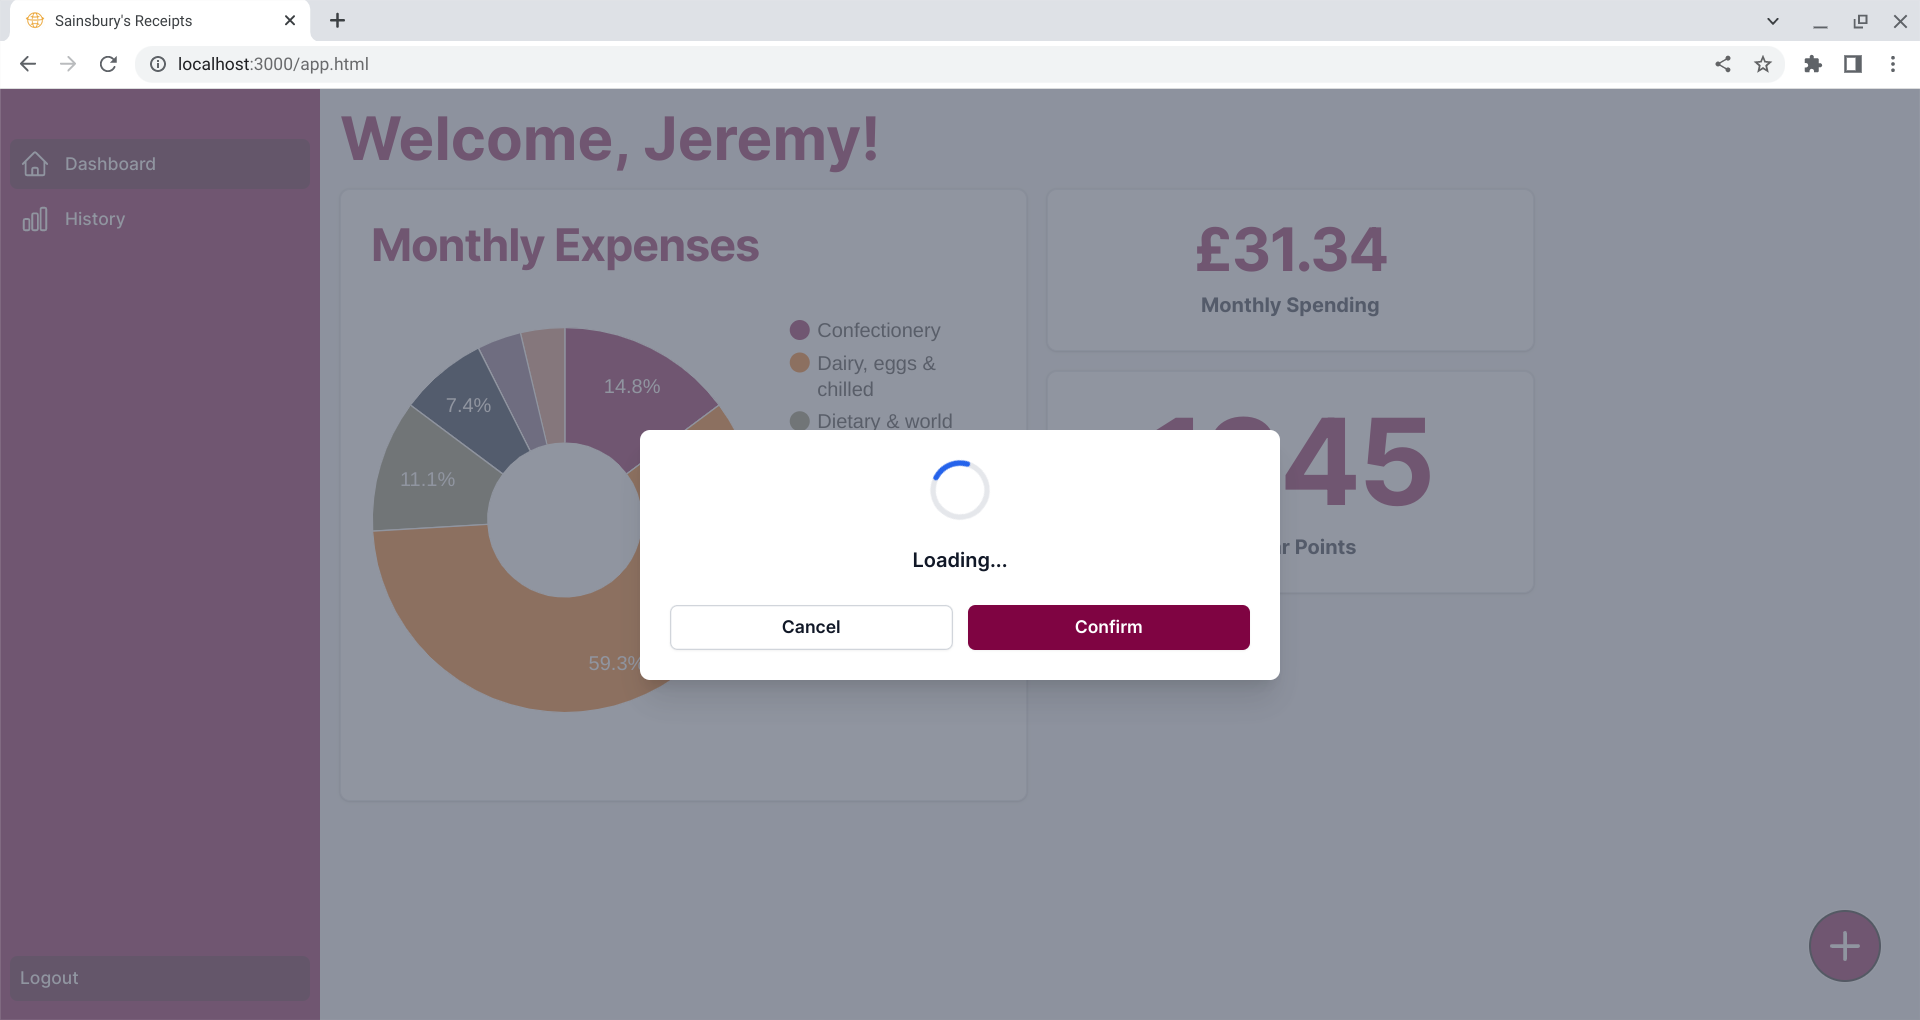
main dashboard
-
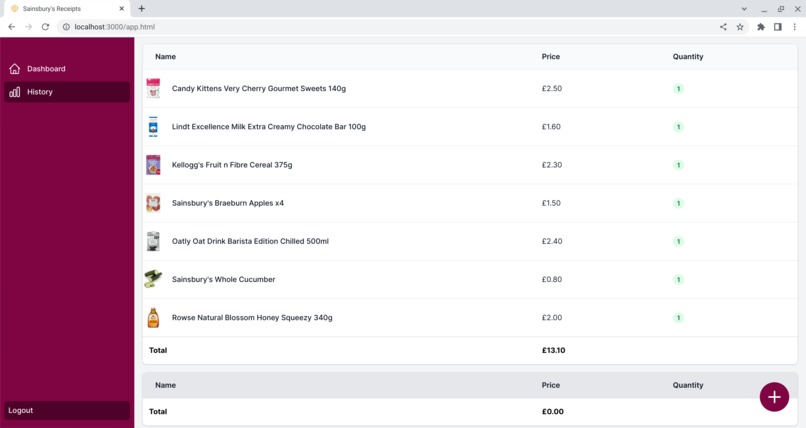
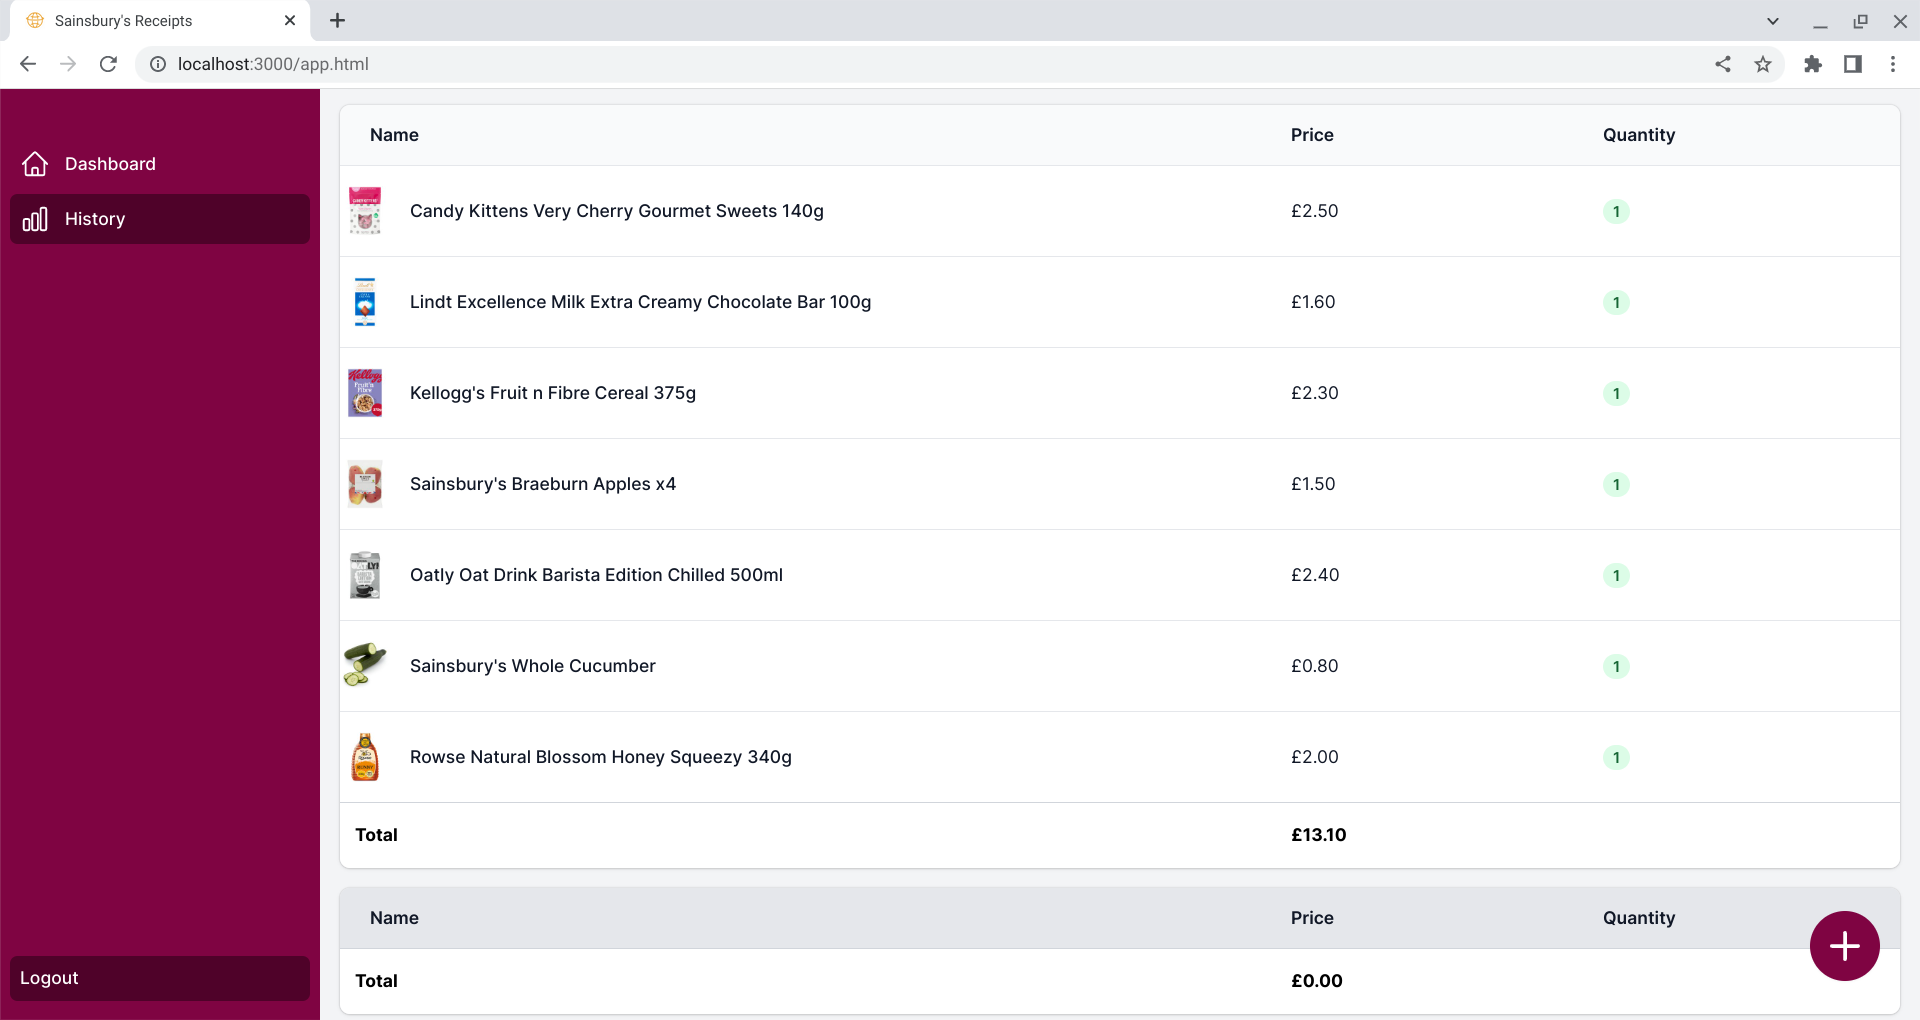
purchase history
-

receipt upload in progress
-
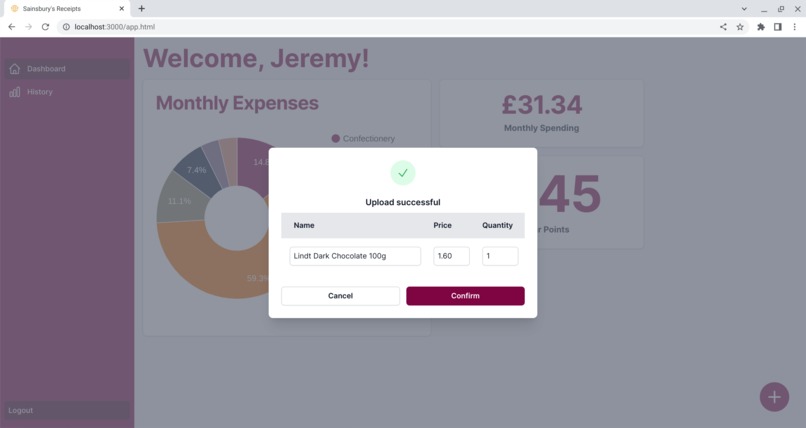
receipt upload complete


Inspiration
If you are the type of person to keep a close eye on your spending habits, you will want to keep track of your grocery purchases. It is easy to keep track of the overall amount spent but without a receipt scanner or manually logging information it is not possible to view a full breakdown of the per product expenses. Existing receipt scanners show product names as they appear on the receipt which are not usually transparent enough for a user to interpret.
In order to deal with this problem we have created an application which automatically matches the items on your receipt to the actual product names as they appear on the Sainsbury's website. Our web app provides you with a picture of the item, a full item description and sorts the purchase items into categories, allowing you to track what types of items you spend the most money on, for example total amount spent on biscuits vs vegetables. Another feature that could be added to this app is nutritional information for each item allowing for tracking of macros per amount spent.
Additionally loyalty cards allow you to track your spending by providing a history of all your receipts. This feature can be implemented for nectar card using our app to make it more valuable, by allowing users to access their purchase history with Sainsbury's.
What it does
Parses images of receipts, matches each product on the receipt to an item on sainsburys.co.uk, and stores receipt information in a database. Then it calculates metrics like monthly spending and items purchased per category, with potential for many more features and statistics about the consumer's spending habits. A user can log in using Auth0 authetification and store their purchase history on our database.
How we built it
We used veryfiAPI to do OCR and parse the receipt, serpAPI to perform a search on Google with the item data from the receipt to find the item on the Sainsbury's website. We then parse the website to get a full item description, item image, category, etc. We store that in a SQLite database. We then calculate user spending metrics and present this on an interactive web interface that we built using TailwindCSS, ALpineJS and Google charts.
Challenges we ran into
The most challenging part was creating the frontend, since none of us were too familiar with frotend development.
Accomplishments that we're proud of
Getting all the pieces working together
What we learned
Friendship, frontend is difficult
What's next for Sainsbury's Receipt scanner & purchase history
Implementing more overview statistics, personal goals (e.g. reduce sweets purchases this month, increase vegetable), create personalised user accounts, integration with nectar card.
Built With
- alpine.js
- auth0
- google-chart
- python
- serpapi
- sqlite
- tailwindcss
- tailwindui
- veryfiapi

Log in or sign up for Devpost to join the conversation.