-
-
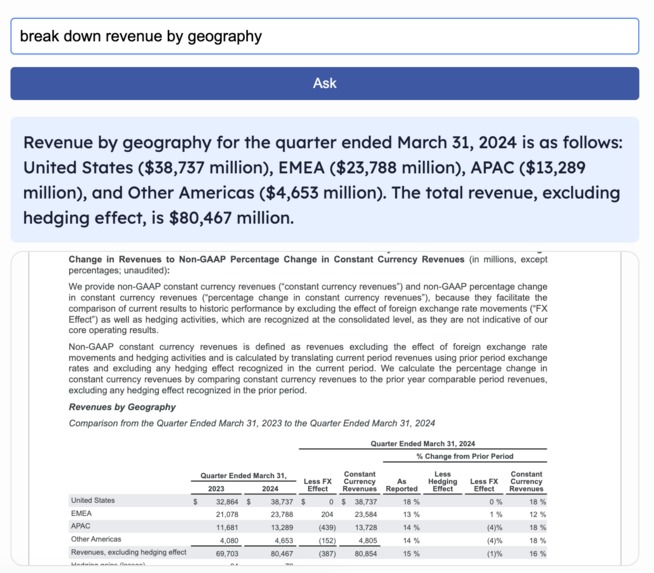
Semantic search with in document citation
-
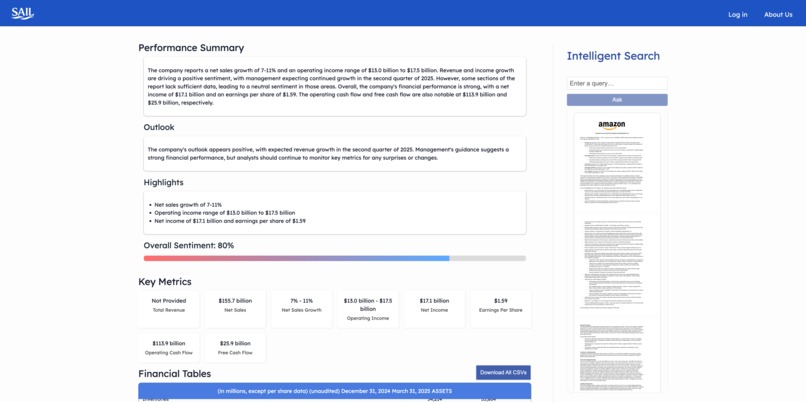
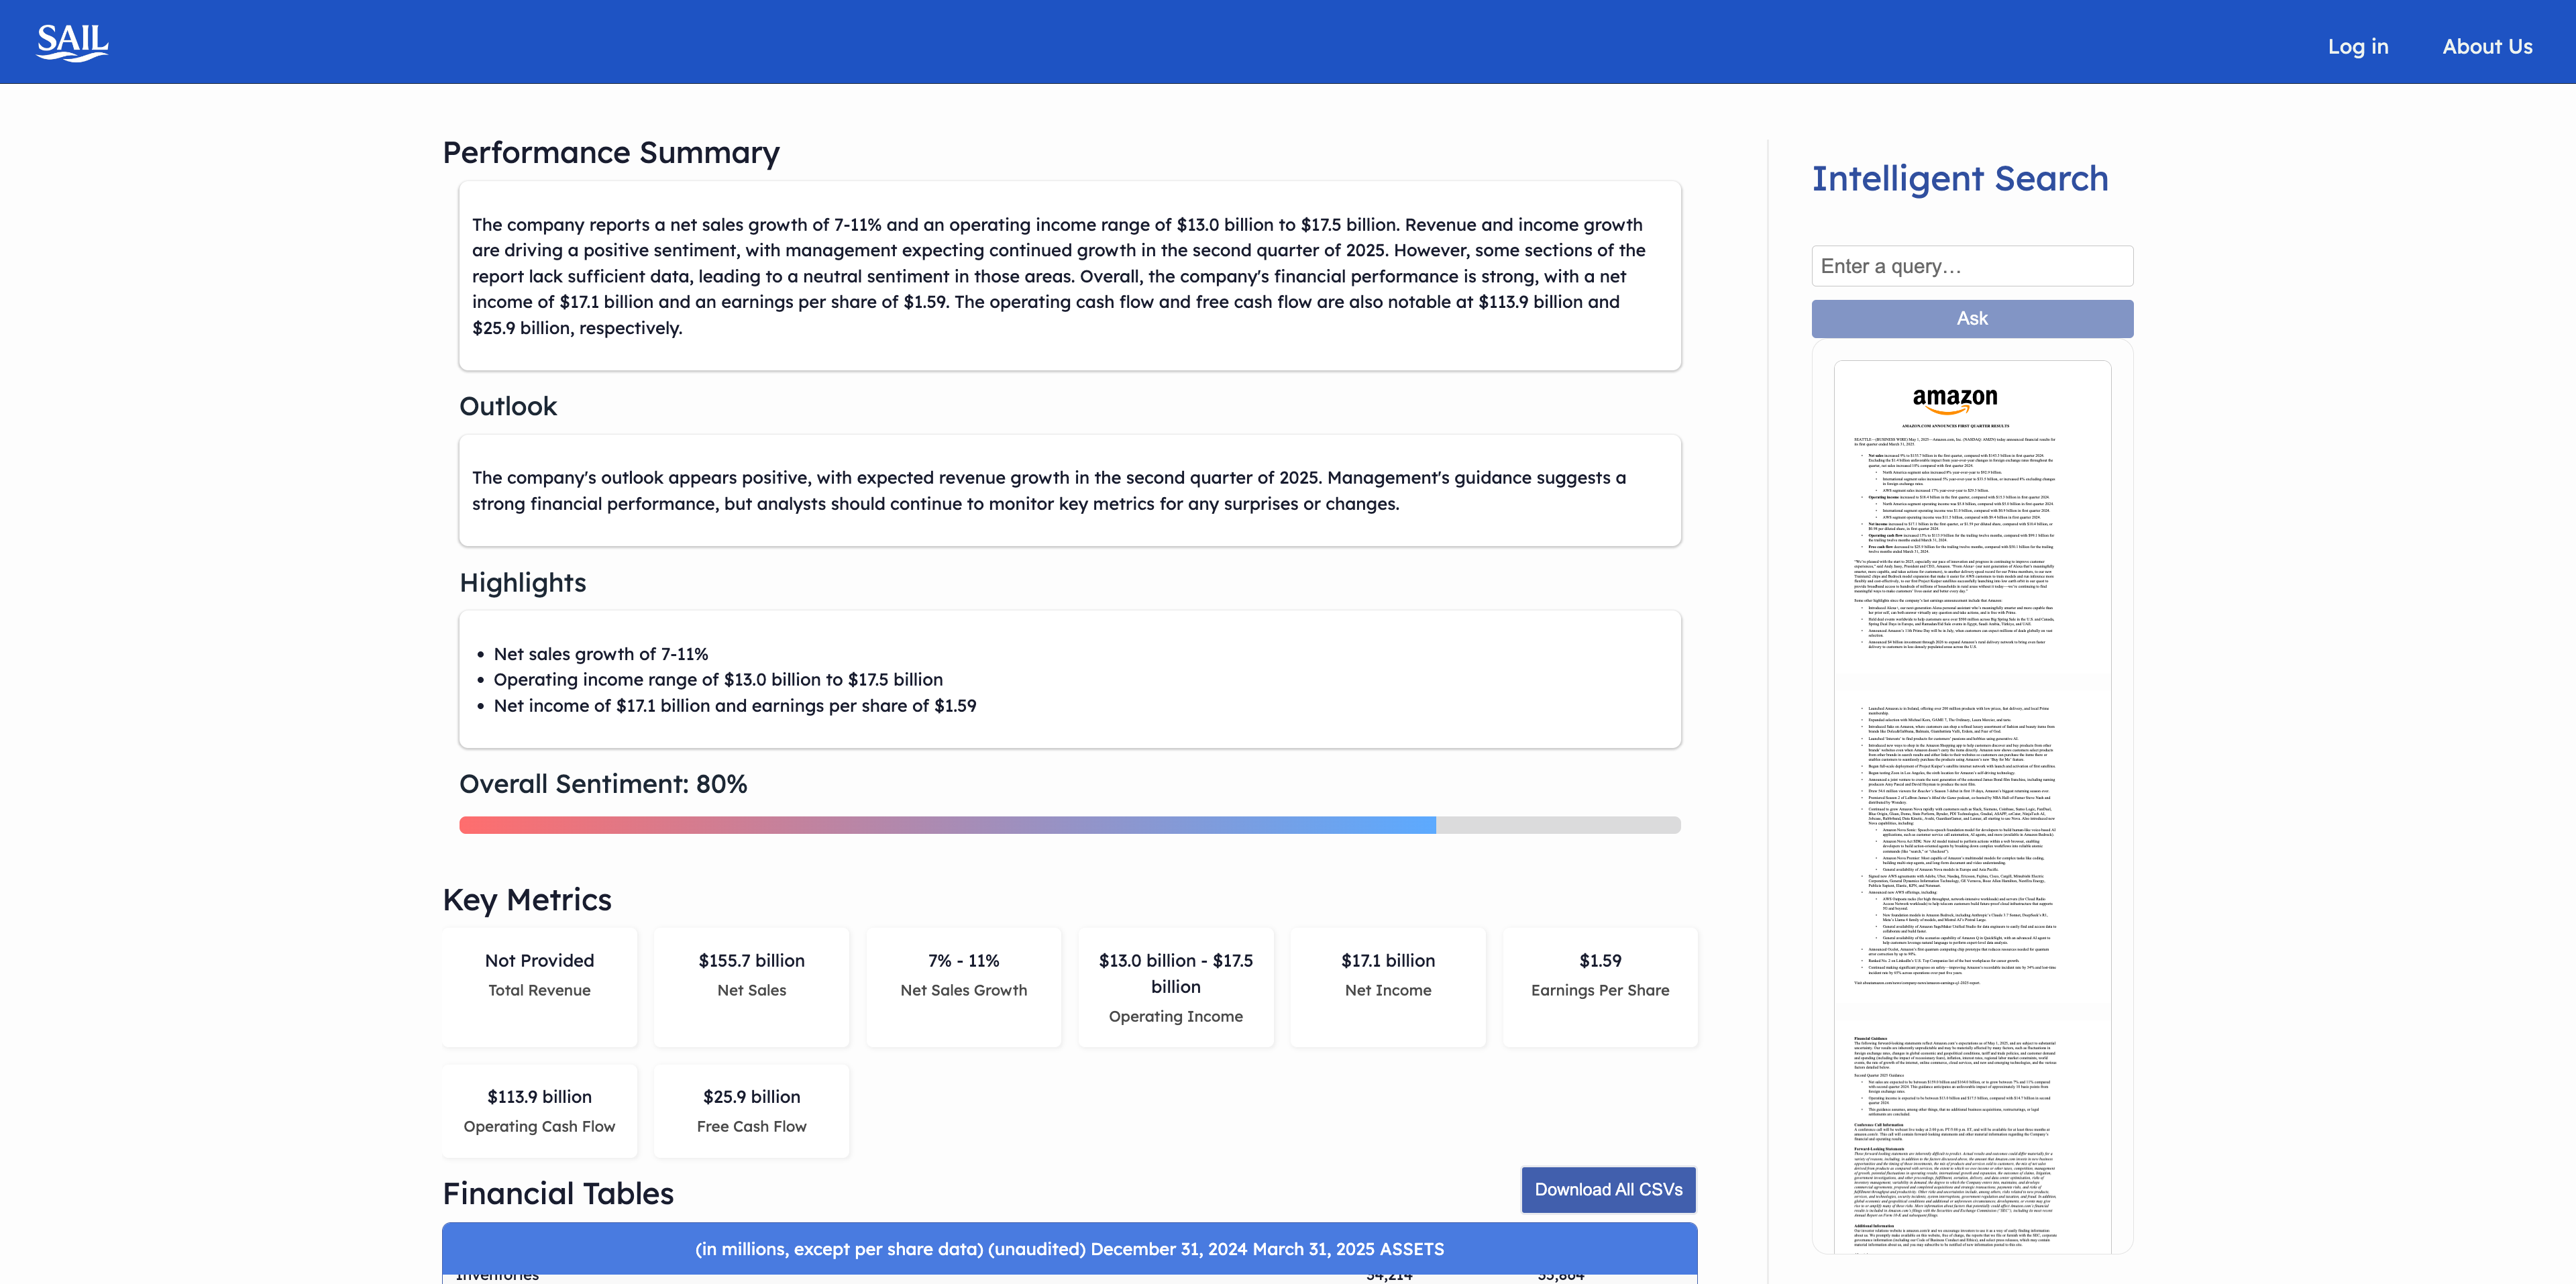
Comprehensive dashboard

Inspiration
While interviewing for AI Operations roles at several venture capital firms in New York, I kept hearing the same pain point: analysts were drowning in unstructured financial documents—earnings releases, 10-Qs, and investor slide decks—and spending countless hours copy-pasting tables into spreadsheets and manually digging through reports to extract KPIs and forward-looking insights.
After speaking with over a dozen investment teams across Manhattan and the Bay Area, it became clear this wasn’t just a nuisance—it was a widespread, systemic inefficiency. Firms were eager to bring AI into their internal workflows but lacked tailored tools to handle the complexity of financial documents.
That’s where the idea for SAIL was born. I teamed up with Hugo to build a platform that makes financial documents not just searchable—but explorable. With SAIL, we set out to automate the grunt work and help analysts focus on insight. Our product vision is simple: make financial documents as easy to navigate and analyze as a conversation.
What SAIL Does
SAIL transforms the way you work with financial documents by turning static PDFs into an interactive insights engine. Instead of wrestling with tables and footnotes, you can dive right into the numbers, ask natural-language questions, and get precise, citation-backed answers in seconds.
Imagine uploading an earnings release and instantly seeing all of your key metrics—revenue breakdowns, margin trends, EPS movements—laid out in clean, scrollable tables alongside your original PDF. You don’t need to hunt through dozens of pages or manually convert columns; SAIL surfaces the data you need and lets you click through to the exact source.
Why this matters for your team
- Faster Analysis: What once took hours of manual extraction now happens in minutes, so you can focus on interpretation, not formatting.
- Smarter Questions: Ask “Which segment grew fastest this quarter?” or “Show me YoY constant-currency revenue trends,” and get answers that cite the precise table and page.
- Seamless Collaboration: Export CSVs, share dashboard links, or embed SAIL outputs in your BI tools to keep everyone aligned.
Core Use Cases
Earnings-Season Deep Dives
Rapidly compare Q-over-Q metrics across regions or business lines without leaving your browser.Peer Benchmarking & Sector Screens
On-the-fly side-by-side analyses of competitors’ KPIs, cost structures, and growth drivers.Audit & Compliance Reviews
Trace every figure back to its PDF origin—eliminate manual footnoting and streamline sign-off.Portfolio Monitoring & Alerts
Automate KPI tracking so you’re immediately notified if any metric deviates from plan.Investor-Deck Preparation
Pull live, properly formatted data into slides with a single click—no copy-paste required.
With SAIL, complex financial data becomes as intuitive as a conversation, empowering your team to move from raw numbers to strategic insights faster than ever.
How We Built It
Under the hood, SAIL is a modular, end-to-end pipeline combining the best of computer vision, NLP, and modern web frameworks:
PDF Ingestion & Layout Analysis
- Detectron2 + LayoutParser to detect tables, figures, and text blocks in each page image.
- pdfplumber & Tabula-Py for row-and-column extraction, feeding off the detected bounding boxes.
- A custom “table cleaner” in Python (using
pandasandrapidfuzz) to align multi-line headers, drop empty columns, normalize number formats, and reunify split rows.
- Detectron2 + LayoutParser to detect tables, figures, and text blocks in each page image.
Narrative Chunking & KPI Extraction
- Entire document text is pulled via
pdfplumber, then split into ~1,500-token chunks with LangChain’sTokenTextSplitter. - Each chunk is passed through a LangChain map-reduce chain:
- A PromptTemplate guides a ChatGroq (“Llama-3.3-70B-Versatile”) call to extract KPIs, sentiment, and guidance.
- rapidfuzz deduplication folds similar KPI names (e.g. “operating income” vs. “operating profit”) into canonical metrics.
- A PromptTemplate guides a ChatGroq (“Llama-3.3-70B-Versatile”) call to extract KPIs, sentiment, and guidance.
- Entire document text is pulled via
Vector Store & RAG Agent
- All chunks and cleaned tables are upserted into a Chroma vector database with HuggingFace
all-MiniLM-L6-v2embeddings. - At query time, a metadata-aware retriever uses Maximal Marginal Relevance (MMR) to fetch diverse, relevant chunks.
- A final Groq-powered LLM call synthesizes the answer, citing table titles and “chunk_id”s for auditability.
- All chunks and cleaned tables are upserted into a Chroma vector database with HuggingFace
Backend & API Layer
- Flask with CORS support serves three core endpoints:
/submithandles PDF upload or Sonar-driven download, kicks off the extraction pipeline, and caches results tobackend/outputs./resultsreturns the last processed JSON (KPIs, tables, overall analysis)./queryroutes user questions into the RAG agent, returning citation-backed answers.
- Environment & secrets via python-dotenv, logging to console, and automatic model key pickup (
GROQ_API_KEY,SONAR_API_KEY).
- Flask with CORS support serves three core endpoints:
Frontend & UX
- React + Vite for a blazing-fast SPA, with:
- A PDF.js-based viewer that scrolls directly to cited pages.
- A resizable, draggable split pane between the dashboard and intelligent search sidebar.
- Components for KPIs, summary, tables, and overall analysis, all styled in the “SAIL” white-and-blue theme (CSS Modules).
- A PDF.js-based viewer that scrolls directly to cited pages.
- Downloadable CSV export for all tables or individual tables, enabling easy integration with Excel or BI tools.
- React + Vite for a blazing-fast SPA, with:
DevOps & Performance
- Pipeline steps are cached to JSON, so repeated runs on the same PDF complete in <1 s.
- Docker-friendly code structure (backend in
services/, frontend insrc/), ready for Kubernetes or serverless deployment. - Thorough automated tests in
tests/ensure each extraction, analysis, and API contract works under CI.
- Pipeline steps are cached to JSON, so repeated runs on the same PDF complete in <1 s.
By composing specialized open-source tools and state-of-the-art LLMs in a clear, maintainable architecture, we built SAIL to be both highly performant and easily extensible—from swapping in a new vision model to plugging in alternative embeddings.
Accomplishments That We’re Proud Of
End-to-End Automation
We built a fully automated pipeline—from PDF ingestion and table detection to RAG-powered question answering—that turns static earnings releases into an interactive analytics hub with a single click.Sub-Second Query Responses
By caching extracted JSON and tuning our Chroma vector store + MMR retriever, ad-hoc natural-language queries against 50+-page reports now complete in under one second.Citation-Backed Answers
Every insight our LLM returns is footnoted with the exact table title and page number, giving users full transparency and auditability in their decision-making.Seamless UX & Export
Our React frontend combines a draggable split-pane PDF viewer, scroll-to-page highlights, downloadable per-table and “Download All” CSVs, and a clean SAIL theme—so analysts spend zero time fiddling with formatting.Open, Modular Architecture
We’ve packaged each step (layout analysis, table cleaning, chunk-analysis, vector DB, RAG agent, frontend) into decoupled services and components—making it easy to swap in better OCR, embeddings, or models in the future.
What We Learned
Tables Are Tricky
Real-world financial PDFs come with merged headers, split cells, footnotes and captions. Combining Detectron2→tabula→pand as cleaning steps taught us that no single tool “just works”—you need layered heuristics and an LLM-guided cleanup.Prompt Engineering Matters
Even with a 70B-param model, careful prompt design and output parsing (JSON schemas, score-thresholded reranking) were critical to reliable KPI extraction and overall summarization.Metadata Is King
Adding simple labels liketable_title,page, and content type let us filter and rerank retrieval results far more accurately than naïve similarity search alone.Caching Makes a Difference
Persisting extracted JSON means repeat users get almost “instant” load times. Investing in idempotent, file-based caching shaved seconds off our pipeline and dramatically improved UX.UX Details Matter
Features like draggable resizers, scroll-to-page highlights, and in-app CSV download turned a prototype into something analysts actually love.
What’s Next for SAIL
- Multi-Document & Peer Benchmarking
— Compare metrics side-by-side across companies or time periods, with normalized charts and interactive filtering. - Real-Time Alerts & Watchlists
— Let users subscribe to KPIs or sentiment changes and receive Slack/email/SMS notifications when thresholds are crossed. - Enhanced Collaboration
— Shared workspaces, annotation tools, comment threads, and versioning so teams can co-author analyses. - AI-Driven Insights
— Integrate forecasting, anomaly detection, and “what-if” scenarios powered by fine-tuned LLMs and time-series models. - Enterprise Integration
— Provide a REST/GraphQL API, SSO, audit logs, and connectors to BI platforms (Tableau, Power BI) so SAIL can slot into any corporate workflow.
SAIL is just getting started—our mission is to make financial flows feel as intuitive as a conversation and 10x analyst productivity, and these next steps will keep pushing that frontier.

Log in or sign up for Devpost to join the conversation.