Inspiration
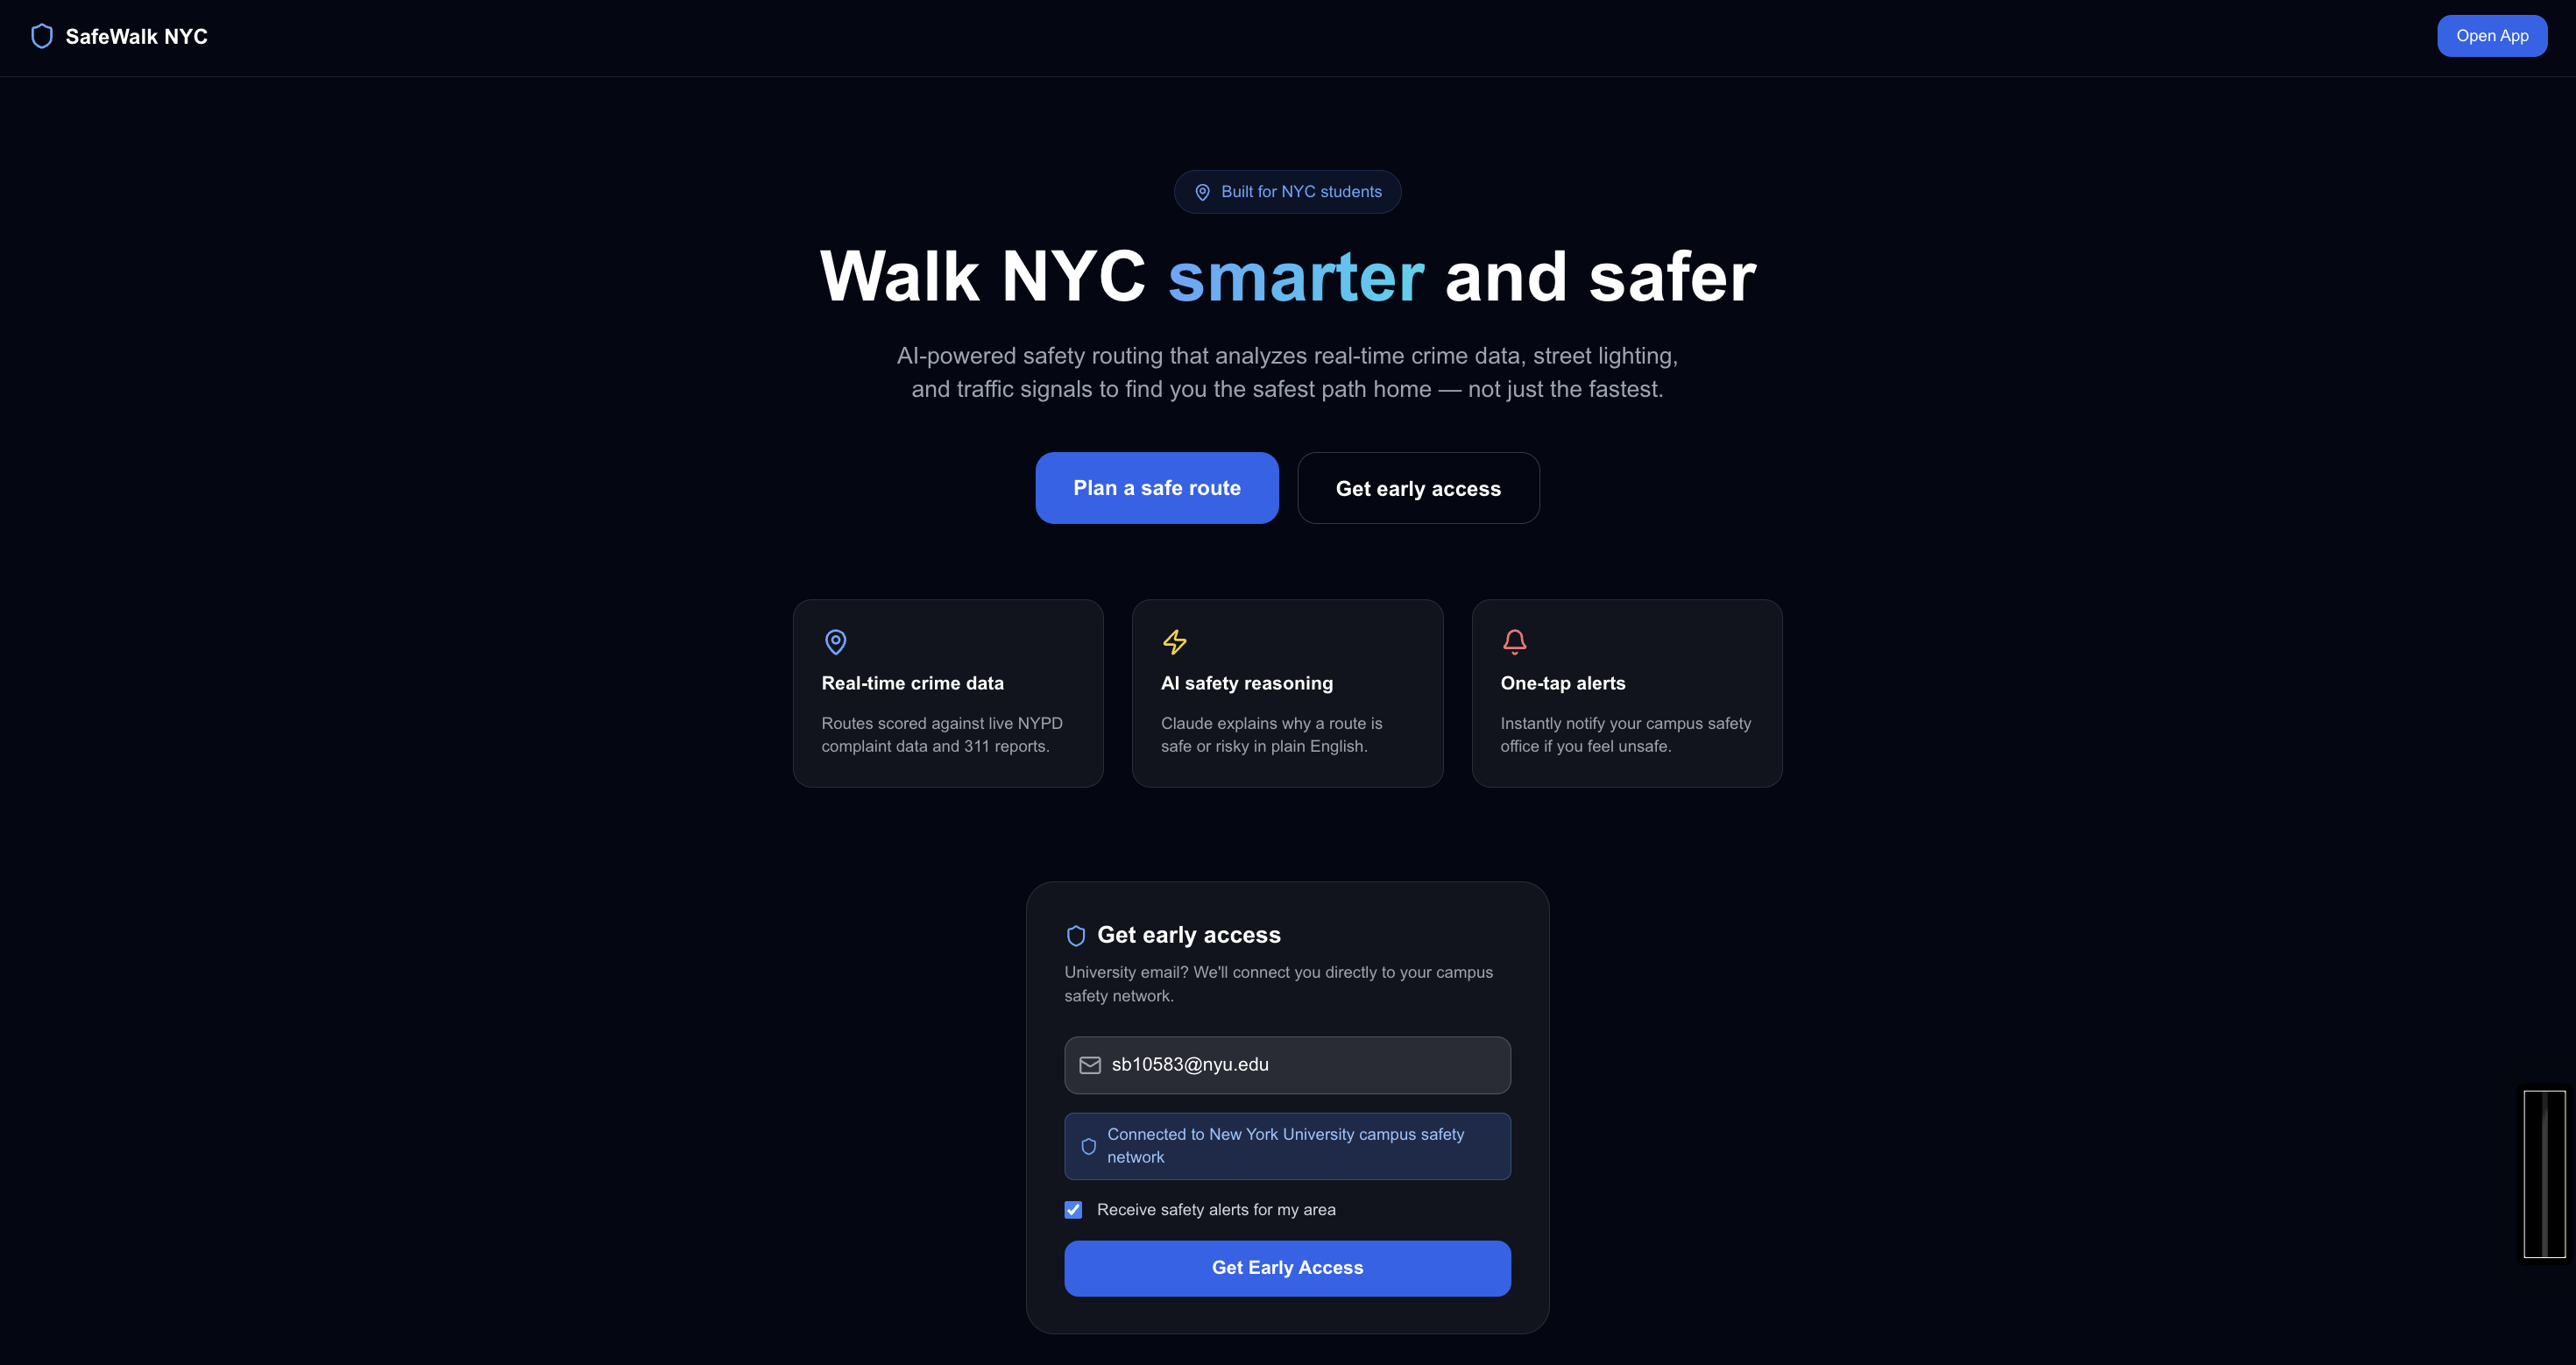
It starts with a feeling most NYC students know well: stepping out of Butler Library at midnight, phone in hand, opening Google Maps, and getting a route that looks fine on paper — until you're halfway down Amsterdam Avenue and realize two streetlights are out, the block feels empty, and you're alone. Google Maps optimizes for speed. Nobody optimizes for safety. We're a team of Columbia and NYU students. We've all taken those walks. We've all had that moment of "I should have gone a different way." The question that started this project was simple: what if your routing app actually knew what you knew — that some blocks feel safer than others — and could back that instinct up with real data? That question became SafeWalk NYC.
What it does
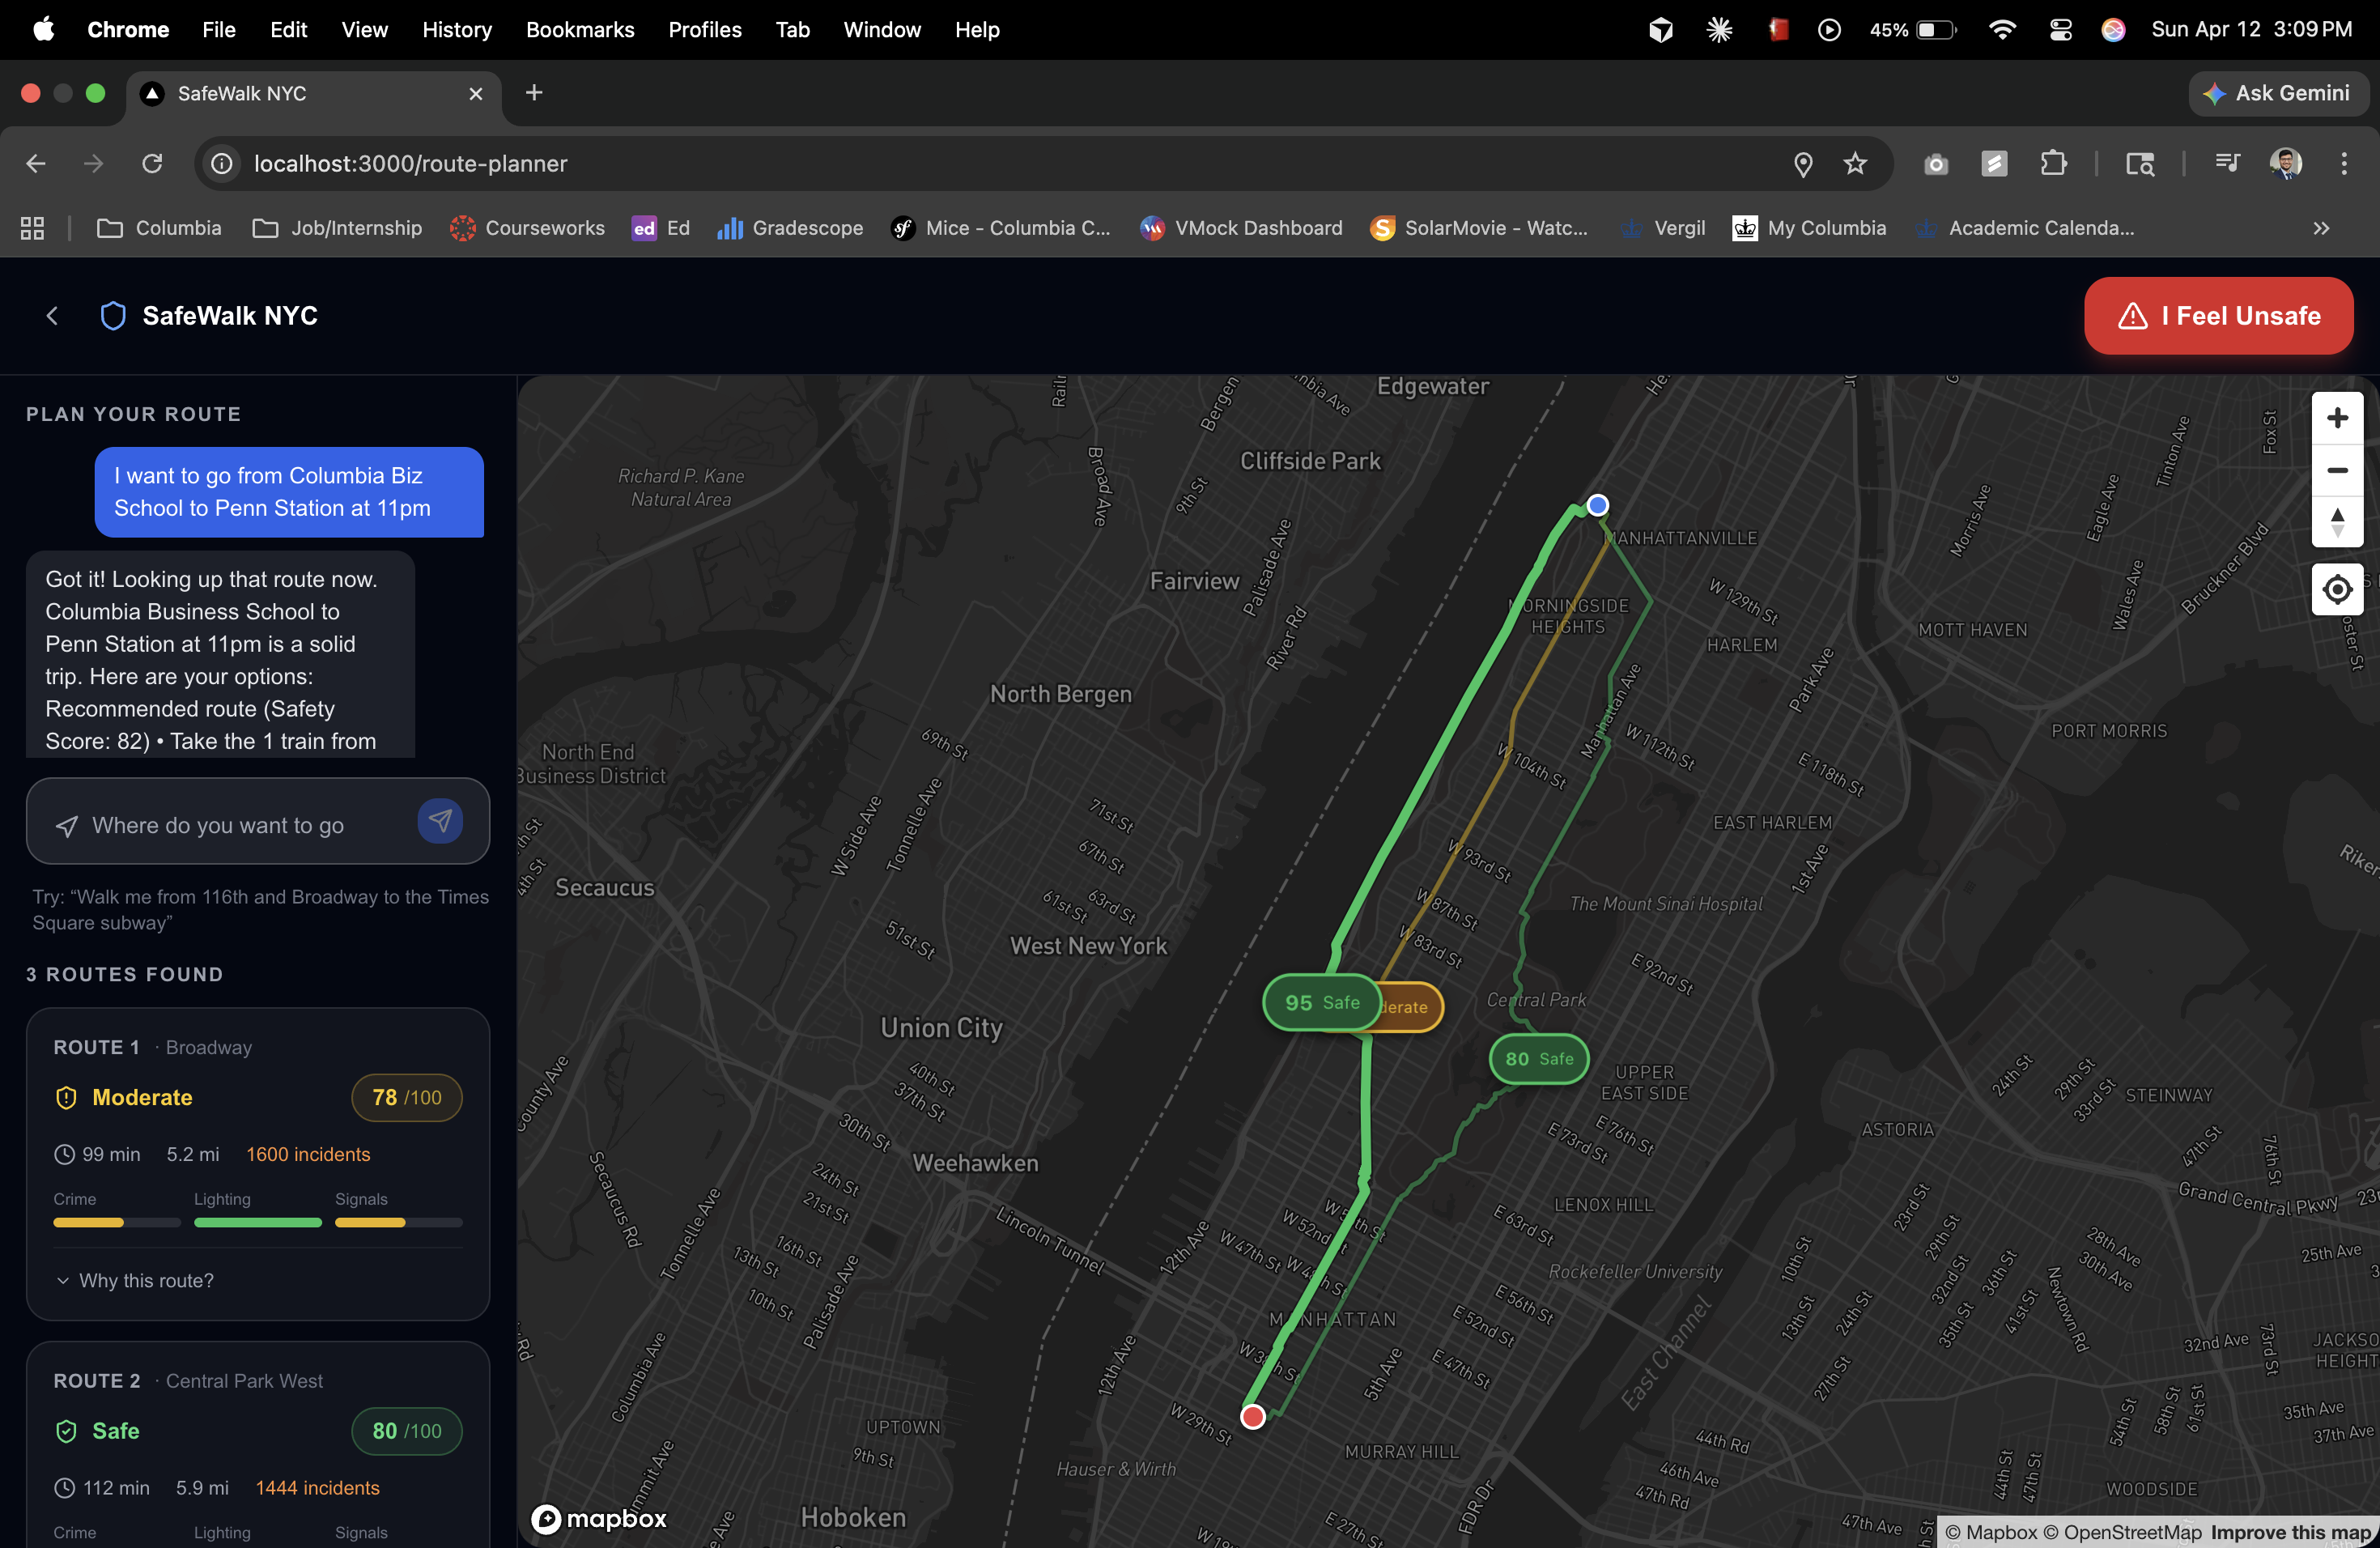
SafeWalk NYC is a real-time safe walking route navigator built specifically for NYC students walking home at night. Instead of optimizing for the fastest route, it optimizes for the safest one. A user types their origin and destination — or just describes it naturally ("I'm walking from Butler to 110th and Amsterdam, it's 11:30pm") — and SafeWalk:
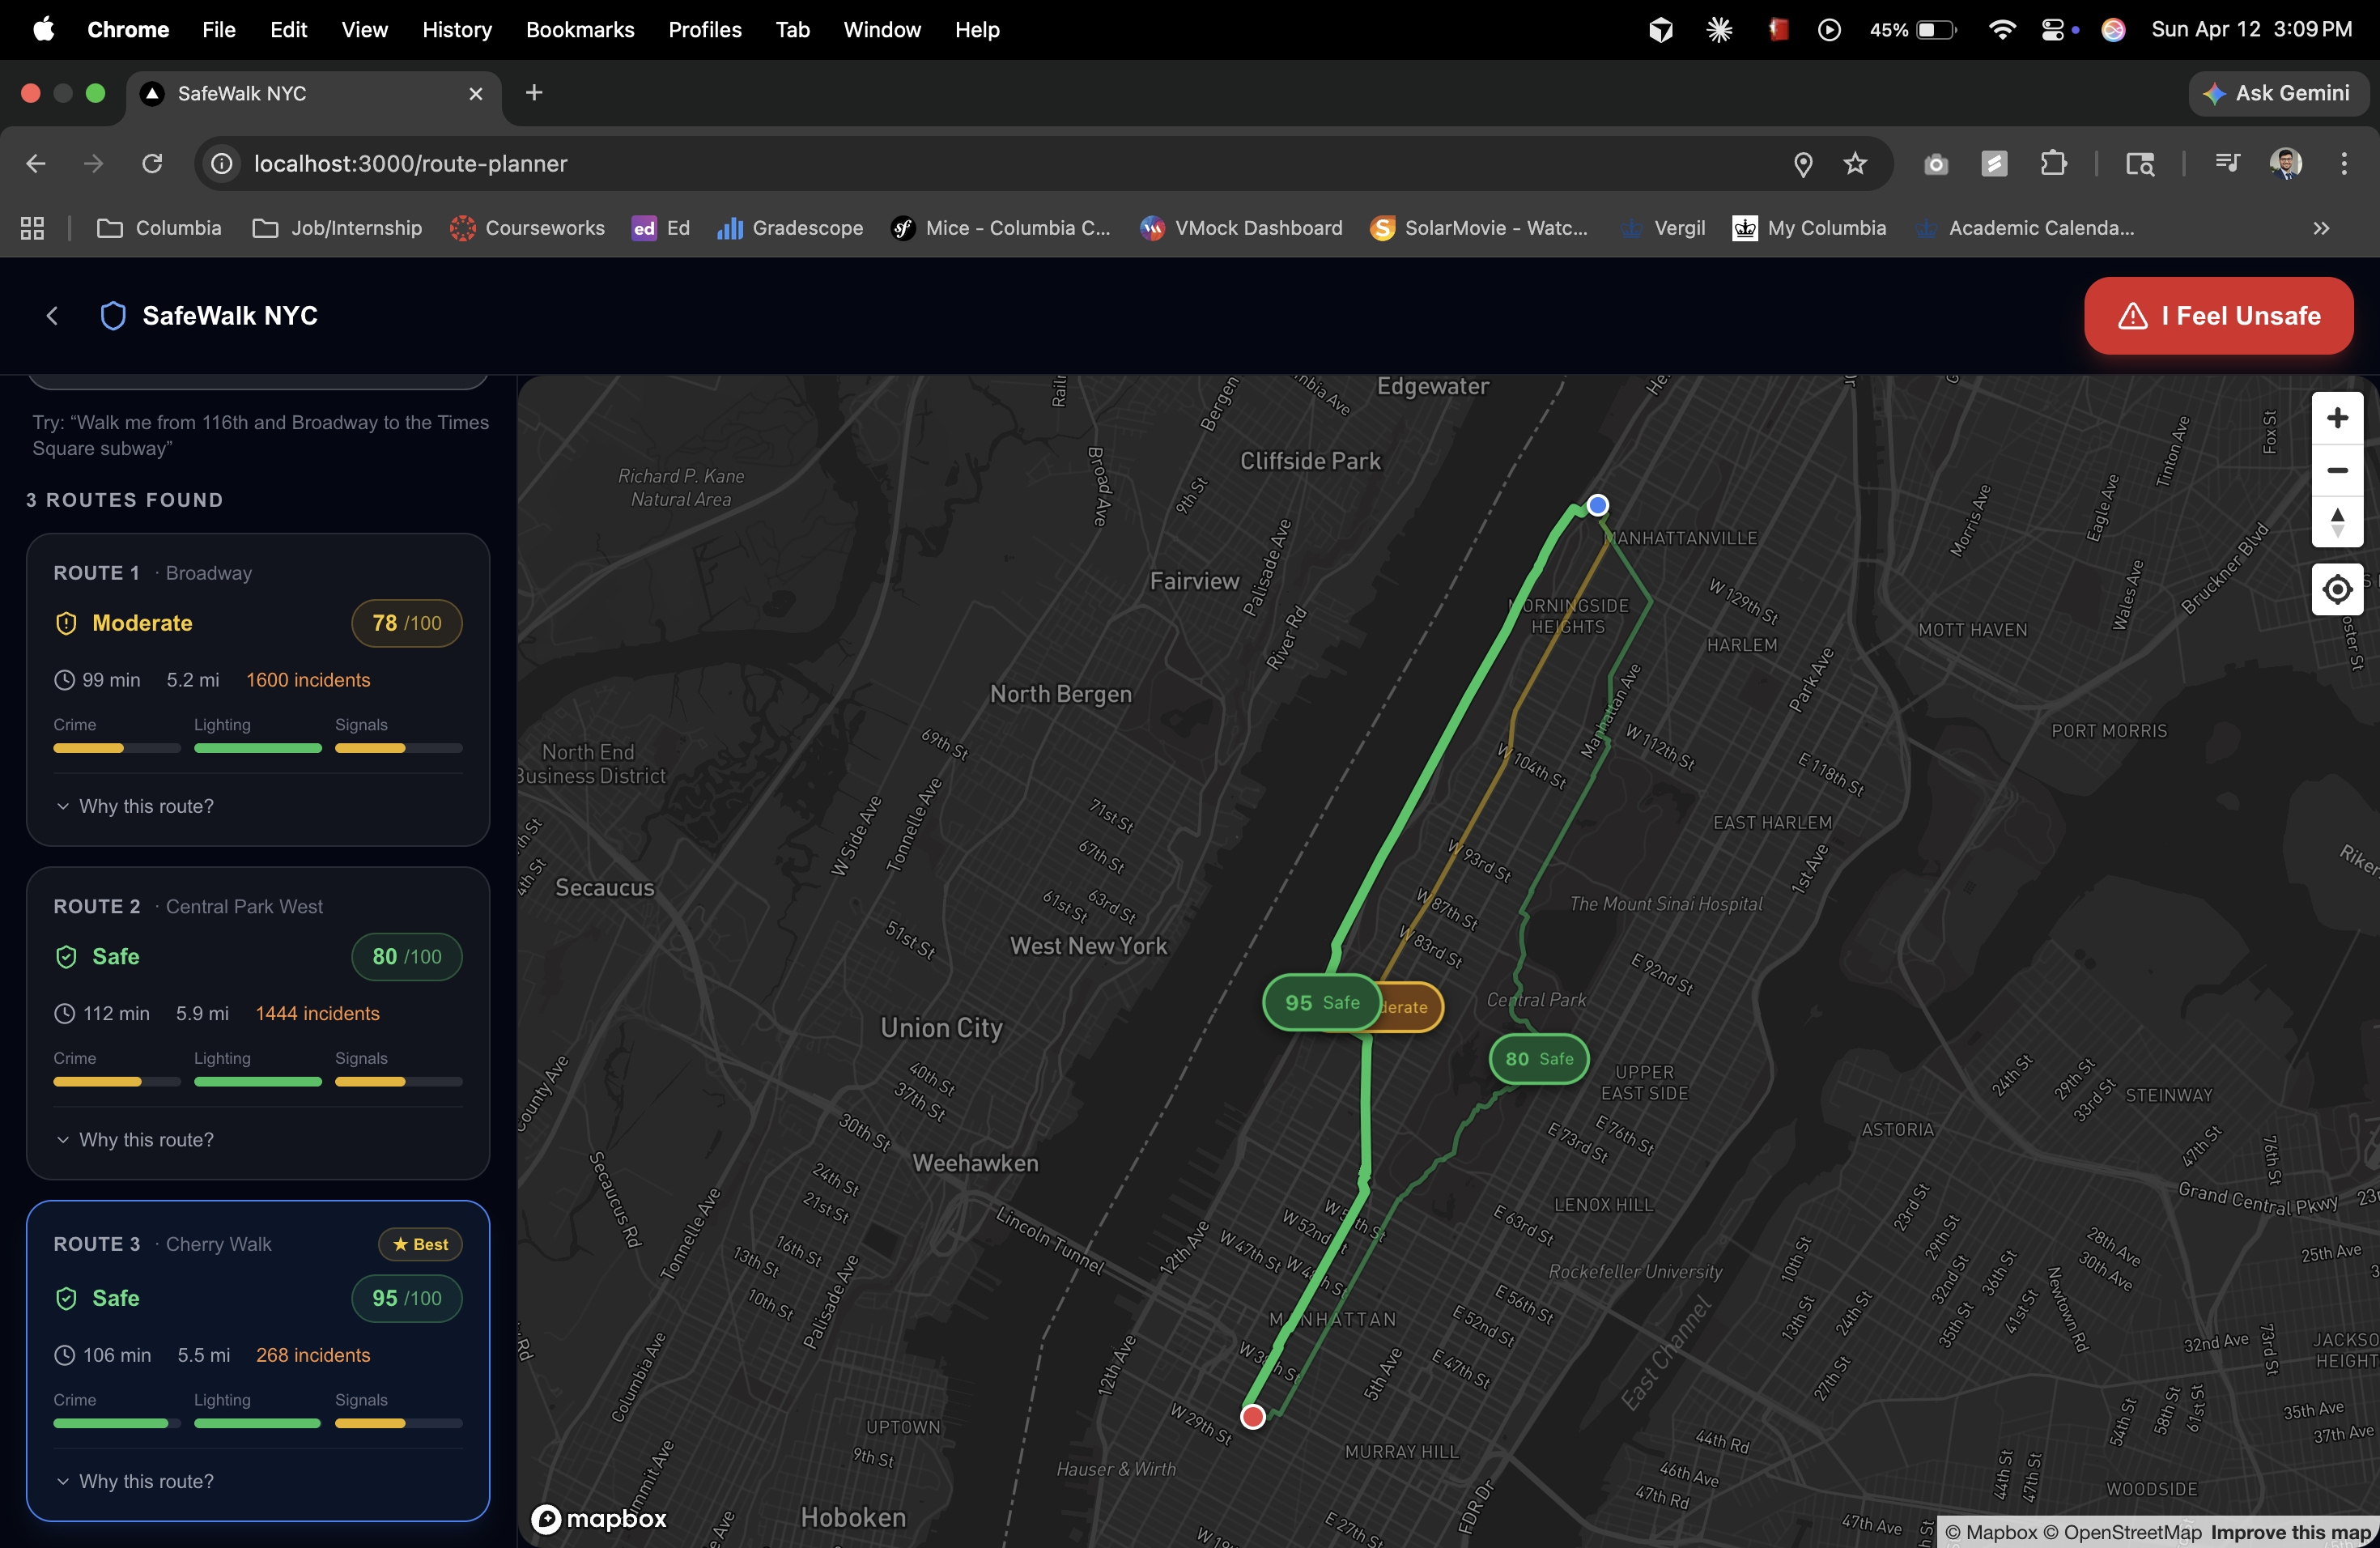
Generates 2–3 candidate walking routes between the two points Scores every 200m segment of each route across four safety signals:
🚨 NYPD incident data (last 90 days, weighted by severity and recency) 🔦 NYC 311 streetlight outage complaints (open vs. closed) 📡 Real-time news and alerts via Linkup (construction closures, transit disruptions, breaking incidents) 🚦 Traffic signal density (signalized intersections = safer crossings at night)
Displays color-coded routes on a dark Mapbox map — green for safe, amber for caution, red for risky Explains the recommendation in plain English via Claude: "I'm routing you via Broadway instead of Amsterdam — Broadway has active storefronts open until midnight and two signalized intersections. Amsterdam has two open 311 streetlight complaints and one reported incident in the last 30 days." Routes emergency alerts based on your university email — Columbia students get one-tap calling to Campus Public Safety (212-854-5555), NYU students get NYU Campus Safety (212-998-2222) plus Safe Ride booking during late-night hours
How we built it
Architecture: Multi-Agent AI Pipeline The core of SafeWalk is a multi-agent system built with the Claude Agent SDK. Rather than making one big call to Claude, we decomposed the problem into specialized agents that each own one piece of the reasoning:
Route Agent — fetches 2–3 pedestrian route alternatives via the Valhalla open-source routing engine and splits each into 200m segments Crime Agent — queries the NYPD Complaint dataset on NYC Open Data (Socrata API) for incidents near each segment, weighted by offense severity and recency Infrastructure Agent — pulls NYC 311 streetlight outage complaints and calls the Linkup search API for real-time news, transit alerts, and breaking incidents along the route corridor Scorer Agent — applies the composite safety formula to produce a 0–100 score per segment and per route Explainer Agent — passes all scored data to Claude, which generates a concise, specific, human-readable explanation referencing actual street names and data points
Stack:
Frontend: React + Vite, Mapbox GL JS (dark style), Tailwind CSS Backend: Python FastAPI, async httpx AI: Anthropic Claude (claude-3-5-haiku-20241022) via the Claude Agent SDK Real-time data: Linkup API (standard depth, NYC-filtered) Static data: NYC Open Data — NYPD Complaint Data, 311 Service Requests Routing: Valhalla pedestrian routing (open source, free) Geocoding: Nominatim (OSM) with Google Maps Geocoding as fallback
Challenges we ran into
Data quality and coordinate filtering was harder than expected. The NYPD dataset has lat/lng on most records but not all — we had to handle nulls and fall back to borough-level filtering. The 311 dataset was cleaner but required careful complaint type filtering to isolate streetlight issues from noise. Nominatim rate limiting caught us off guard. OpenStreetMap's geocoding API enforces a strict 1 request/second limit, and we were firing both origin and destination lookups simultaneously. We added async delays and a Google Maps Geocoding fallback that solved it cleanly. Making Claude's explanation feel grounded and not hallucinated required careful prompt engineering. We pass Claude the full structured data — exact incident counts, complaint statuses, street names, scores — and instruct it never to infer beyond what it's given. The result is explanations that feel authoritative because they are — every sentence maps to a real data point. Time constraint. We had 5.5 hours. Every architecture decision was made with "can we demo this in 2 minutes?" as the tiebreaker.
Accomplishments that we're proud of
The multi-agent architecture actually works end-to-end. Five specialized agents hand off to each other asynchronously, and the pipeline produces a scored, explained route in under 4 seconds. Real data, not mock data. Every crime incident, every streetlight complaint, every Linkup alert in our demo is pulled live from real APIs at request time. The university email routing feature. When a Columbia student taps "I Feel Unsafe," the app auto-detects the nearest Columbia campus from GPS coordinates and surfaces the right emergency line — not a generic 911 call. That's the kind of detail that makes a tool feel built for you. The dark map + color-coded routes. Showing a nighttime safety app on a dark map with green and red route overlays makes the value proposition immediately legible — no explanation needed.
What we learned
Agentic decomposition beats monolithic prompts. Breaking the problem into specialized agents made each piece easier to debug, test, and improve. When the crime scoring was wrong, we fixed one agent. When Claude's explanation drifted, we tightened one prompt. NYC Open Data is genuinely powerful — and genuinely messy. The data is there, it's free, and it's real. But cleaning it, filtering it, and making it useful for a geospatial use case takes real engineering work. Linkup fills a gap that static datasets can't. No dataset captures a water main break from this morning or a transit closure from an hour ago. Linkup's real-time search made our app feel alive in a way no cached dataset could. Demo script is a product decision. We wrote the demo script before we wrote the frontend. Knowing exactly what we needed to show — Butler Library to 110th, 11:30pm, green Broadway vs. red Amsterdam — shaped every UI decision.
What's next for SafeWalk NYC
Mobile app (React Native) — the use case is inherently mobile. Walking home means your phone is in your hand. Live location tracking — show your route progress in real time and re-score dynamically if you deviate Trusted contact sharing — one tap to share your live location and ETA with a friend or family member Crowdsourced safety reports — let users flag unsafe conditions (broken lights, suspicious activity) that feed back into the scoring model in real time Expand beyond NYC — the architecture is city-agnostic. Any city with open crime data and 311-equivalent infrastructure can run SafeWalk University partnerships — integrate directly with campus safety APIs so the emergency routing is native, not just a phone number

Log in or sign up for Devpost to join the conversation.