Inspiration
The high rates of corruption in certain police departments and many crimes that happen but don’t get reported made us want to create a solution. We also wanted to help people locate other services near them, such as healthcare, so that they can find out if the hospital is reliable/somewhere they feel comfortable getting checked out.
What it does
This website takes your location and helps you locate the nearest hospital. The map can be used worldwide and uses the user’s location. It also allows the user to use markers and input their own latitude and longitude. It also performs another function; you can report crimes through a form and we plan to use this new data to find trends.
How we built it
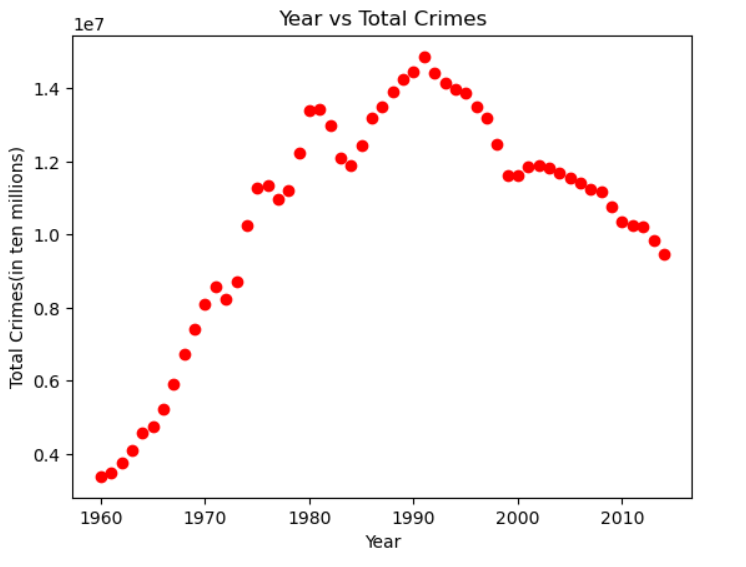
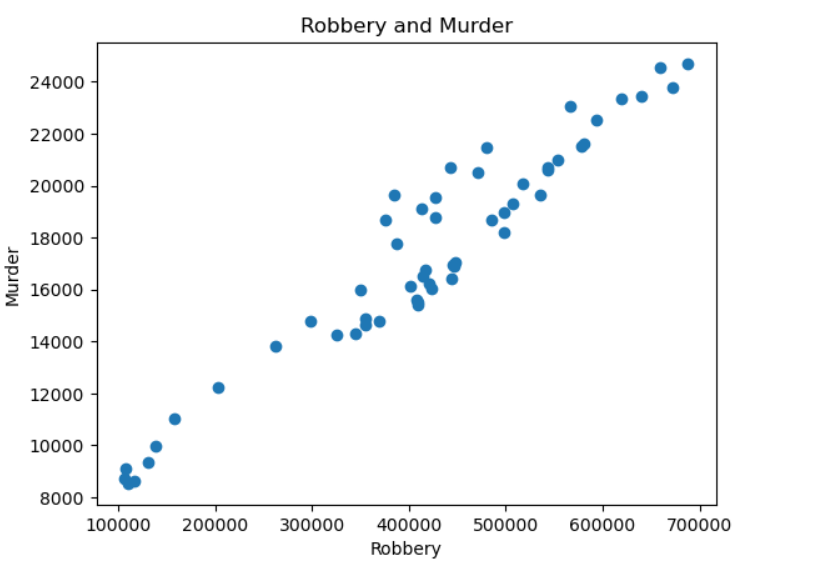
The beginning and the ending pages were created with HTML. We used an interactive map (the Leaflet JS API), to find nearby hospitals and the user’s location. We used HTML to create a form, in which users said their name and their zip code to report crime. For the remainder of the code, we used Python. We used the data and displayed the number of times a user has inputted this zip code. The zip code counts will be displayed according to a specific crime. We also searched for a dataset and used it to find correlations between different features, such as the year, the number of crimes, and the type of crime. We finally created a few scatterplots to represent the highly correlated data.
Challenges we ran into
A lot of the APIs that we wanted to use for the healthcare map required you to pay. This prevented us from having a feature that showed the review of the hospitals, the cost, and other necessary information. Additionally, it was difficult to merge the frontend and the backend as we were unaware of the program flask. Afterwards, we had to use a lot of time to learn the program and utilize the post and get functions to get the data from the form we have applied. It was difficult as we were getting unforeseen errors that did not make sense and were hard to understand. Furthermore, it was very difficult to find relevant datasets that incorporated many features that we could work with. This took a long time, but we finally found a suitable dataset and were able to create scatterplots to visualize the correlation between the features.
Accomplishments that we're proud of
We were able to successfully create an interactive map that shows hospitals near your current location, whether it’s California or even Sydney, Australia. Additionally, we were able to correlate different features to determine that especially in the United States, crime rates have peaked between 1980 and 2000, and are currently neither rising nor decreasing by much. Furthermore, we found a way to use flask to combine python and html to create our final product.
What we learned and what's next for Safety in Health
We learned that it was important to be prepared and have an idea before you start a program and make sure that you have a process. Most of us also didn’t know HTML before today, so we picked up a lot of knowledge along the way. Our next steps will include improving the user interface and making it more accessible to users in different parts of the country and world.
Built With
- flask
- github
- html
- kaggle
- leaflet.js
- python
- visual-studio-code

Log in or sign up for Devpost to join the conversation.