-
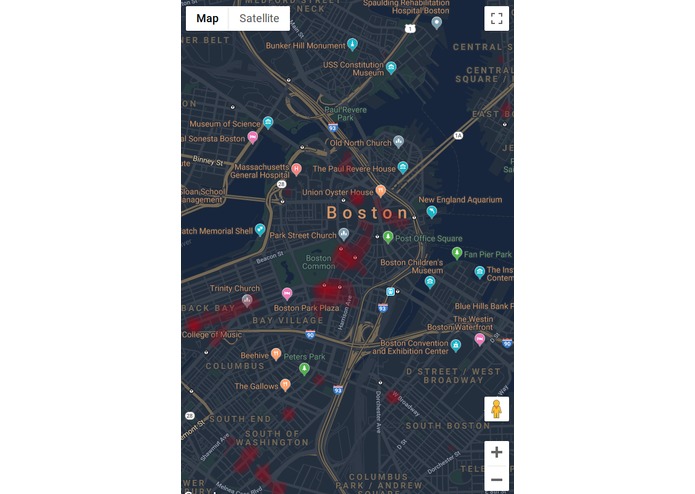
A view from mobile device
Inspiration
As first-years in a new city, there is an underlying urge to go out to explore. However, without the specific street knowledge gained from experience living in Boston, safety can be an issue not just for us but for the general populace as well.
Our Vision
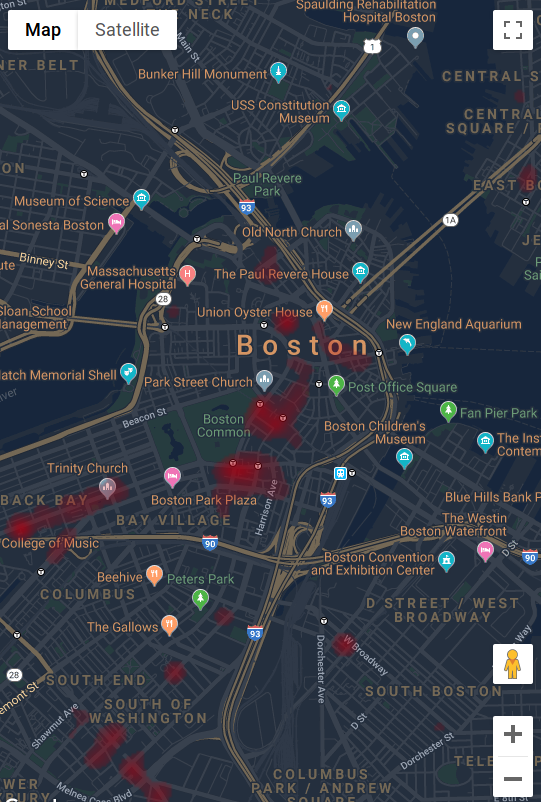
We hope to create an app that gathers data from police databases and utilizes historical data to display a heatmap of criminal activity in Boston. This app will then recommend safer areas for foot traffic and provide actual navigation instructions, avoiding areas of highly concentrated violent crime and drug related activities.
Our Process
We scraped Boston Police arrest databases and gathered a dataset. Then, we utilized a deep neural network to create a model for geospatial crime frequency data, learning to predict the relative safety of a given area. The neutral network then evaluated the data on a variety of different locations in Boston and created a custom heatmap, which we then turned into a custom Google Maps overlay.
Challenges
Our initial problem was the lack of uniformity in data structure between the variety of databases we scraped, forcing us to fallback on an amount of manual re-formatting and sorting. While there were optimization issues with the machine learning model, those were related to simple hyperparameter tuning and were overcome. The primary stumbling point was properly overlaying the crime data on the Maps rendering. As none of us had experience in android app development, it was hard trying to learn enough of it in time to fully carry out our vision.
What’s Next?
In the future, we hope to implement custom navigation instructions as well as the ability to choose different filter categories of crime.
Built With
- google-maps
- keras
- tensorflow


Log in or sign up for Devpost to join the conversation.