-
-
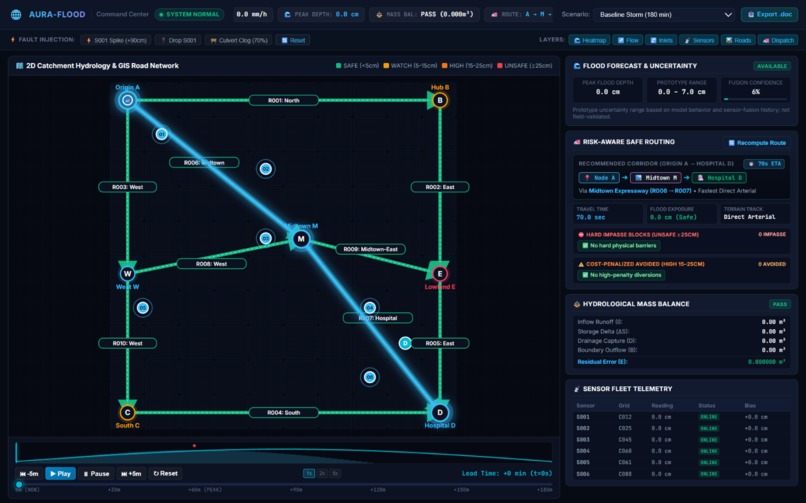
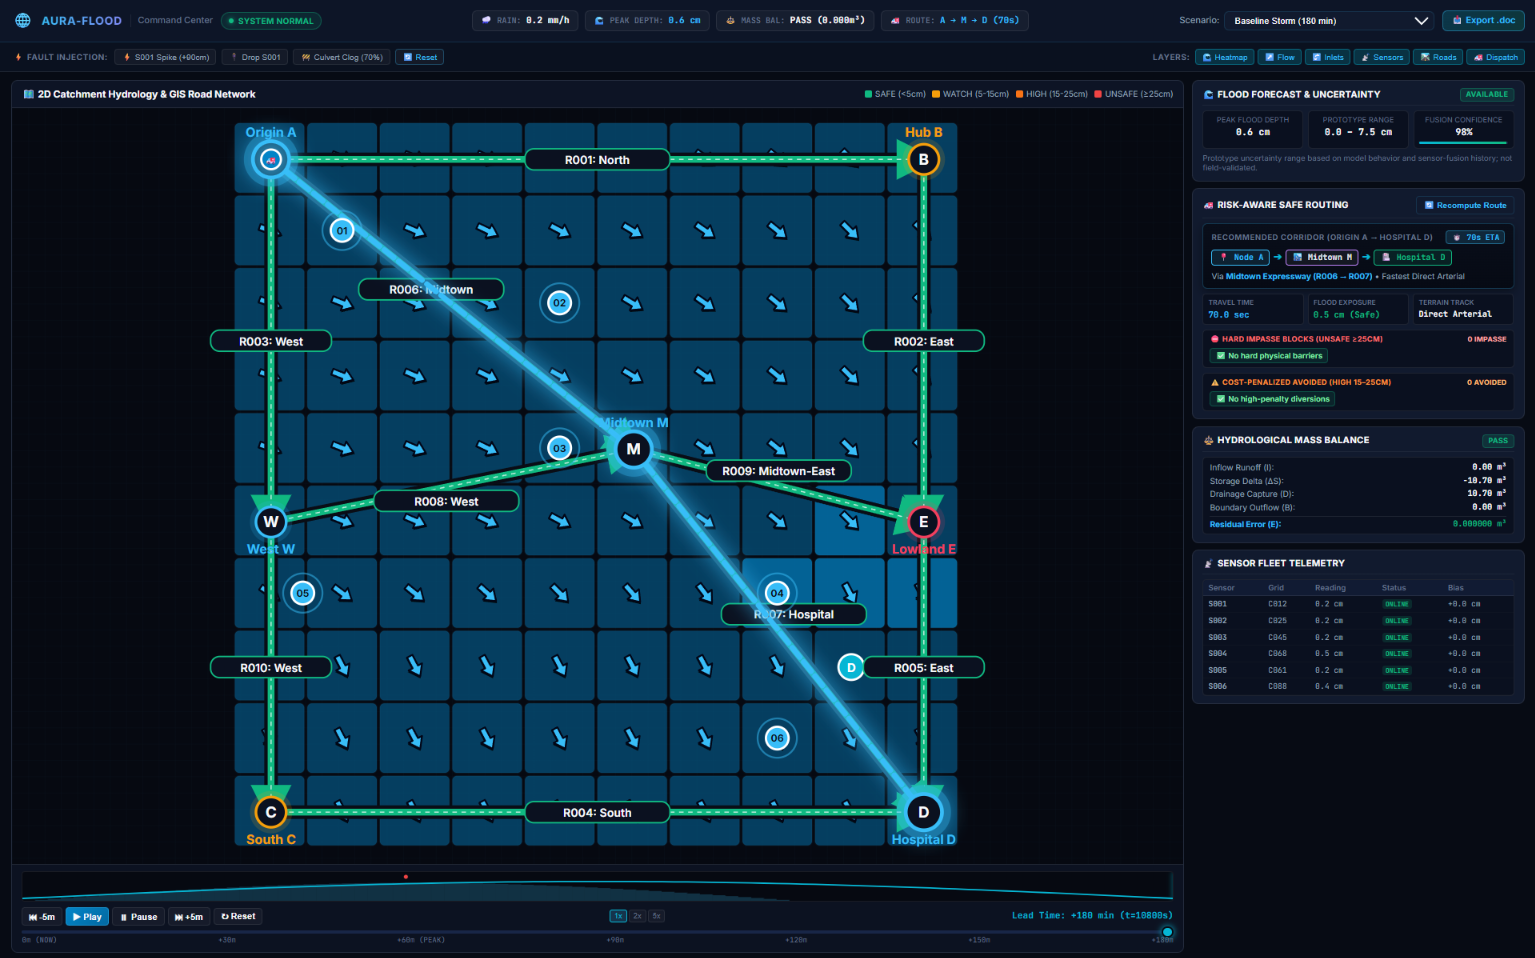
Real-time flood dashboard showing depth, road risk, sensors, drainage, uncertainty, and safe routes.
-
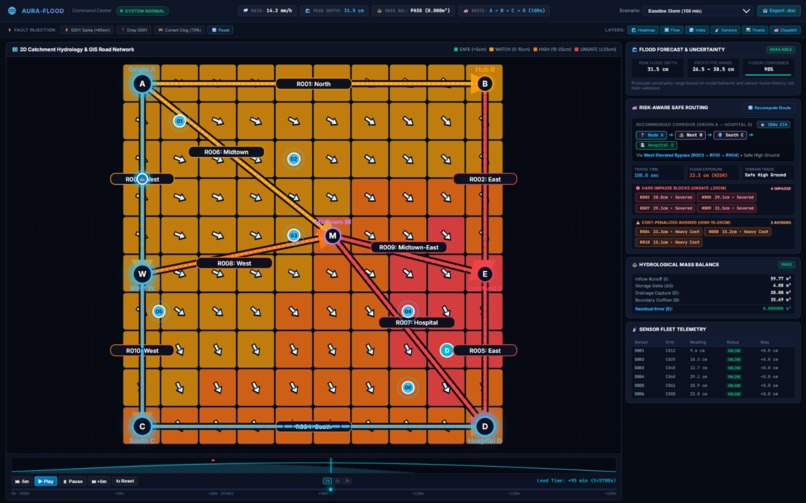
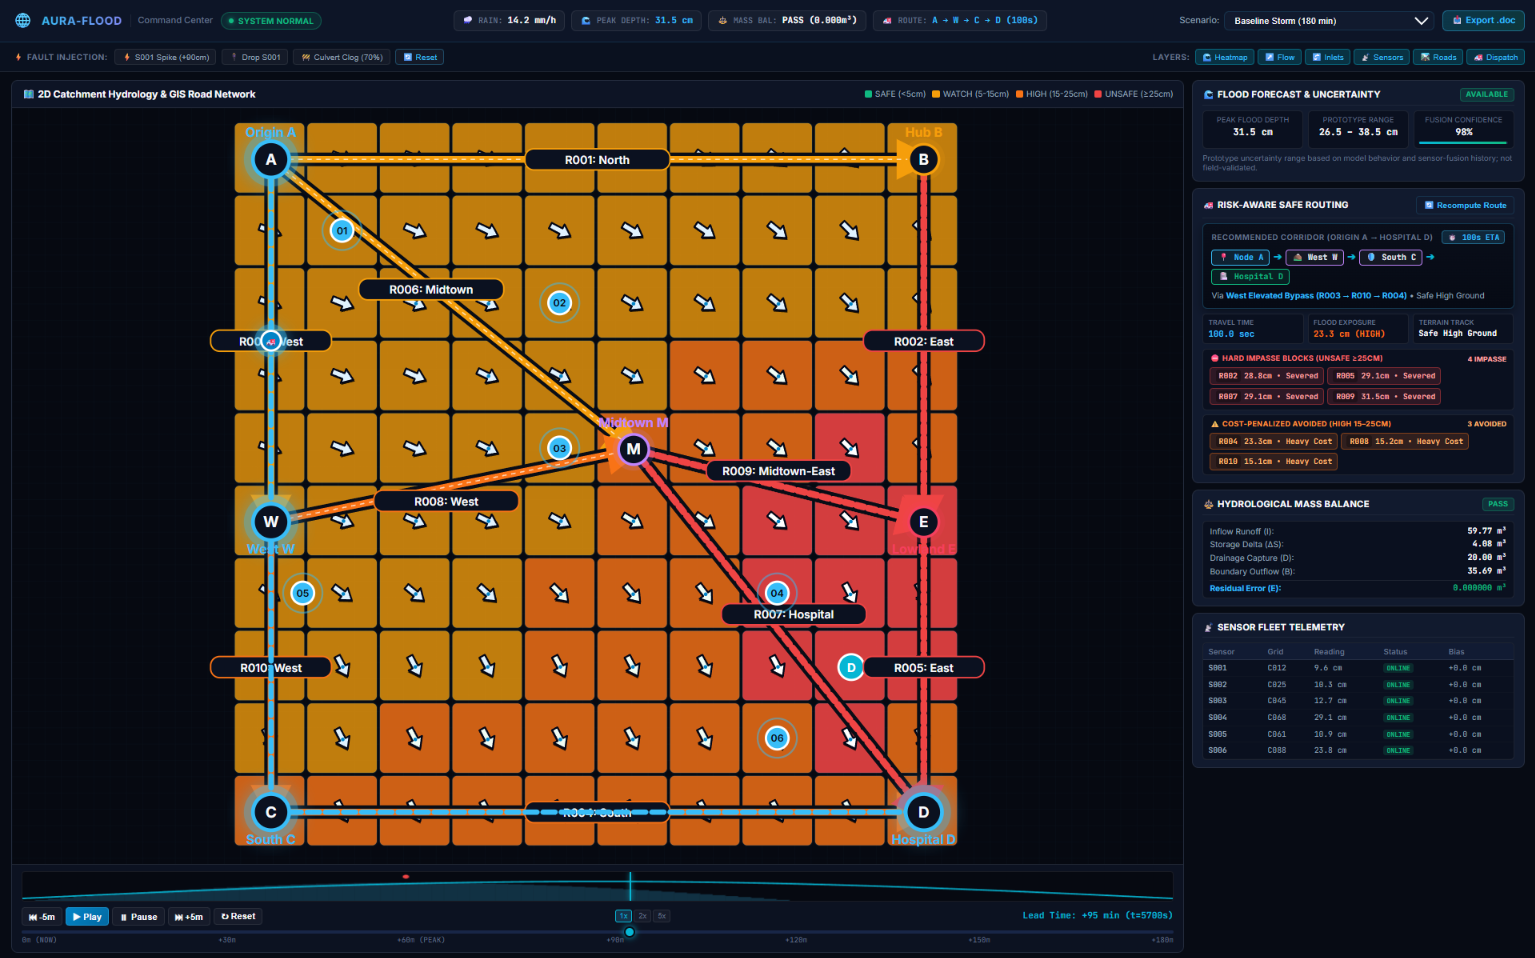
At +95 min, flood depth reaches 31.5 cm; all 6 ultrasonic sensors are working and reporting live readings.
-
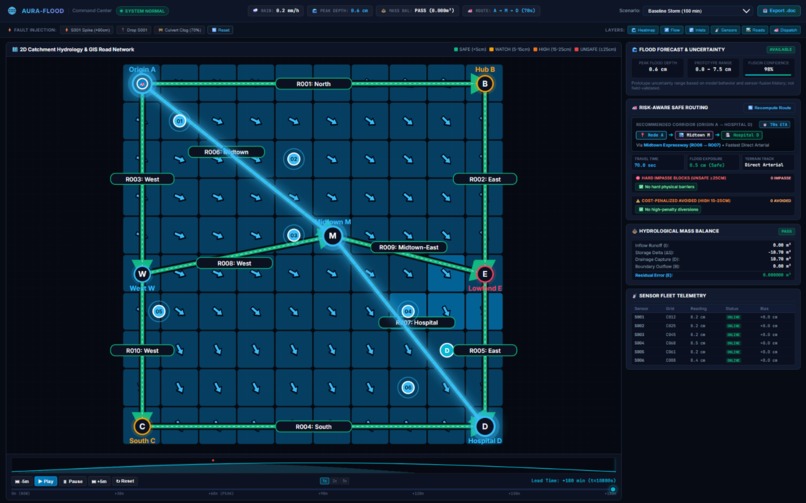
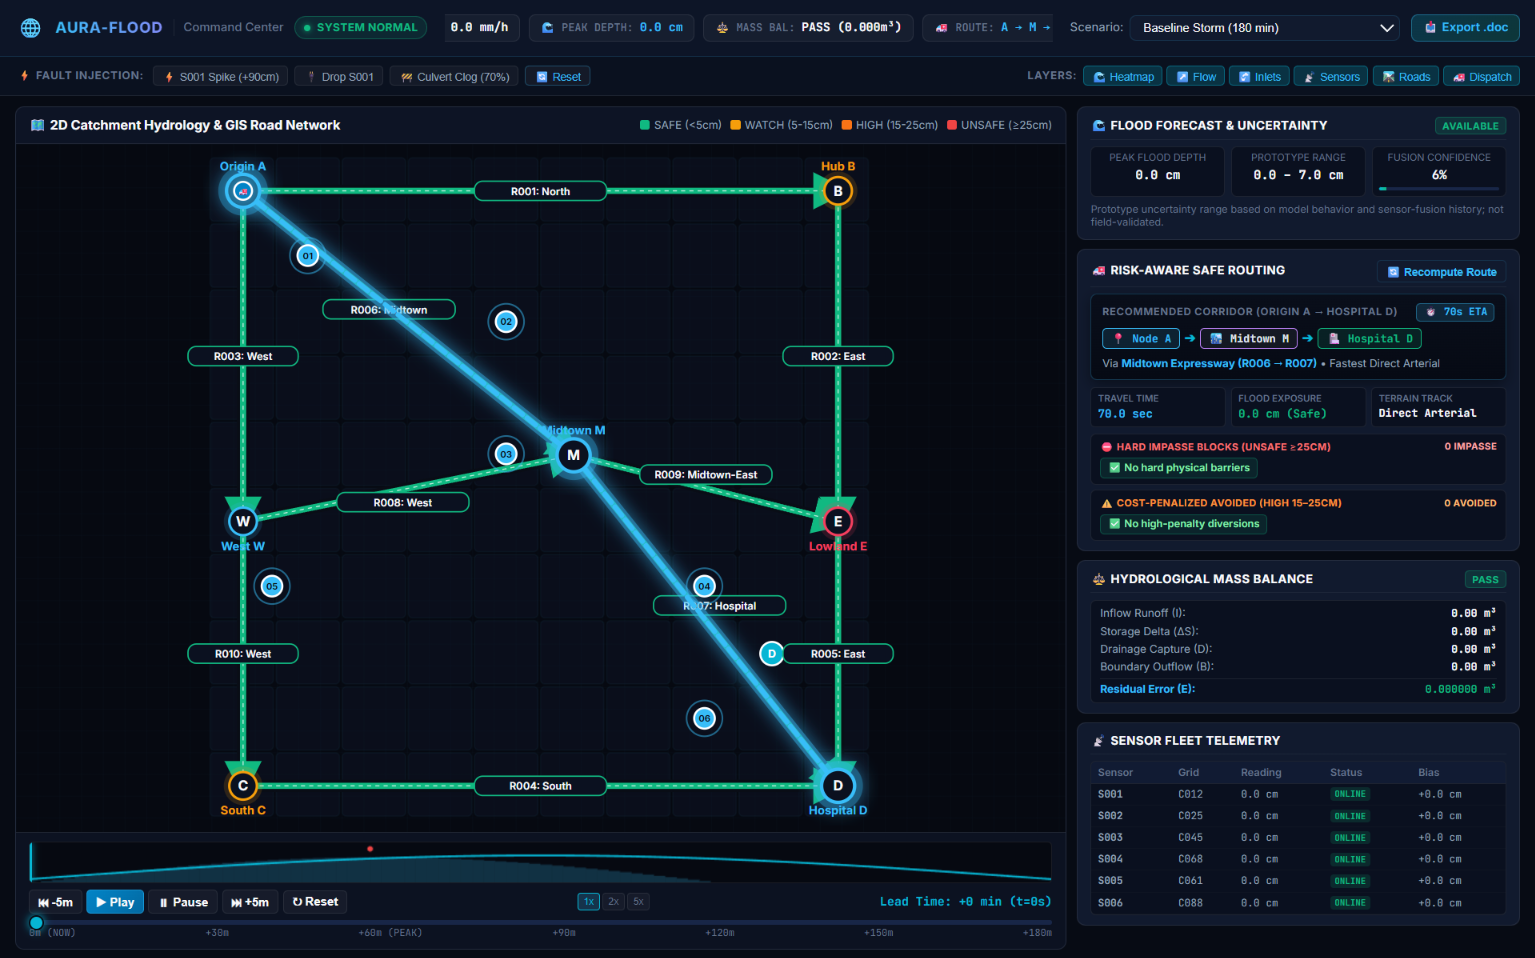
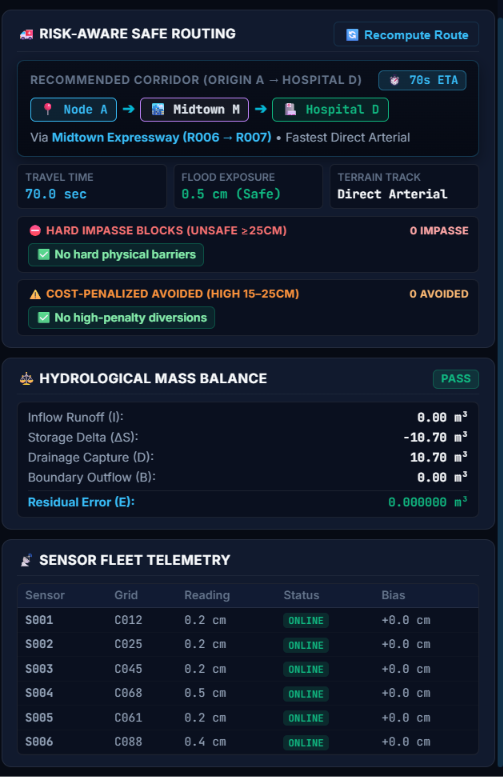
At +180 min, peak flood depth is 0.6 cm; all 6 ultrasonic sensors are online, and the system recommends a safe 70s route.
-
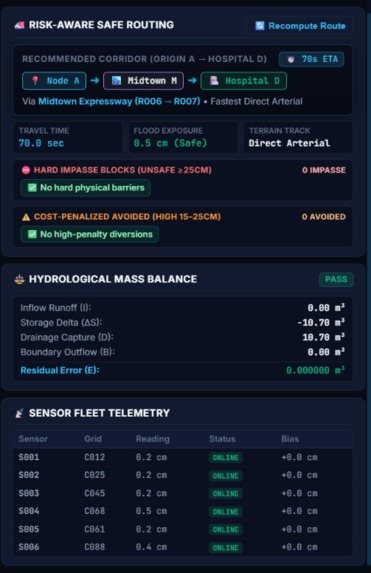
Risk-aware routing: A → Midtown M → Hospital D in 70 seconds with only 0.5 cm flood exposure, classified SAFE.
-
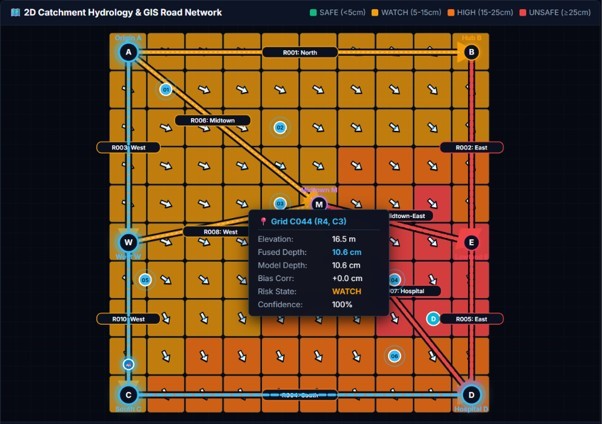
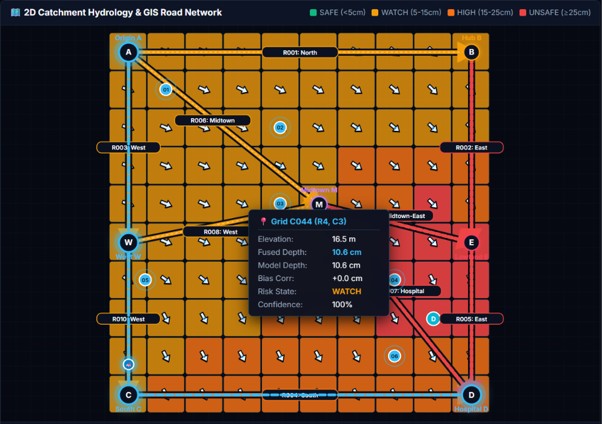
2D flood map showing water flow, road risks, sensor locations, and a selected cell with 10.6 cm depth and WATCH risk.
-
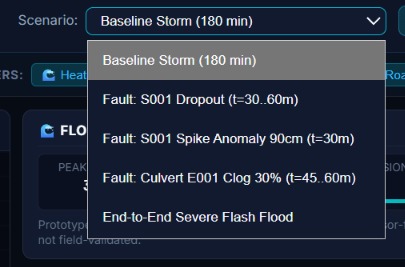
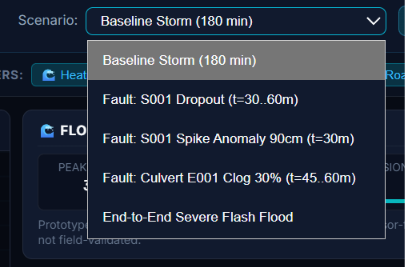
Scenario selector for baseline, sensor failures, sensor spikes, culvert clogging, and severe flash-flood testing.
SafeSurge – AURA-FLOOD
Inspiration
Urban flooding is no longer simply a question of whether it will rain. In cities such as Mumbai, Delhi, and Chennai, intense rainfall can rapidly turn ordinary roads and intersections into hazardous flood zones.
The major challenge is the gap between rainfall prediction and street-level flood prediction.
A weather system may tell us that heavy rainfall is expected, but that information alone cannot answer:
- Which streets are likely to flood?
- Where will runoff accumulate?
- How quickly will water depth increase?
- Which low-lying areas are most vulnerable?
- Can the existing drainage network handle the incoming runoff?
- Which roads may become unsafe?
- What alternative route should an emergency vehicle take?
Urban flooding is highly localized. Two nearby areas can receive similar rainfall but experience completely different flooding because of differences in elevation, surface-water pathways, impervious surfaces, drainage capacity, and local infrastructure.
This motivated us to build SafeSurge – AURA-FLOOD, a physics-guided urban flood nowcasting and response platform designed to bridge the gap between rainfall forecasting and actionable street-level decisions.
Our core principle is:
Don't just predict the rain. Predict what the rain will do to the city.
Instead of treating rainfall, drainage, flooding, and transportation as separate problems, we connect them into one computational pipeline:
Rainfall
   ↓
Runoff
   ↓
Terrain
   ↓
Surface Water Movement
   ↓
Surface Storage
   ↓
Drainage Capacity
   ↓
Flood Depth
   ↓
Road Risk
   ↓
Sensor Validation
   ↓
Safe Route
The result is a prototype that attempts to move urban flood management from reactive response toward predictive decision support.
What it does
1. Converts rainfall into flood predictions
SafeSurge begins with a time-varying rainfall input.
For the current prototype, we use a deterministic rainfall replay so that the complete system can be tested consistently and reproducibly.
The production architecture is designed to accept high-resolution spatial rainfall nowcasts from Doppler Weather Radar.
The rainfall is transformed into runoff using an SCS Curve Number (SCS-CN) based approach.
Rainfall
   ↓
Cumulative Rainfall
   ↓
SCS-CN Runoff
   ↓
Incremental Runoff
   ↓
Runoff Volume
This allows the system to estimate how much rainfall becomes surface runoff rather than assuming that all rainfall immediately becomes flooding.
2. Models the terrain using a DEM
The urban catchment is divided into computational grid cells.
Each cell contains information such as:
- Cell ID
- Geographic position
- Elevation
- Area
- Rainfall
- Runoff
- Surface storage
- Flow direction
- Flood depth
- Risk
- Confidence
A Digital Elevation Model (DEM) provides the elevation information.
For example:
20m → 18m → 15m → 12m
The system uses D8 flow direction to determine the preferred downhill direction of surface water.
D8 answers:
Where does the surface water want to go?
It does not calculate flood depth by itself.
3. Simulates surface-water movement
After runoff is generated, SafeSurge routes water across the computational grid.
Each cell maintains a quantity of surface water storage.
The system continuously accounts for:
- New runoff
- Water arriving from upstream cells
- Water leaving toward downstream cells
- Water entering drainage
- Water leaving the modeled boundary
Conceptually:
$$ S_{t+1}=S_t+I_t-O_t-D_t-B_t $$
where:
- (S_t) = surface storage
- (I_t) = incoming runoff and upstream inflow
- (O_t) = surface outflow
- (D_t) = drainage capture
- (B_t) = boundary outflow
This allows the model to represent the evolution of flooding over time, rather than producing only a static map.
4. Couples surface flooding with the underground drainage network
One of the most important aspects of SafeSurge is that it does not treat surface flooding independently from drainage.
The underground drainage system is represented as a directed graph:
$$ G=(V,E) $$
where:
- (V) represents drainage nodes
- (E) represents drainage connections
A simplified network may look like:
N001 → N002 → N003 → N004
                         ↓
                       Outlet
Nodes can represent:
- Drain inlets
- Manholes
- Junctions
- Outlets
Edges can represent:
- Pipes
- Culverts
- Drainage channels
- Other modeled hydraulic connections
Surface cells can be associated with drainage inlets.
Surface Cell
      ↓
Drain Inlet
      ↓
Drainage Network
      ↓
Downstream / Outlet
This creates a coupling between what happens above ground and what happens inside the drainage system.
5. Models drainage capacity
Drainage systems have finite capacity.
If too much runoff enters the system, the drainage network cannot remove unlimited quantities of water.
SafeSurge therefore models effective drainage capacity using:
$$ C=C_0F $$
where:
- (C_0) = base drainage capacity
- (F) = capacity factor
- (C) = effective capacity
The prototype can represent scenarios such as:
Normal capacity
F = 1.0

Reduced capacity
F = 0.6

Severe reduced capacity
F = 0.3
If capacity decreases:
Drainage Capacity ↓
        ↓
Drainage Capture ↓
        ↓
Surface Storage ↑
        ↓
Flood Depth ↑
        ↓
Road Risk ↑
This allows us to demonstrate how constrained drainage can contribute to surface flooding.
Importantly, a reduced-capacity scenario is not presented as proof that a physical blockage has been detected.
6. Calculates street-level flood depth
The model converts surface storage into water depth:
$$ h=\frac{S}{A_{effective}} $$
For computational cells, the effective area is based on the modeled cell area.
For example:
Surface Storage = 50 m³
Cell Area       = 500 m²

Depth = 50 / 500
      = 0.10 m
      = 10 cm
The result is a surface-water depth field.
This distinction is important:
The flood-depth layer represents water accumulated on the surface/road environment, not water level inside an underground drain.
7. Converts the flood grid into road risk
A computational cell is not necessarily entirely occupied by a road.
Therefore, SafeSurge maps the flood-depth field onto road geometries using nearby/intersecting cells and spatial weighting.
Flood Grid
    ↓
Road Geometry
    ↓
Intersecting / Nearby Cells
    ↓
Weighted Flood Depth
    ↓
Road Flood Risk
The prototype uses configurable risk states:
SAFE
WATCH
HIGH
UNSAFE
For example, a prototype configuration may use:
< 5 cm       → SAFE
5–15 cm      → WATCH
15–25 cm     → HIGH
≥ 25 cm      → UNSAFE
These are prototype decision thresholds, not universal safety standards.
8. Uses ultrasonic sensors for ground observations
The flood model is the primary prediction mechanism.
Ultrasonic sensors provide localized observations of actual surface-water conditions at selected locations.
A suitable installation could place a sensor on a fixed elevated structure, such as an appropriately positioned street-light pole, with a clear measurement path toward the road surface.
       Ultrasonic Sensor
              ↓
              ↓
       ~~~~~~~~~~~~~~~
          Floodwater
────────────────────────
           Road
The sensor measures the distance between the sensor and the water surface.
If:
Reference height = 100 cm
Measured distance = 82 cm
then:
$$ 100-82=18cm $$
The observed surface-water depth is approximately 18 cm.
The sensor therefore does not replace the model.
Instead:
The model predicts the flood, while the sensor provides local evidence about what is actually happening at selected locations.
9. Validates sensor measurements
Raw sensor measurements are not immediately trusted.
They pass through a validation pipeline:
RAW READING
     ↓
Range Check
     ↓
Rate-of-Rise Check
     ↓
Heartbeat / Freshness
     ↓
Quality State
     ↓
Accepted / Rejected
Possible sensor states include:
ONLINE
STALE
OFFLINE
INVALID
For example:
10 cm
11 cm
12 cm
90 cm
13 cm
If the transition from 12 cm to 90 cm is physically implausible within the configured timestep, the system identifies it as a rate-of-rise spike and rejects the measurement.
This prevents one corrupted measurement from contaminating the flood forecast.
10. Fuses model predictions with sensor observations
After validation, accepted sensor observations can be compared with model predictions.
For example:
Model prediction = 18 cm
Sensor observation = 25 cm
The difference is:
$$ e=25-18=7cm $$
A running bias estimate can then be maintained:
$$ B_t=\alpha e_t+(1-\alpha)B_{t-1} $$
and the corrected local estimate becomes:
$$ H_{corrected}=H_{model}+B_t $$
This provides a mechanism for incorporating real-world local observations into the model.
11. Applies spatial correction
A sensor observes only its immediate physical location.
We therefore avoid assuming that one sensor reading represents the entire catchment.
Instead, corrections can be spatially weighted:
                 Nearby Cell
                      ↑
                      |
Far Cell ← Sensor → Nearby Cell
                      |
                      ↓
                 Nearby Cell
Cells closer to the sensor can receive stronger correction, while farther cells receive progressively weaker correction.
This creates a bridge between sparse physical observations and the broader computational flood field.
12. Calculates forecast confidence
SafeSurge does not treat a single observation as sufficient evidence of forecast quality.
Confidence is based on a recent time window involving:
- Sensor coverage
- Sensor freshness
- Model/sensor agreement
For model agreement, recent valid observations are compared with predictions:
Recent Observations
        ↓
Predicted vs Observed
        ↓
Error
        ↓
MAE
        ↓
Agreement Score
A prototype confidence score can then be represented as:
$$ C=w_cC_c+w_fC_f+w_aC_a $$
where:
- (C_c) = coverage component
- (C_f) = freshness component
- (C_a) = agreement component
The dashboard presents this as a prototype confidence score, not as field-validated prediction probability.
13. Performs risk-aware routing
Once road flood depths are calculated, they become inputs to the transportation layer.
Each road can contain:
- Road ID
- Travel time
- Flood depth
- Risk
- Confidence
A routing cost can be represented as:
$$ Cost=TravelTime+\lambda Risk+\mu Uncertainty $$
An unsafe road can receive an effectively infinite routing cost.
For example:
A ─── B ─── D
 \         /
  ─── C ──
Under normal conditions:
A → B → D
If B becomes unsafe:
A → C → D
This allows SafeSurge to move beyond flood visualization toward actionable transportation decisions.
14. Provides a GIS command dashboard
The dashboard brings the complete system together.
Flood map
Displays:
- Computational grid
- Flood depth
- Risk state
- Terrain
- Flow direction
Road layer
Displays:
- Roads
- Road risk
- Flood exposure
- Routing information
Drainage layer
Displays:
- Drainage nodes
- Drainage connections
- Capacity scenarios
Sensor layer
Displays:
- Sensor location
- Sensor reading
- Sensor status
- Bias correction
Forecast panel
Displays:
- Peak flood depth
- Prototype forecast range
- Confidence
Timeline
NOW ── +30 ── +60 ── +90 ── +120 ── +150 ── +180 min
This enables the operator to see how the flood develops throughout the forecast window.
15. Uses mass conservation as a technical validation
A major credibility feature of SafeSurge is the hydrological mass-balance check.
The system tracks:
Runoff Input
Storage Change
Drainage Capture
Boundary Outflow
Residual Error
Conceptually:
$$ E=I-\Delta S-D-B $$
where:
- (I) = runoff input
- (\Delta S) = change in surface storage
- (D) = drainage capture
- (B) = boundary outflow
For example:
Runoff Input       48.54 m³
Storage Delta      -5.66 m³
Drainage Capture   20.00 m³
Boundary Outflow   34.20 m³
Residual Error      0.00 m³
The negative storage delta means that the amount of water stored on the surface decreased during that timestep.
The near-zero residual means the water is numerically accounted for.
This is an internal numerical consistency check, not a claim of real-world prediction accuracy.
16. Handles degraded operating conditions
A real flood-monitoring system cannot assume that every component will always work.
SafeSurge therefore tests degraded conditions deliberately.
Sensor failure
Sensor OFFLINE
      ↓
Model continues
      ↓
Confidence decreases
Sensor spike
Impossible reading
      ↓
Validation
      ↓
Rejected
      ↓
Previous valid state retained
Reduced drainage capacity
Drainage capacity ↓
      ↓
Surface storage ↑
      ↓
Flood depth ↑
No rainfall input
The system does not silently invent a rainfall forecast.
No sensor coverage
The model can continue operating, but confidence is reduced because less ground evidence is available.
Flooded shortest route
The routing system can reject or penalize unsafe roads and search for an alternative.
How we built it
SafeSurge was designed as a layered architecture, where each layer has a clearly defined responsibility.
┌──────────────────────────────────┐
│          GIS Dashboard           │
├──────────────────────────────────┤
│          FastAPI Backend         │
├──────────────────────────────────┤
│       Road Risk + Routing        │
├──────────────────────────────────┤
│     Sensor Fusion + Confidence   │
├──────────────────────────────────┤
│        Sensor Validation         │
├──────────────────────────────────┤
│          Flood Depth             │
├──────────────────────────────────┤
│   Surface ↔ Drainage Coupling    │
├──────────────────────────────────┤
│ Drainage Graph + Capacity Model  │
├──────────────────────────────────┤
│ Surface Storage + D8 Routing     │
├──────────────────────────────────┤
│          SCS-CN Runoff           │
├──────────────────────────────────┤
│       Rainfall Input Layer       │
└──────────────────────────────────┘
The backend is intentionally kept separate from the mathematical simulation.
The architecture follows:
Dashboard
    ↓
FastAPI
    ↓
Simulation / Domain Services
    ↓
Hydrology + Routing + Drainage
    ↓
State
This makes the system easier to test and allows the same simulation engine to operate independently from the user interface.
Challenges we ran into
1. Connecting rainfall to street flooding
The first major challenge was understanding that rainfall is only the beginning of the problem.
The actual chain is:
Rainfall
   ↓
Runoff
   ↓
Surface Flow
   ↓
Storage
   ↓
Drainage
   ↓
Flood Depth
Each stage affects the next.
2. Representing urban terrain
Urban flooding can be strongly affected by small elevation differences.
We therefore needed a computational grid and terrain-flow mechanism capable of determining how water moves between neighboring cells.
3. Connecting two different systems
The surface and underground drainage systems behave differently.
We had to create an explicit coupling between:
Surface Water
      ↓
Drainage Inlet
      ↓
Drainage Network
while ensuring that drainage capacity remains limited.
4. Maintaining water conservation
Because water continuously moves between cells and systems, numerical errors can accumulate.
The mass-balance mechanism became an important safeguard for verifying that the simulation is not arbitrarily creating or losing water.
5. Handling unreliable sensor data
A real sensor cannot be assumed to be perfect.
We therefore had to distinguish between:
No reading
and:
Bad reading
An offline sensor should reduce confidence.
A physically impossible measurement should be rejected.
These are different failure conditions and require different responses.
6. Avoiding overclaiming
Another important challenge was deciding what the prototype can legitimately claim.
The current system demonstrates the computational pipeline using controlled/replay data.
It does not claim field-validated city-wide flood prediction accuracy.
A production deployment would require real:
- Radar observations
- DEM data
- Drainage-network data
- Historical flood observations
- Sensor measurements
- Calibration and validation
Accomplishments that we're proud of
1. We built an end-to-end flood pipeline
The prototype connects:
Rainfall → Runoff → Terrain → Surface Routing → Drainage → Flood Depth → Road Risk → Routing
rather than demonstrating isolated modules.
2. We connected surface and underground systems
A key accomplishment is the explicit relationship between surface-water accumulation and drainage capacity.
This allows the system to demonstrate why the same rainfall event can produce different flood outcomes under different drainage conditions.
3. We created a spatial flood-depth field
The system does not simply produce a single city-wide flood number.
It estimates flood depth across individual computational cells and maps that information to roads.
4. We incorporated real-world observations
The ultrasonic sensor architecture provides a path for localized field observations to validate and correct model predictions.
5. We implemented sensor-quality protection
The system does not blindly trust sensor data.
Spike injection and sensor-drop testing demonstrate that the system can handle:
- Invalid measurements
- Sudden unrealistic changes
- Offline sensors
- Reduced observation coverage
6. We added hydrological mass-balance validation
The model explicitly accounts for water entering, remaining, draining, and leaving the modeled catchment.
This gives us an internal numerical consistency check.
7. We connected flood prediction to mobility
Instead of ending with:
"This road is flooded."
SafeSurge continues to:
"This road is unsafe, so another route should be considered."
This connects flood modeling directly to emergency response and transportation.
What we learned
1. Rainfall prediction is not flood prediction
The most important lesson was that knowing how much rain will fall does not automatically tell us where flooding will occur.
Flooding depends on the interaction between:
Rainfall
+
Terrain
+
Runoff
+
Surface Storage
+
Drainage
+
Infrastructure
2. Terrain determines where water wants to move
Small elevation differences can influence surface-water pathways.
That is why DEM and D8 are important components of the system.
3. Drainage capacity is a critical constraint
Drainage cannot remove unlimited water.
When incoming runoff exceeds effective drainage capacity, water remains on the surface and flood depth can increase.
4. Sensors should complement—not replace—the model
A sparse sensor network cannot observe every road.
Conversely, a model may not perfectly represent local conditions.
Combining:
Model
+
Local Observations
provides a more useful architecture than relying exclusively on either one.
5. Data quality matters
A bad measurement can be more harmful than a missing measurement.
This led us to make validation a mandatory step before sensor data enters the fusion system.
6. Numerical correctness matters
A visually impressive flood map is not sufficient.
The underlying simulation must also obey basic accounting principles.
That is why mass conservation became a core validation feature.
7. Prototype confidence is not real-world accuracy
One of our most important lessons was to distinguish between:
A working prototype
and:
A field-validated forecasting system.
Our current confidence indicators and deterministic replay validate aspects of the computational workflow, but real-world deployment requires extensive calibration and field validation.
8. Simplicity is valuable
We deliberately chose a physics-guided architecture instead of adding an arbitrary ML model simply to claim that the system uses AI.
The current P0 focuses on interpretable mechanisms:
- SCS-CN runoff
- DEM/D8 routing
- Surface storage
- Drainage capacity
- Sensor validation
- Sensor fusion
- Risk-aware routing
With sufficient historical field data, ML can later be introduced as a correction or forecasting enhancement.
What's next for SafeSurge – AURA-FLOOD
1. Integrate live Doppler Weather Radar
The current prototype uses deterministic rainfall replay.
The next step is to connect verified high-resolution spatial rainfall nowcasts from Doppler Weather Radar.
Doppler Radar
      ↓
Rainfall Nowcast
      ↓
Rainfall Grid
      ↓
AURA-FLOOD
The existing architecture is designed to keep rainfall ingestion separate from the flood engine so that the input source can evolve without redesigning the complete system.
2. Integrate real urban datasets
A production deployment requires authoritative datasets such as:
- High-resolution DEM
- Land-use information
- Impervious-surface information
- Stormwater drainage networks
- Pipe and culvert information
- Road geometry
- Catchment boundaries
- Historical flood observations
These datasets would allow the model to move from a controlled prototype catchment toward a calibrated urban deployment.
3. Deploy physical sensor nodes
We plan to deploy ultrasonic sensors at carefully selected flood-prone locations.
The sensor network would provide:
Observed Water Depth
        ↓
Validation
        ↓
Model Comparison
        ↓
Local Correction
        ↓
Confidence
Sensor placement would be determined based on factors such as flood vulnerability, accessibility, measurement geometry, and network coverage.
4. Calibrate against historical events
The next major validation step is to compare predictions with real flood observations.
For historical storms:
Historical Rainfall
        ↓
Model Prediction
        ↓
Observed Flood Depth
        ↓
Error Analysis
        ↓
Parameter Calibration
This would allow us to measure actual forecasting performance rather than relying only on synthetic scenarios.
5. Introduce ML as a correction layer
Once enough real, validated historical data is available, an ML model such as XGBoost could be introduced to learn systematic residual errors.
The architecture would be:
Physics Model
      ↓
Predicted Depth
      ↓
ML Residual Correction
      ↑
Historical + Sensor Data
      ↓
Final Prediction
This approach allows ML to enhance the physics model rather than replacing the underlying physical reasoning with an unexplained black box.
6. Improve drainage modeling
Future versions can move from simplified capacity scenarios toward more detailed hydraulic representations that incorporate additional drainage characteristics and calibrated network behavior.
This would improve the system's ability to represent:
- Network bottlenecks
- Junction behavior
- Pipe capacity
- Culvert constraints
- Backwater effects
- Surcharge conditions
7. Improve road-level modeling
Future versions can incorporate more detailed road geometry and elevation information to better distinguish between:
- Road surface
- Footpaths
- Intersections
- Underpasses
- Low points
- Adjacent terrain
This would improve the translation from grid-level flood depth to practical road-level risk.
8. Connect with navigation platforms
The routing engine can eventually be exposed through APIs compatible with navigation and mobility applications.
This could allow flood-aware routing for:
- Emergency services
- Ambulances
- Fire services
- Public transportation
- Municipal response teams
- Commuters
The objective is to make flood prediction actionable, not simply visual.
End-to-End Architecture
The complete vision for SafeSurge is:
              WEATHER / RADAR
                     ↓
              Rainfall Nowcast
                     ↓
               Rainfall Grid
                     ↓
                SCS-CN
                     ↓
                 Runoff
                     ↓
              DEM + D8
                     ↓
           Surface Water Routing
                     ↓
             Surface Storage
                     ↓
          ┌──────────┴──────────┐
          ↓                     ↓
  Drainage Network        Boundary Outflow
          ↓
   Capacity Constraints
          ↓
    Drainage Capture
          ↓
       Flood Depth
          ↓
      Road Mapping
          ↓
       Road Risk
          ↑
          │
   Sensor Observations
          ↓
   Validation + Fusion
          ↓
       Confidence
          ↓
    Risk-Aware Routing
          ↓
    Emergency Response
          ↓
       GIS Dashboard
Why SafeSurge Matters
SafeSurge is designed around a fundamental shift:
From predicting rainfall to predicting consequences.
A rainfall forecast may tell a city that a storm is approaching.
SafeSurge attempts to take the next step:
How much rain?
      ↓
How much runoff?
      ↓
Where will it flow?
      ↓
Where will it accumulate?
      ↓
Can the drainage network handle it?
      ↓
How deep will the water become?
      ↓
Which roads are affected?
      ↓
Which route should be avoided?
This transforms weather information into location-specific, time-dependent decision support.
Prototype Validation
Our first complete system test follows the entire chain:
Storm Replay
      ↓
Rainfall Grid
      ↓
Runoff
      ↓
Surface Routing
      ↓
Surface Storage
      ↓
Drainage Capture
      ↓
Flood Depth
      ↓
Sensor Observation
      ↓
Sensor Validation
      ↓
Sensor Fusion
      ↓
Confidence
      ↓
Road Risk
      ↓
Safe Routing
      ↓
GIS Dashboard
We also deliberately introduce faults to verify graceful degradation:
Sensor Spike
Sensor Offline
Reduced Drainage Capacity
Extreme Rainfall
No Rainfall
No Sensor Coverage
Flooded Shortest Route
The objective is not simply to demonstrate the ideal scenario, but to show that the system behaves predictably when individual components become unreliable.
Final Vision
SafeSurge – AURA-FLOOD aims to provide cities with a unified platform that connects weather, hydrology, terrain, drainage infrastructure, ground observations, transportation, and emergency response.
The long-term vision is a system where a municipality can see:
What is happening now → what is likely to happen next → which locations are at risk → what infrastructure is under stress → and what action should be taken.
Our current prototype establishes the computational foundation for this vision. Future deployment will require live radar integration, authoritative urban datasets, real sensor observations, calibration, and extensive field validation.
Ultimately, SafeSurge aims to help cities move from:
Reacting after roads flood
to:
Predicting where flooding is likely to develop and preparing before it happens.
SafeSurge – AURA-FLOOD
Predict the water. Understand the risk. Protect the route.
Built With
- api
- d8-algorithm
- data-visualization
- dem
- esp32
- fastapi
- flood-modeling
- geospatial-analysis
- gis
- graph-algorithms
- hydrology
- iot
- javascript
- networkx
- python
- react
- rest
- routing
- scs-cn
- sensor-fusion
- ultrasonic-sensor

Log in or sign up for Devpost to join the conversation.