Inspiration
What it does
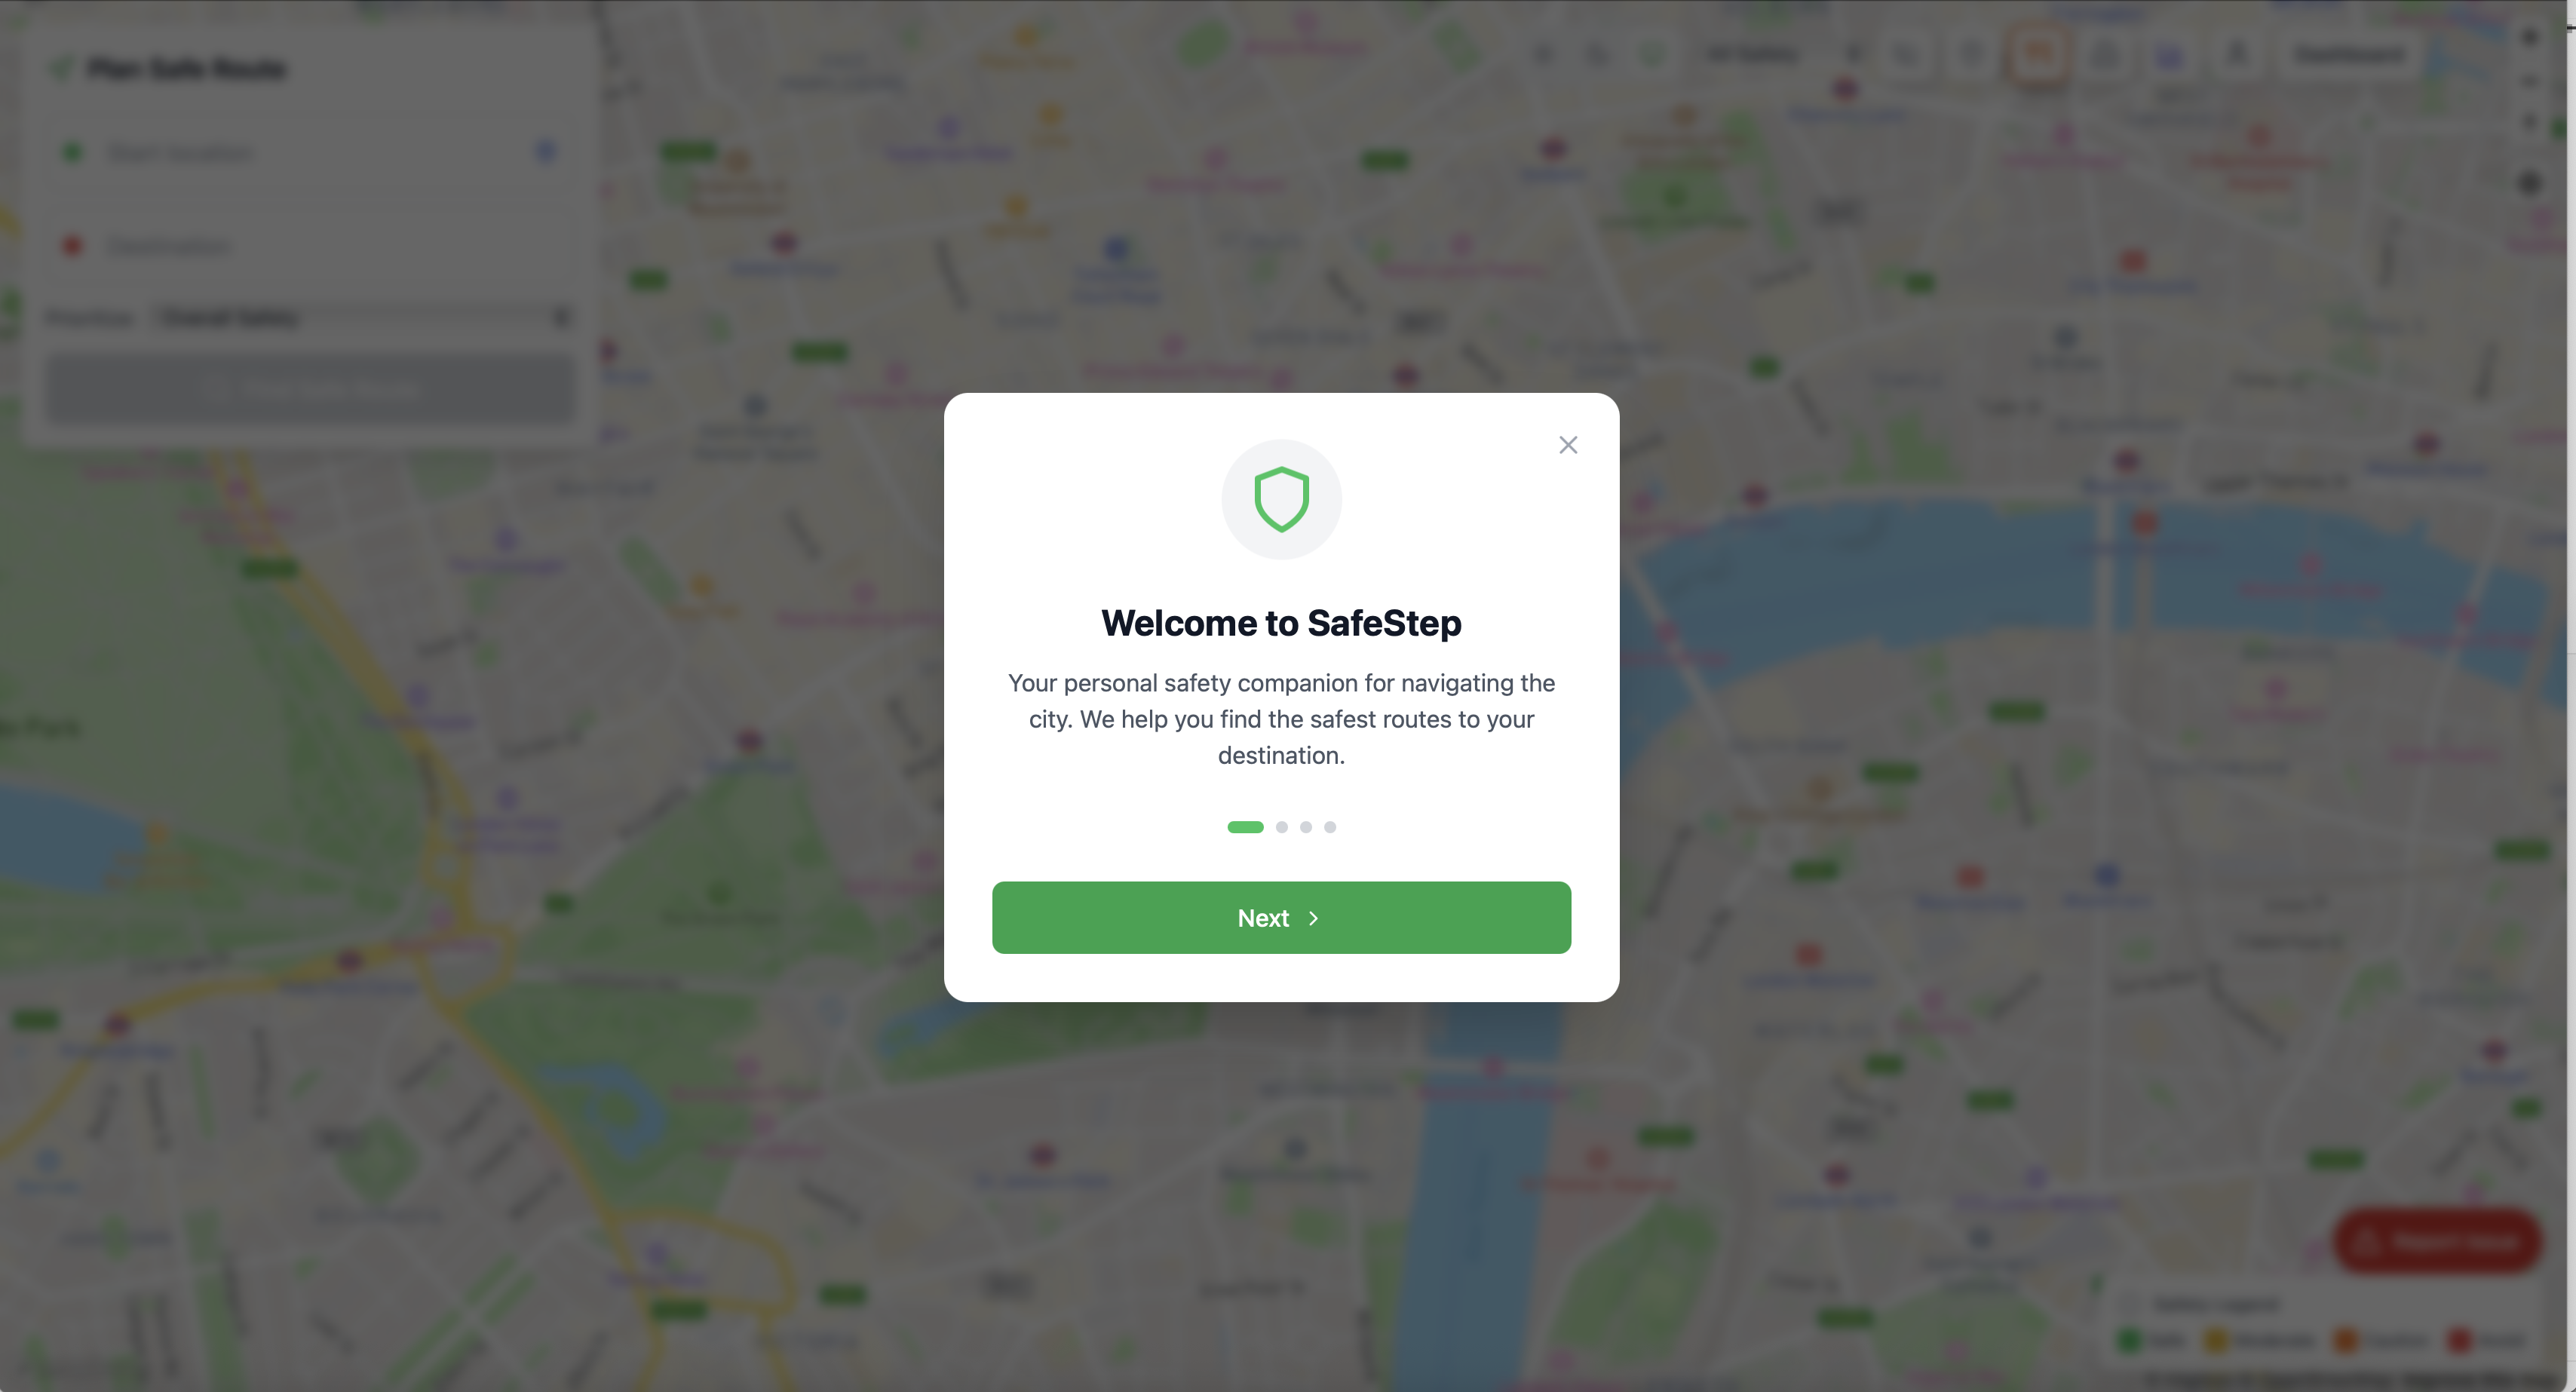
SafeStep is an intelligent navigation tool whose core feature is to keep pedestrians safe by finding the safest paths between two points that minimize risks such as violence, theft, and harassment. To this end, SafeStep has two core features. The first is the safest route calculation based on crime data and online reviews. The second is allowing users to submit incident reports that are processed in real-time and contribute to future route calculations.
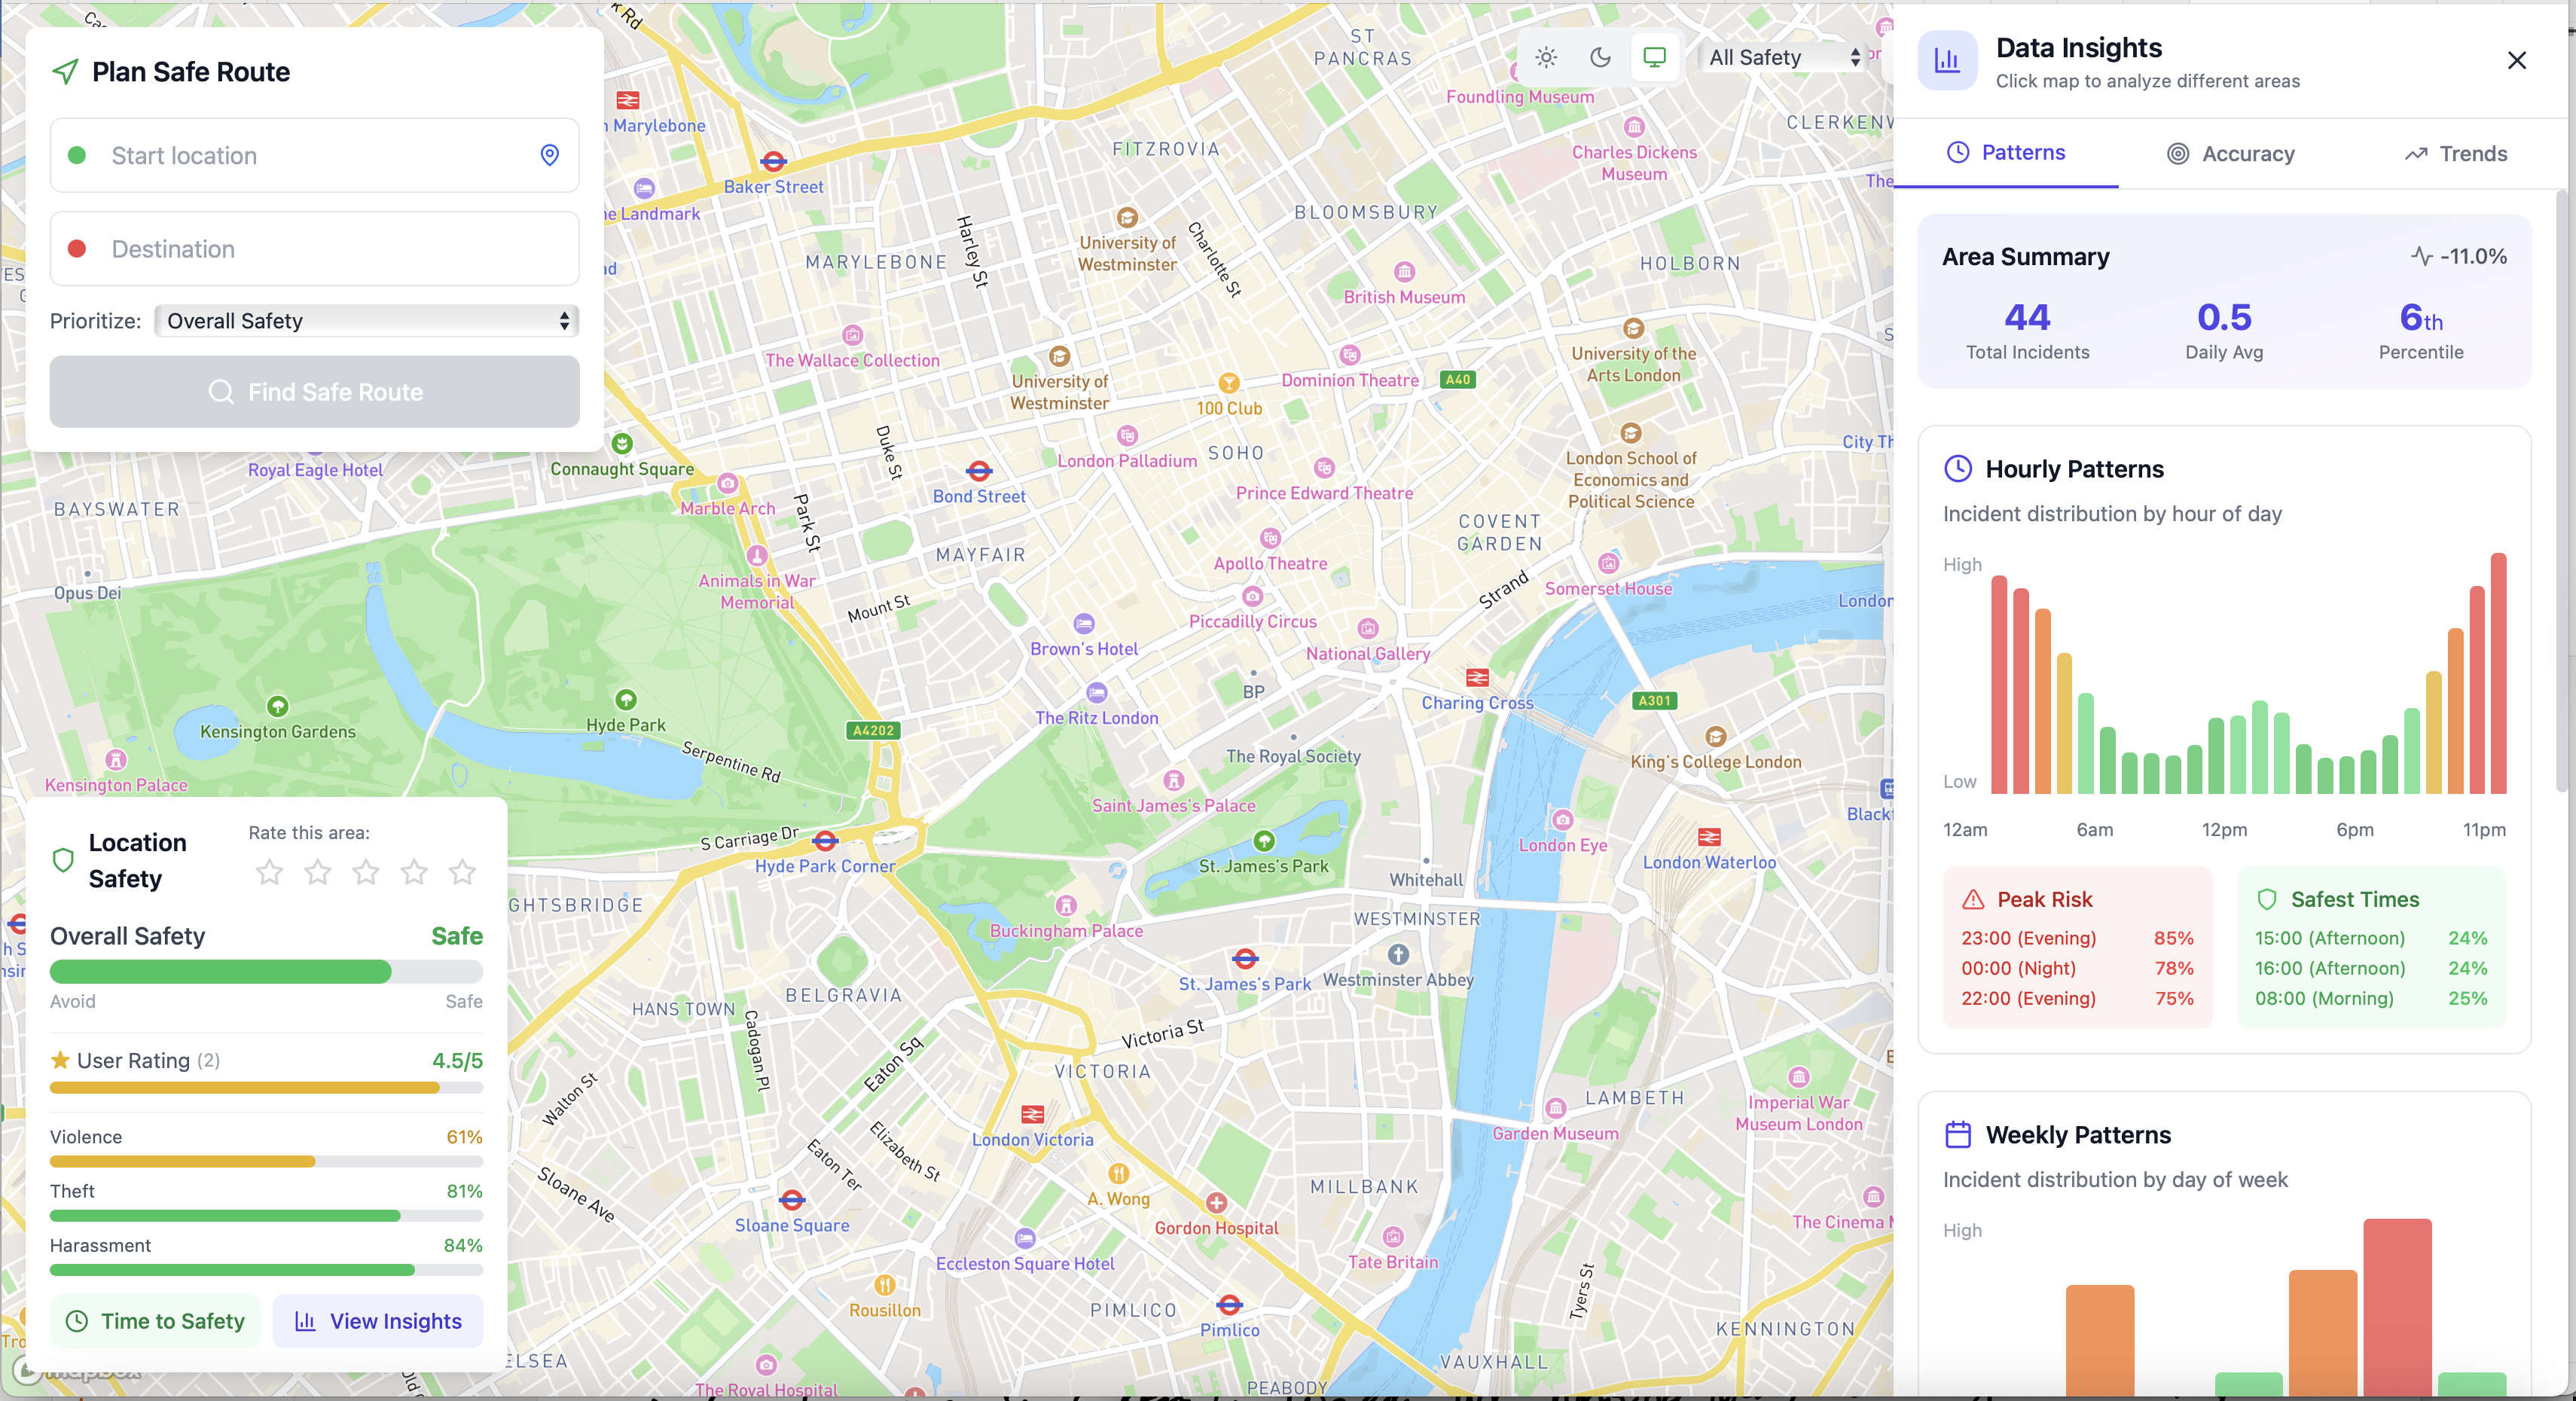
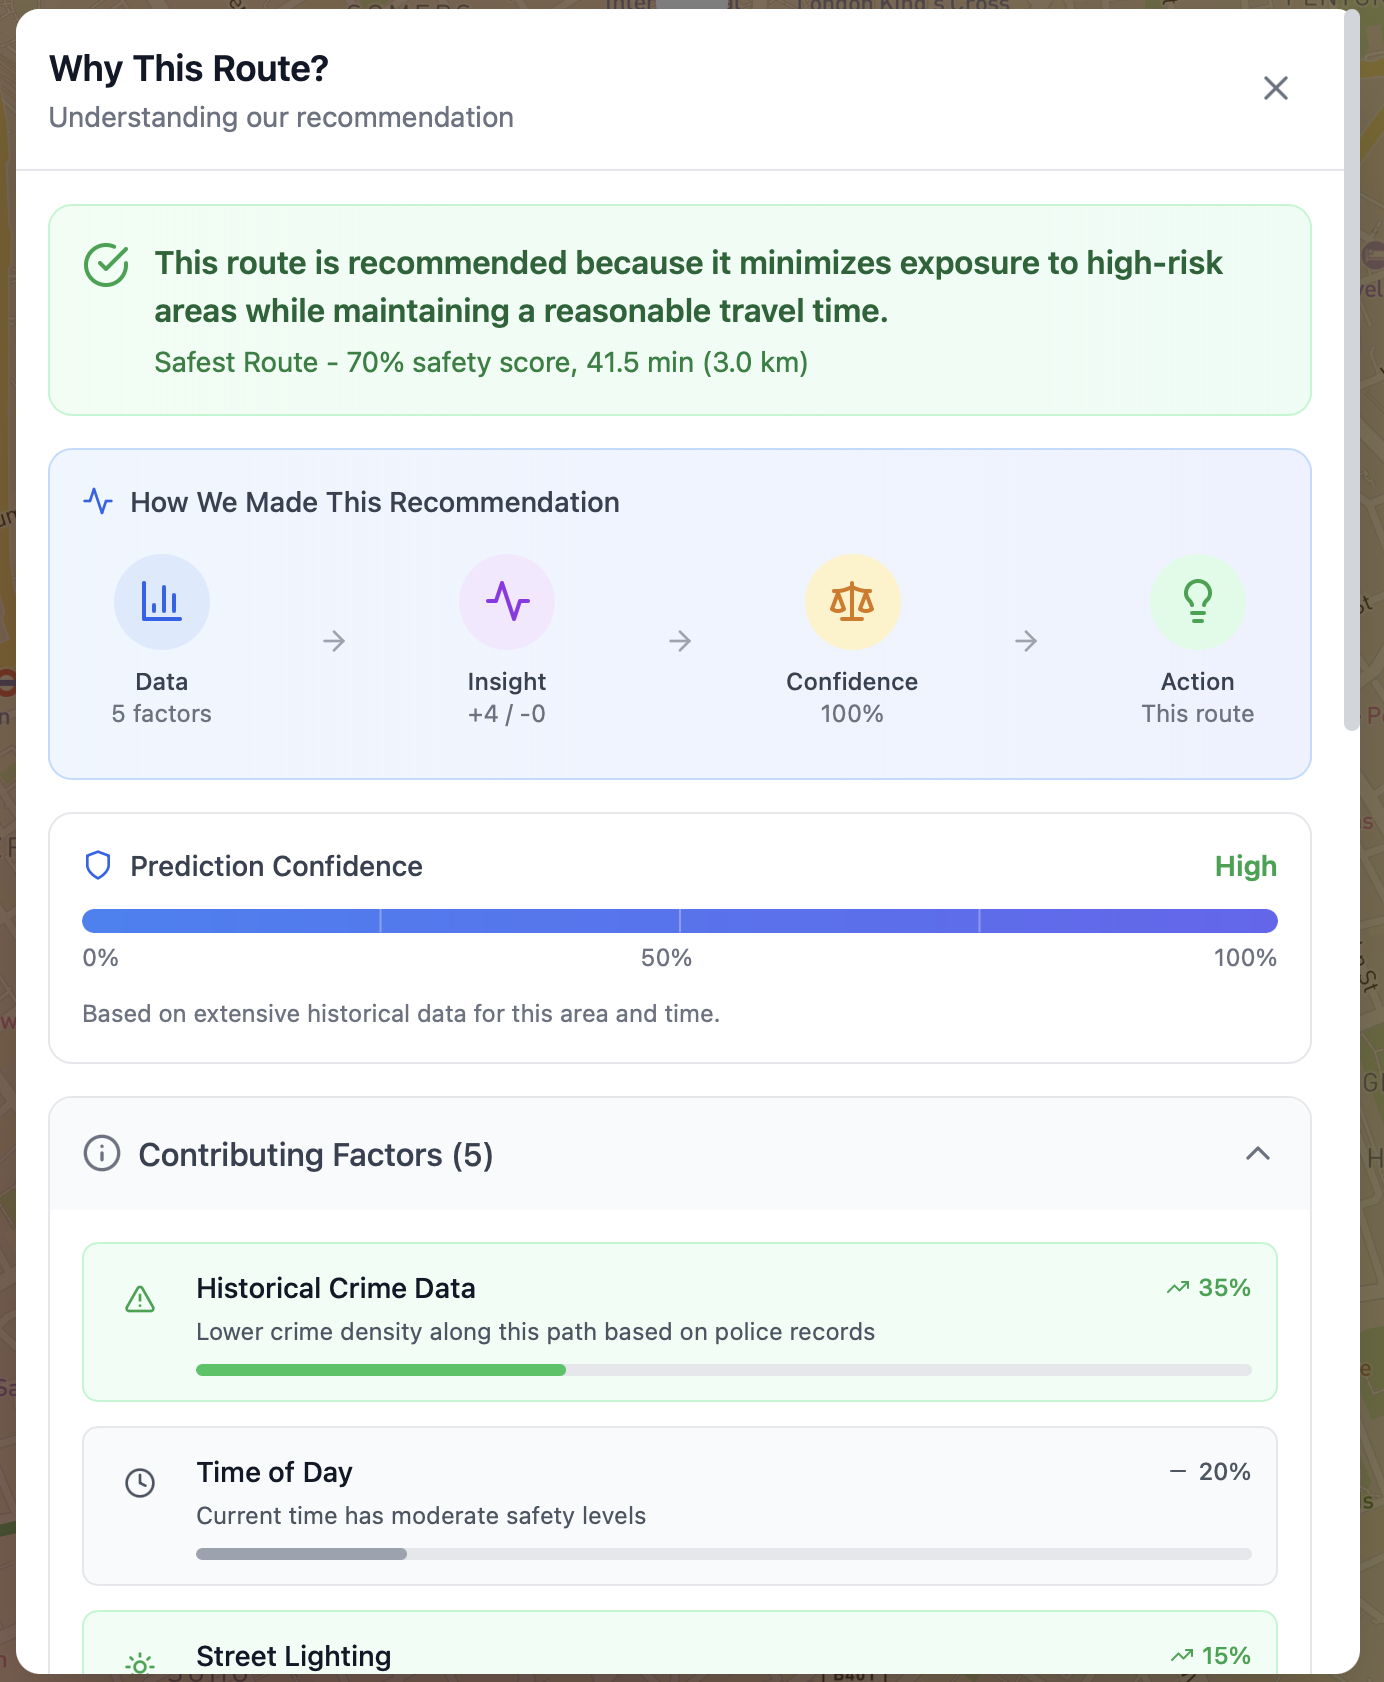
In conjunction with these core features, SafeStep also has an intelligent safety forecaster that predicts the safety rating of locations and paths. Using this tool, SafeStep can give users data-supported insights on the best times to travel and tradeoffs of selecting different routes.
How we built it
We used React with TypeScript for the frontend and FastAPI with Python for the backend. For rendering the map, routes, heatmap, and custom icons, we used MapBox. For the database, we used PostgreSQL along with PostGIS, which allows us to handle geospatial queries.
Incident reports are turned into safety signals using DistilBERT, a pretrained ML model for capturing semantic and syntactic information about words. In SafeStep, we use it to capture user sentiments in reports in order to classify their category and severity. This allows us to transform reports into quantitative safety signals.
We generate localized safety scores using Gaussian weighting where data points within a certain radius are taken and weighted by distance. These weighted signals are aggregated into a single score. Additionally, we use temporal pattern data learned from analysing history data to adjust the safety score by a multiplier.
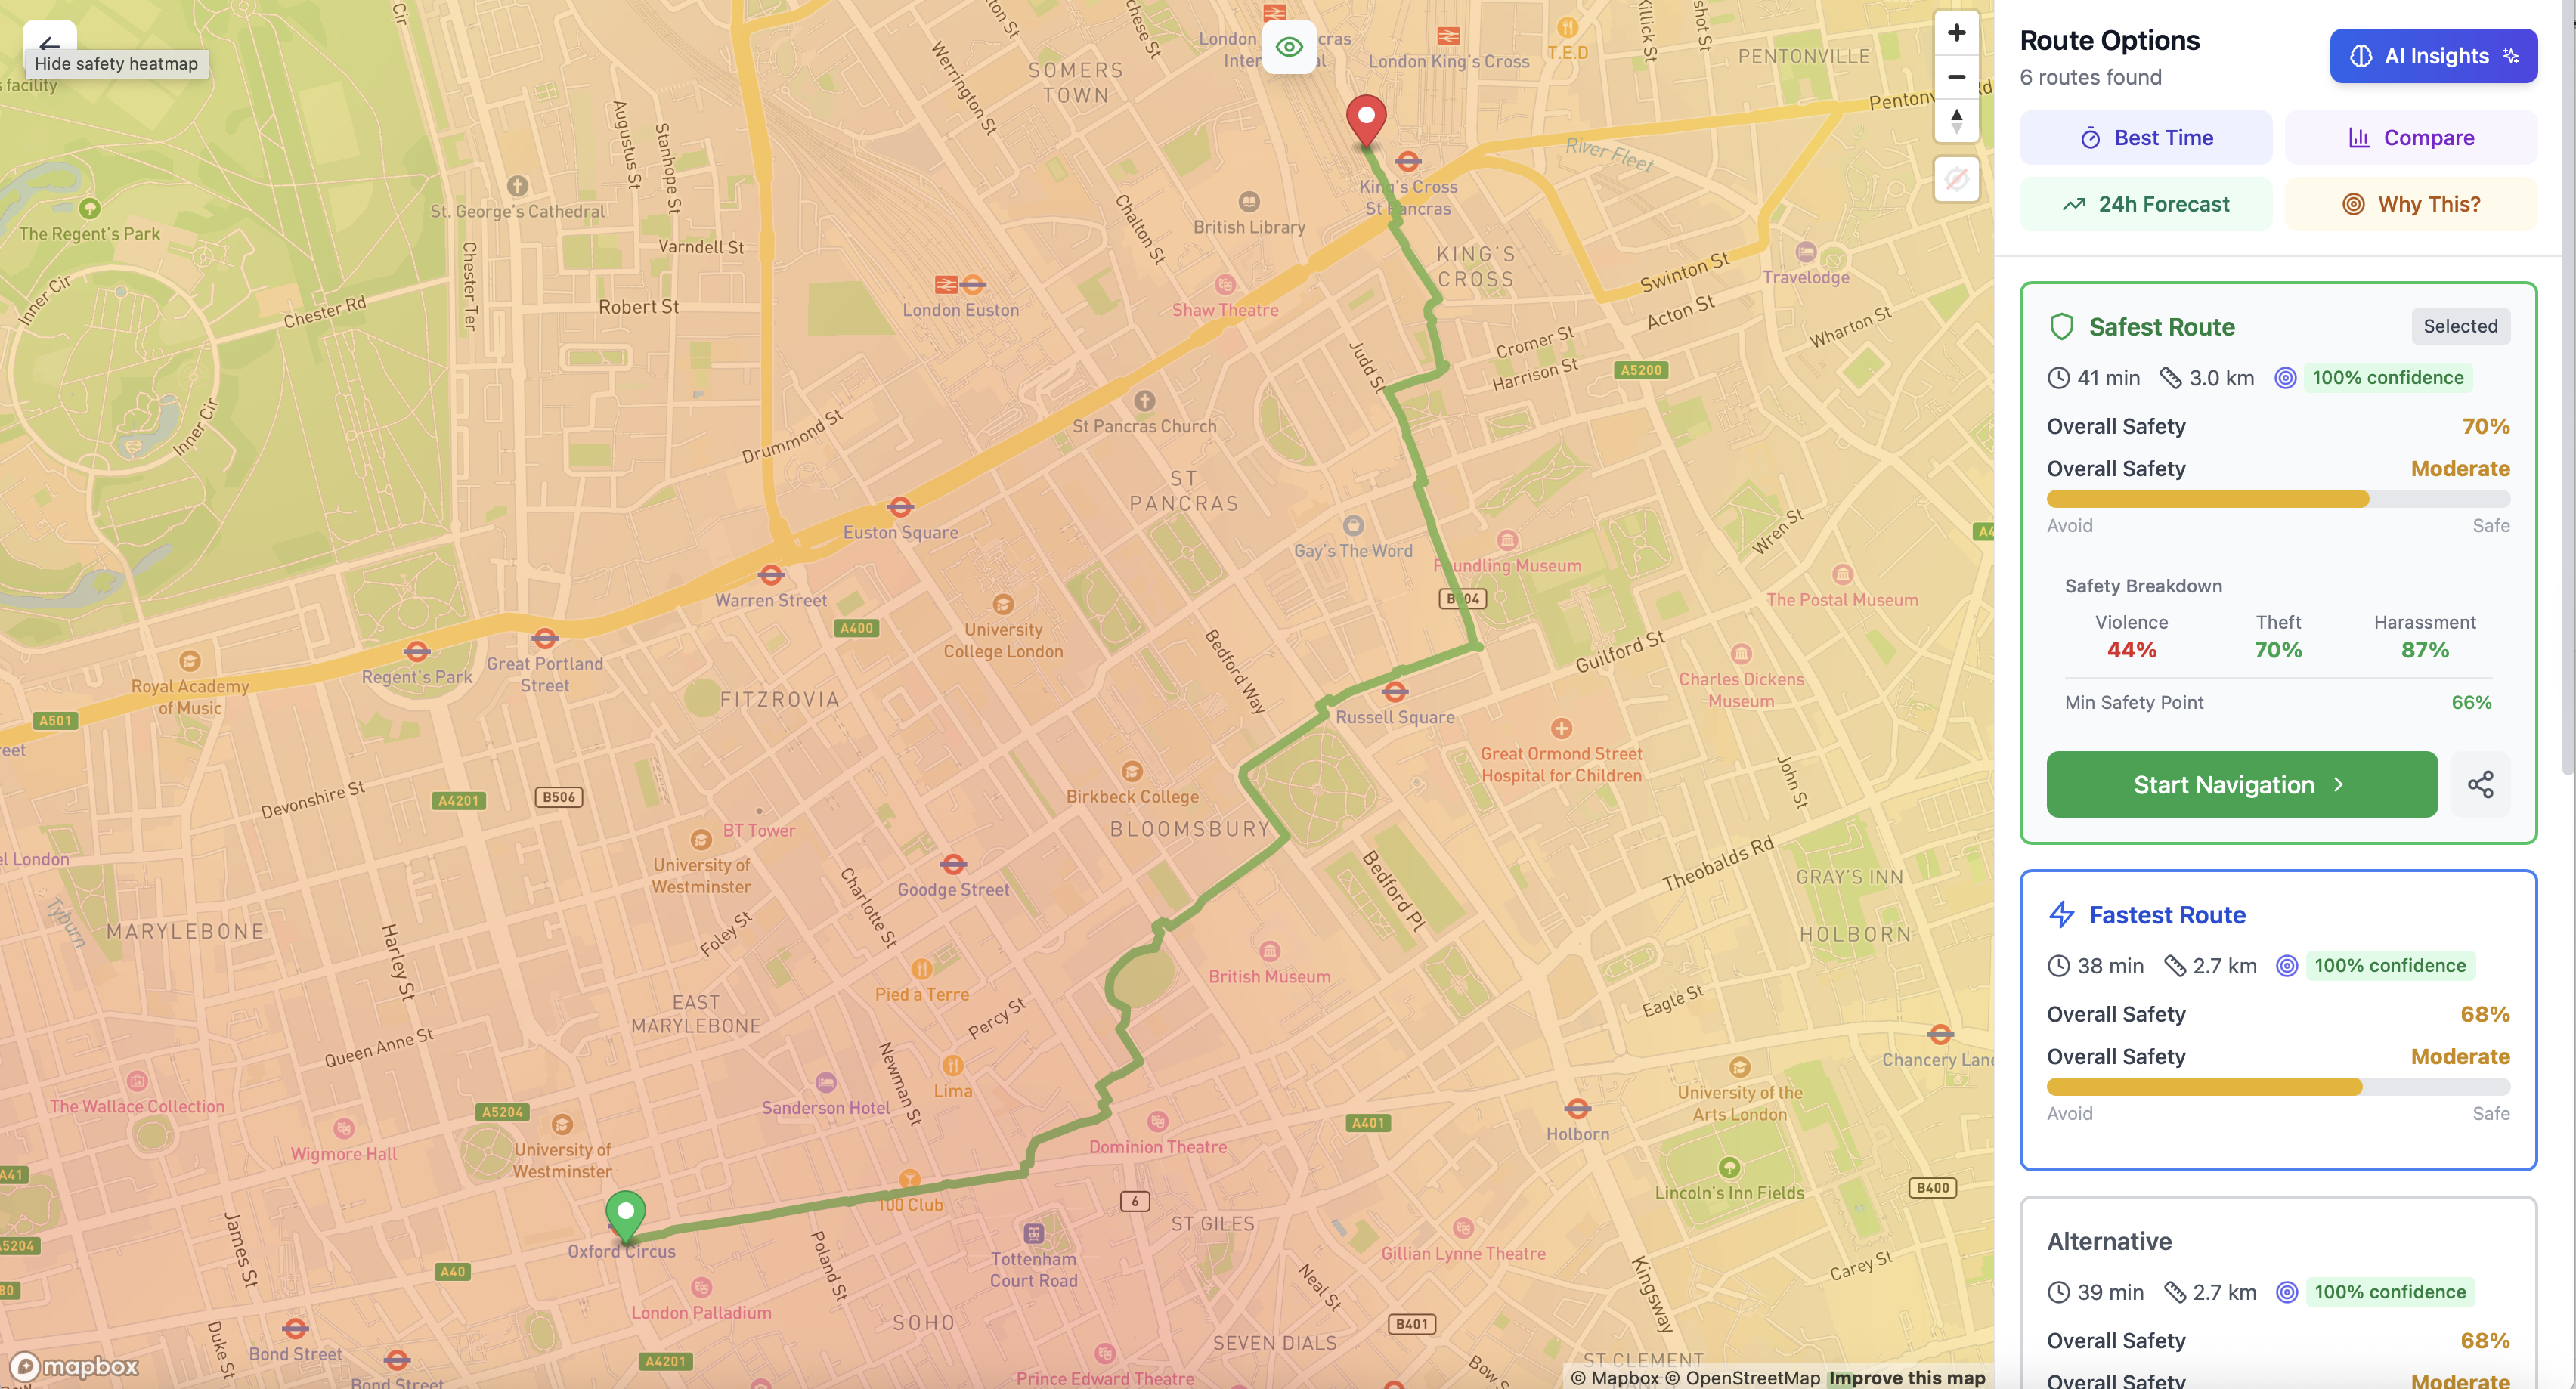
Furthermore, to assign a safety score to paths, we used a similar Gaussian interpolation weighted by temporal patterns approach. We used routes generated by the Google Directions API which score and rank based on safety.
FRONTEND
- React + TypeScript
- Mapbox GL JS
- Tailwind CSS
|
v
BACKEND
- FastAPI
- Spatial Scorer (Gaussian interpolation)
- Predictive Engine (Temporal patterns)
- ML Pipeline (DistilBERT sentiment)
|
v
DATABASE
- PostgreSQL + PostGIS
|
v
EXTERNAL APIS
- Google Directions API
- UK Police API
- Mapbox API
Challenges we ran into
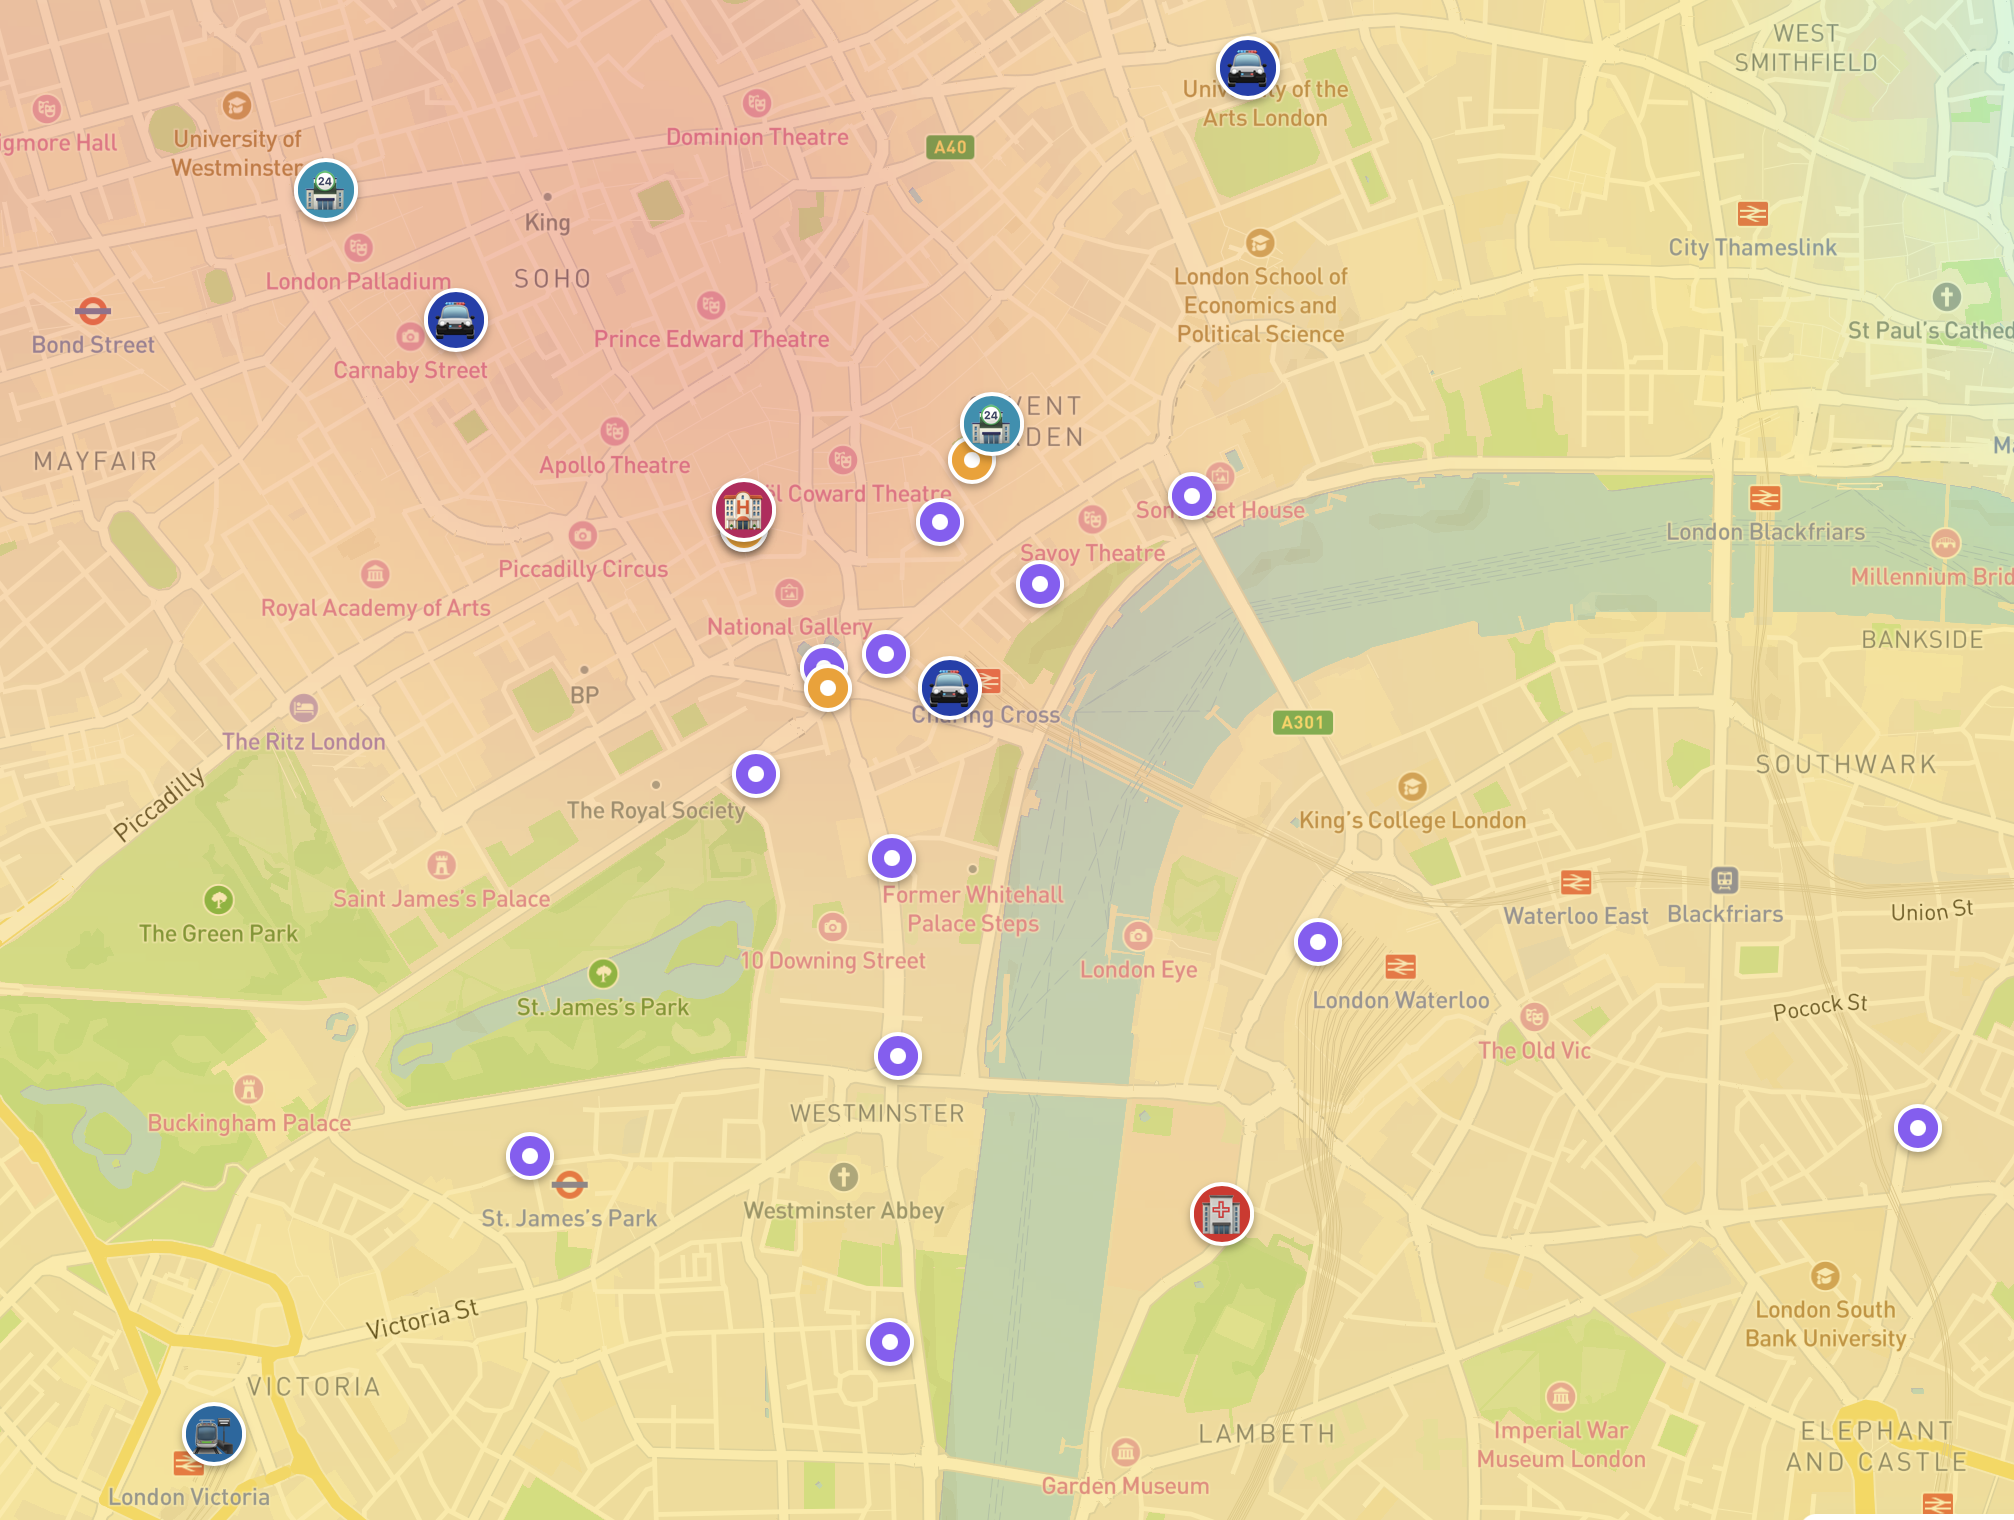
A challenge we encountered was getting our heatmap to display correctly. At first, we rendered the heatmap Mapbox’s built-in heatmap layer which initially was quick to implement. However, this layer would be recalculated on every pan and zoom which led to performance issues. Additionally, we used Gaussian smoothing for our heatmap so that effects of nearby data points can be reflected at a given point; however, we implemented smoothing using pixel distance between points instead of geographical distance which resulted in the heatmap degenerating into a red rectangle as the zoom increased. Eventually, we were able to solve both these problems by precomputing a global heatmap layer that calculates smoothing once at a fixed resolution.
Another challenge we faced was the lack of data to test out the incident report feedback loop. To circumvent this problem, we hashed latitude and longitude values to create seed numbers, which we then used to generate mock data for the corresponding location. This approach allowed us to test our prediction engine with a large set of incident report data without having to submit a large number of incident reports.
Accomplishments that we're proud of
- Built a spatial safety scoring engine using Gaussian interpolation to combine crime incident data, review APIs (Google Places, Yelp), and news into a single safety score.
- Engineered time-aware route optimization that adjusts safety scores by departure time and day of week, since risk changes a lot across hours and weekends.
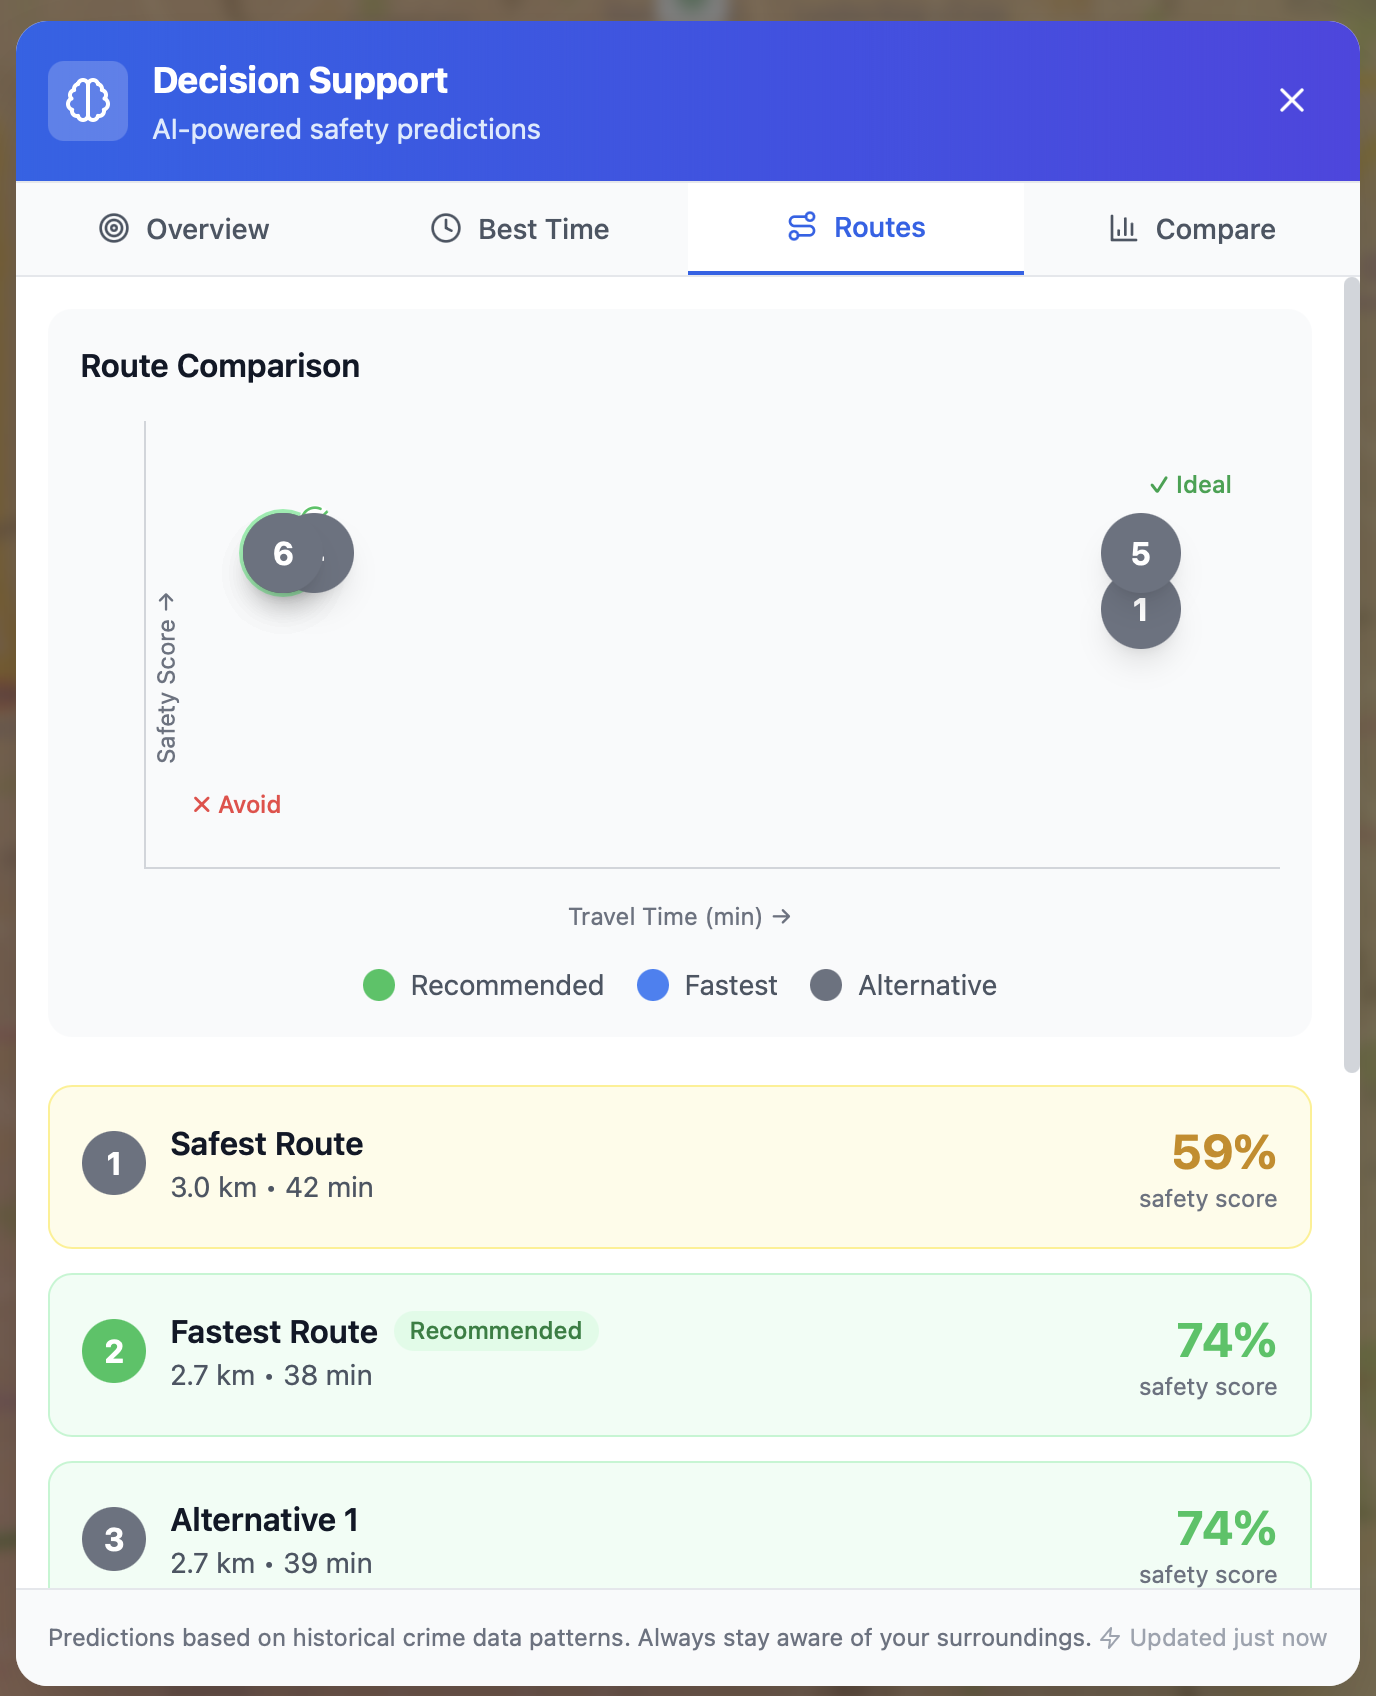
- Created a route comparison system that returns the safest, fastest, and alternative options, with danger zones shown clearly on the map.
- Built an interactive heatmap showing safety levels across London by category (violence, theft, harassment).
- Integrated an end-to-end data pipeline that pulls from multiple sources (crime APIs, reviews, news, user reports) and normalizes everything into a spatial database.
What we learned
The underlying theme throughout our project has been integrating data into daily life. To this end, we have learned various techniques to transform data into a form that suits our purposes. For example, we learned how to transform qualitative data into quantitative signals using machine learning. Furthermore, we gained a deeper understanding of how to smooth out a discrete set of data.
In addition to what we learned about data analysis, we also had to delve deeper into PostGIS which was essential to this project.
What's next for SafeStep
There is plenty of scope to further improve and refine our application. For example, we could introduce moderation for user reviews and ratings, as these directly influence the overall safety score. We could also cache frequently used or popular routes and implement additional optimisations to further improve application performance.
There is also significant room for growth. Rather than limiting our data to London, we could expand coverage to other locations, which would require sourcing additional datasets or integrating an API that provides local crime statistics. In addition, SafeStep could be developed as a mobile app and integrated as an extension within existing routing tools such as Google Maps or Apple Maps, making the product far more convenient for everyday use.
Built With
- distilbert
- fastapi
- google-directions
- mapbox
- postgis
- postgresql
- python
- react
- typescript


Log in or sign up for Devpost to join the conversation.