-
-
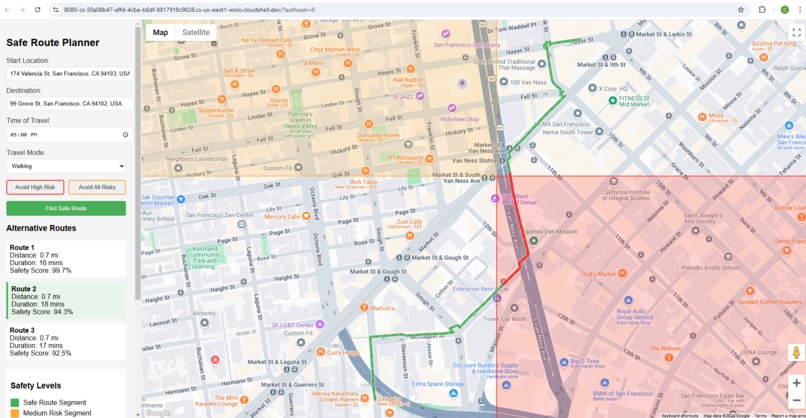
Find Safe Route (avoiding disabled)
-

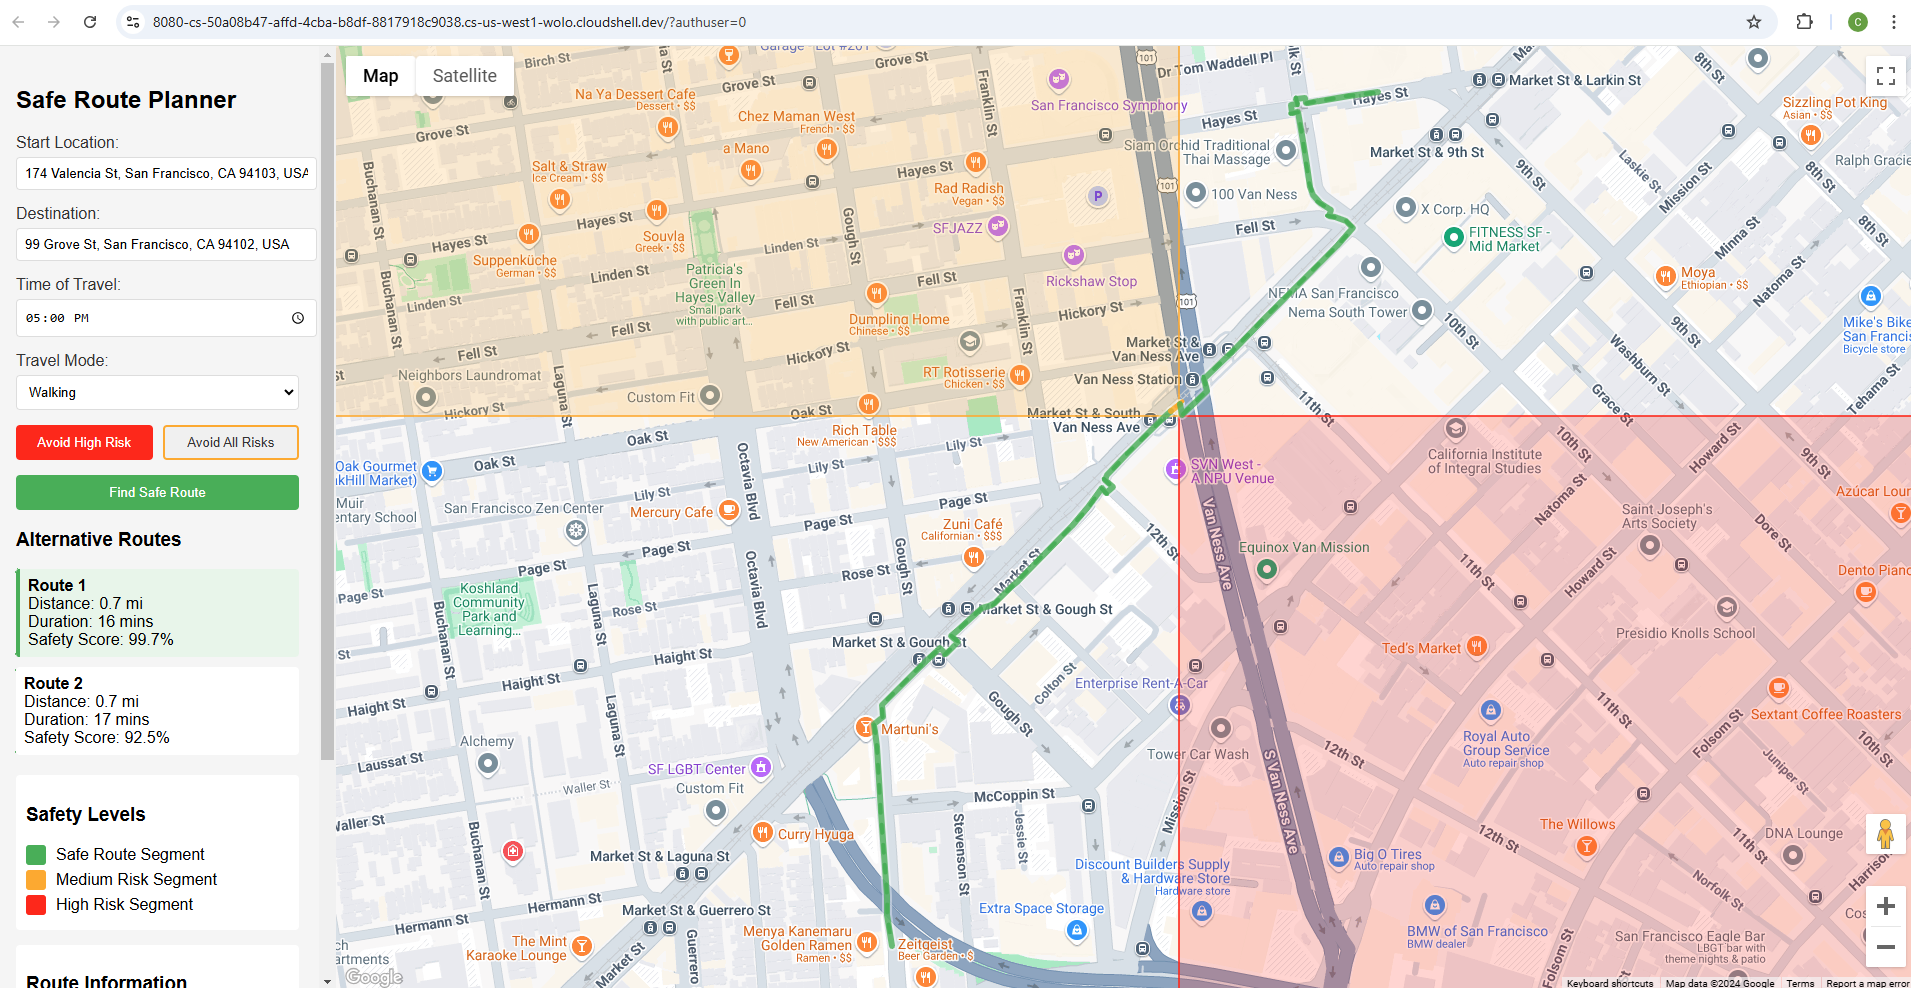
Find Safe Route (avoiding enabled)
-
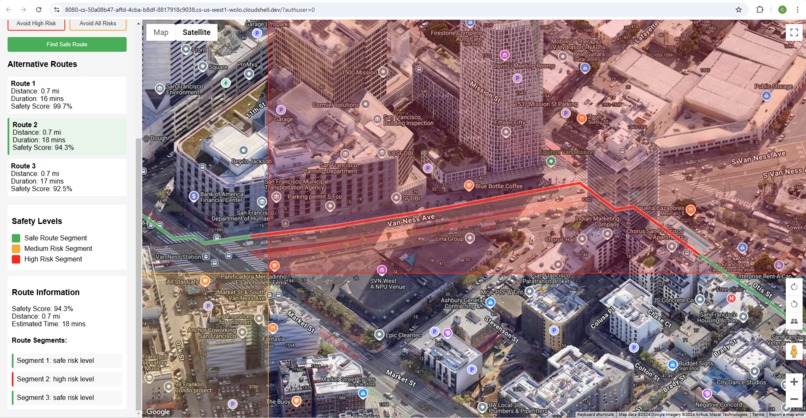
Avoid High Risk (Zoom to high risk)
-
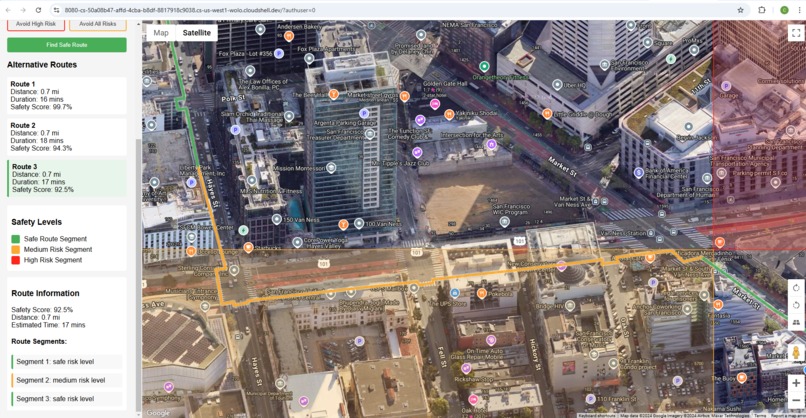
Avoid High Risk (Zoom to medium risk)


Inspiration and What it does
Urban safety remains a critical concern for many individuals, particularly in large metropolitan areas. Existing navigation tools primarily focus on distance and time, overlooking crucial safety considerations. SafeRoute addresses this gap by:
- Integrating real-time crime data
- Visualizing potential danger zones
- Calculating safety scores, and risk scores
- Dynamically routing users through safer paths
- Providing an immersive, interactive experience
How we built it, and Challenges we ran into
Core Features
Safety-Driven Route Planning
- Incorporates historical crime data and real-time safety indicators
- Dynamically calculates routes that minimize exposure to high-risk areas
- Adapts recommendations based on time of day and current urban conditions
Photorealistic 3D Visualization
- Utilizes Google Maps Platform Photorealistic 3D Maps to create an immersive navigation experience
- Renders danger zones with semi-transparent polygons in varying intensity colors
- Provides realistic urban context that enhances user understanding of their environment
Gamification Elements
- Safety Score: Users earn points for choosing safer routes
- Risk Visualization: Color-coded danger zones with interactive tooltips
- Personalized safety recommendations based on user preferences and historical data
Technical Stack
- Frontend: React.js
- Development: Google Cloud Shell Scripter
- Mapping: Google Maps JavaScript API
- 3D Rendering: Google Maps Platform Photorealistic 3D Maps
- Data Integration: Crime API, Geospatial Data Services
Challenges with safety-focused features:
- Safety Features:
- Visualization of high and medium risk areas
- Route calculation that avoids dangerous areas
Safety scorefor each routeTime-based warnings for late night travel- Alternative route suggestions
- Real-time safety information
- Interactive Elements:
- Address autocomplete
- Time of day selection
- Travel mode options (walking/transit)
- Interactive map with danger zones
- Clear safety information display
- Safety Calculations:
Risk scorecalculation based on proximity to danger zones- Route optimization for safety
Time-based risk assessment- Distance and duration estimates
Accomplishments that we're proud of
UI friendliness
- Enhanced Location Input:
- Added full Places Autocomplete support for both start and destination fields
- Users can now enter business names, landmarks, or addresses
- Added validation to ensure selected locations are valid
- Improved place search with both establishments and geocoded locations
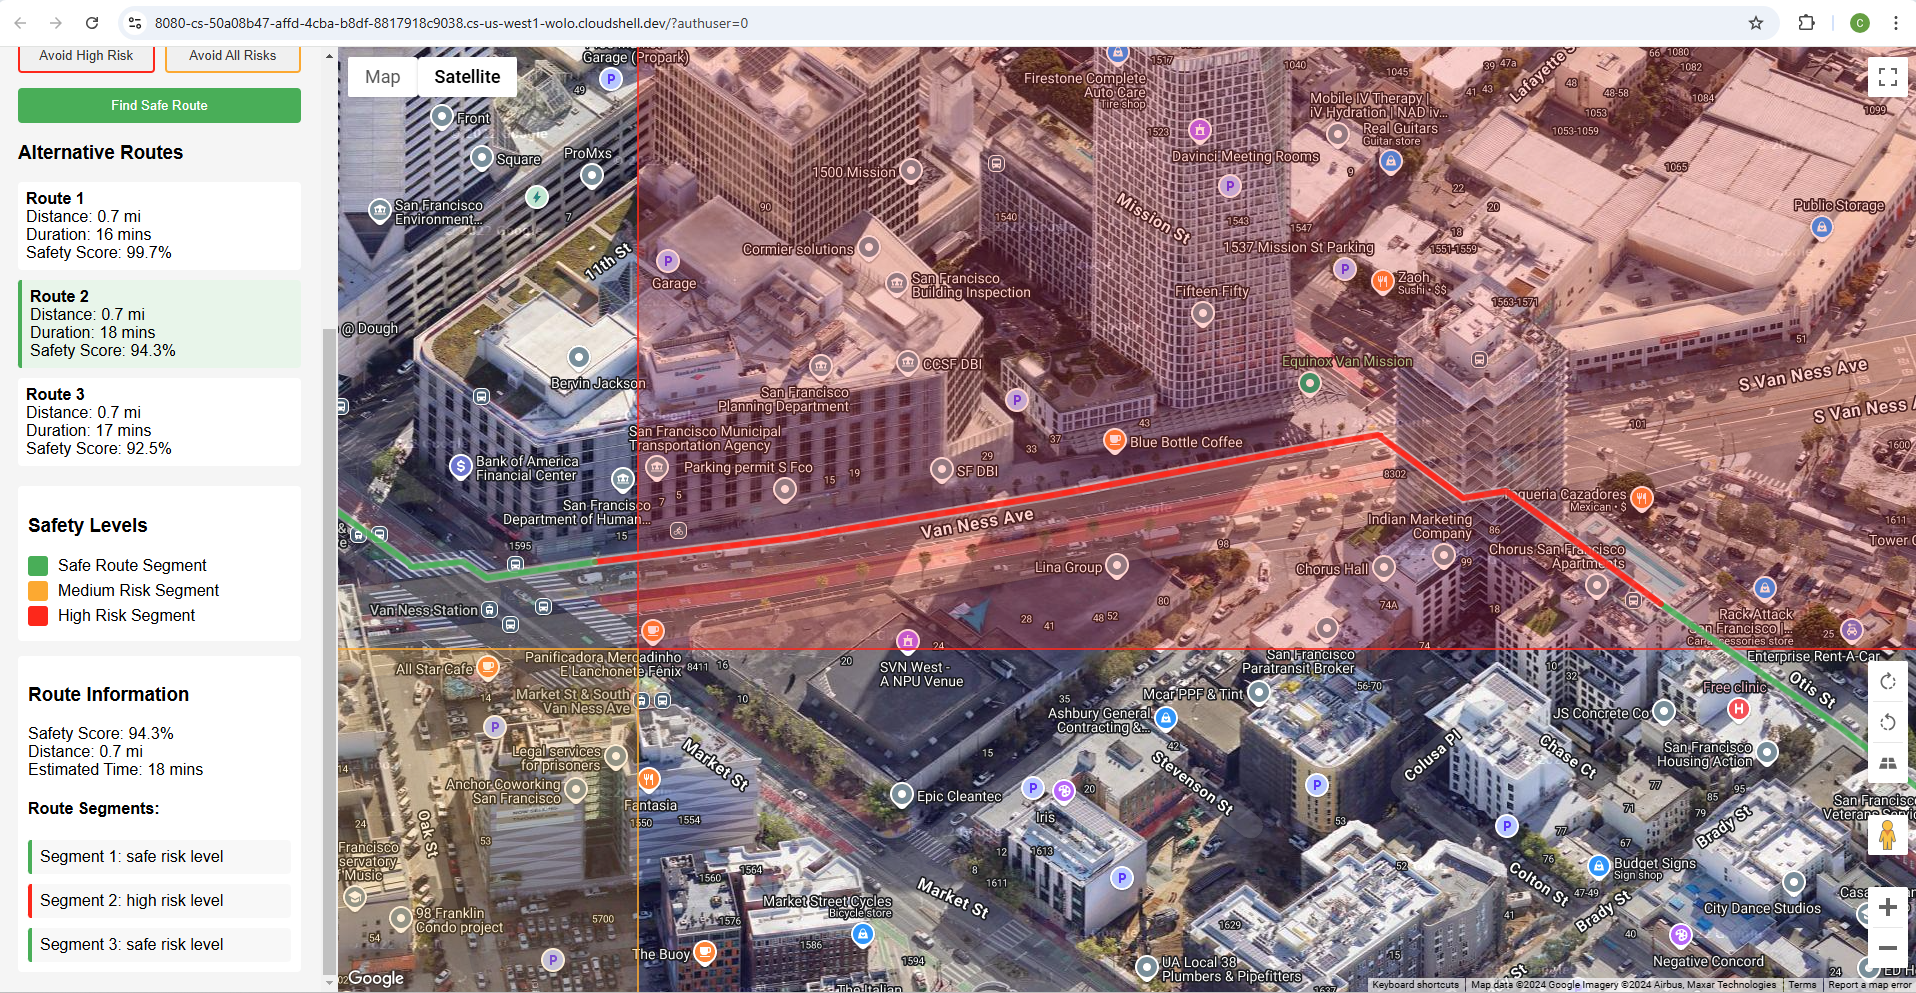
- Route Visualization:
- Routes are now color-coded based on risk level:
- Green: Safe segments
- Orange: Medium risk segments
- Red: High risk segments
- Each segment is drawn as a separate polyline with appropriate coloring
- Added a new route segments panel showing the risk level of each segment
- Highlighting Effects:
- Added a glowing effect to routes (Routes now have a white outline for better contrast)
- Created a shadow effect for better visibility (Increased visibility with drop shadows)
- Implemented hover interactions
- Added animated dash effects along the route (Smooth animations for user interactions)
- Different highlighting for different risk levels
- UI Improvements:
- Updated the legend to match the new route visualization
- Added route segments information in the sidebar
- Improved input placeholders to clarify that business names can be used
- Added better error handling and user feedback
- Interactive Features:
- Routes highlight on hover
- Animated dashes show direction of travel
- Increased visibility when interacting with route segments
- Performance Considerations:
- Optimized animation timing
- Efficient use of Google Maps polyline features
- Proper z-indexing for overlapping elements
- Technical Improvements:
- Better segment detection and risk assessment
- Improved bounds handling to show the entire route
- Enhanced autocomplete configuration with specific fields and types
- Better error handling for invalid locations
Enhanced functionalities
Focused on finding alternative routes, I have made these enhancements
- Added Risk Avoidance Controls:
- New toggle buttons for avoiding high-risk and all-risk areas
- Visual feedback for active avoidance settings
- Logical coupling between the buttons (avoiding medium risk automatically avoids high risk)
- Enhanced Route Finding:
- Routes are now filtered based on risk avoidance settings
- Multiple alternative routes are generated and analyzed
- Each route is scored based on risk levels
- Routes that violate avoidance settings are filtered out
- Alternative Routes Display:
- Added a new section showing alternative routes
- Each alternative shows distance, duration, and safety score
- Routes can be selected to view on the map
- Selected route is highlighted in the list
- Visual Improvements:
- Color-coded buttons matching risk levels
- Active state styling for avoidance toggles
- Clear visual hierarchy for route alternatives
- Interactive route selection
What we learned
I have learnt a lot on the technical side:
- Click Listener: A click event listener is attached to each segmentDiv within the updateSafetyInfo function. This ensures that when a segment description is clicked, the associated code executes.
- LatLngBounds: Inside the click listener, a LatLngBounds object is created. This object defines a rectangular area on the map. We extend the bounds to include all the points within the clicked segment.
- map.fitBounds(): The map.fitBounds(bounds) function is used to re-center and zoom the map so that the entire LatLngBounds (i.e., the clicked segment) is visible.
- Conditional 3D View: Added conditional 3D view based on the segmentLength. If the segment is shorter than a defined threshold (5km in the example), 3D is enabled. Adjust the threshold as you see fit for your application.
- map.setTilt() and map.setHeading(): Inside the conditional, map.setTilt() applies a tilt to the map view, creating the 3D perspective. Experiment with values between 0 (flat) and 90 (maximum tilt). map.setHeading() can rotate the map for optimal viewing. You can set this to be dynamic based on the orientation of the line segment for more advanced behaviour.
What's next for SafeRoute
To enhance this further, I plan to add these features:
Add real crime data integration:
- Police department APIs
- Crime statistics databases
- Real-time incident reports
Add safety features:
- Emergency contact integration
- Live location sharing
- Well-lit route preferences
- Public area preferences
Enhance time-based features:
- Historical crime data by time
- Business hours along route
- Public transit schedules
Add community features:
- User-reported incidents
- Safe haven locations
- Community ratings for areas
- Crowdsourced safety updates
Implement machine learning for more accurate predictions
Develop mobile application version
Built With
- google-directions
- google-distance
- google-distance-matrix
- google-geocoding
- google-places
- googlemapsjavascriptapi
- googleshelleditor
- html
- javascript

Log in or sign up for Devpost to join the conversation.