Inspiration Every day, students cycle to Laurier, parents drive kids to school, and commuters navigate Kitchener's streets completely unaware that some intersections they cross daily have seen dozens of collisions over the past decade. That invisible risk is the problem. The City of Kitchener publishes detailed collision data openly, but it sits in a spreadsheet that nobody looks at. We wanted to change that.
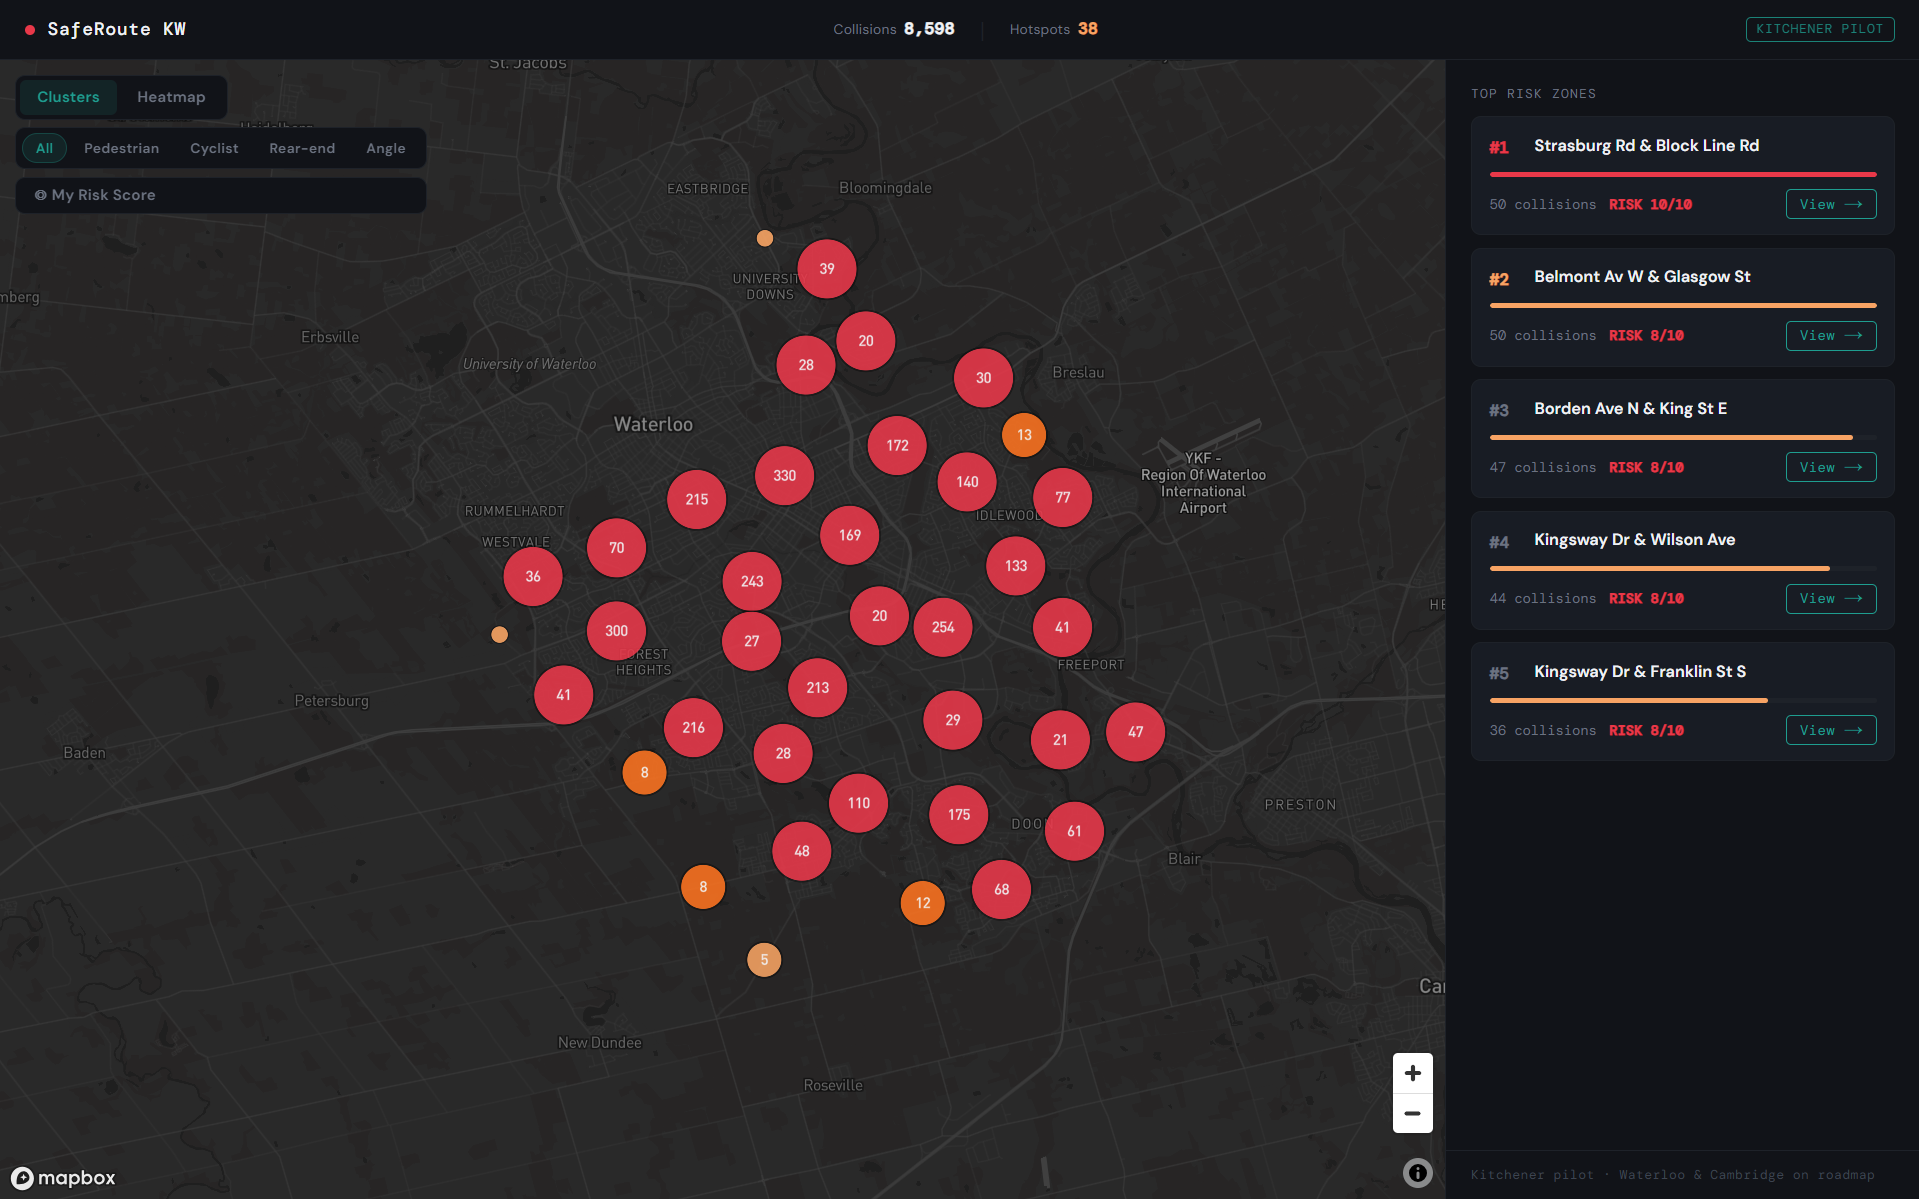
What it does SafeRoute KW transforms 8,598 real Kitchener collision records into an interactive safety dashboard anyone can use. The app maps every collision hotspot across the city on a dark Mapbox dashboard with colored clusters amber for moderate risk, red for high risk. You can toggle to a heatmap view to see danger density across the whole city at a glance, or filter by collision type to see only pedestrian, cyclist, rear-end, or angle incidents.
Click any intersection and the app instantly explains why that location has high collisions using a rule-based analysis engine built from the real data no generic AI, just pattern-matched explanations tied to actual collision breakdowns. You also get three ranked infrastructure fix recommendations with impact and cost ratings. Hit Simulate Fix to see a before/after projection of what that intervention would actually do to the safety score and collision rate.
The My Risk Score button uses your location to find the highest-risk intersection near you within 5km — so a student standing on campus can instantly see the most dangerous nearby intersection. Every analysis can be exported to clipboard as a formatted report for sharing with city planners or local representatives.
How we built it Built in under 24 hours. The data pipeline starts with the raw City of Kitchener Open Data CSV a Node.js script using PapaParse groups 8,598 individual collision records into 3,449 intersection clusters using haversine distance calculations, computing risk scores, collision type breakdowns, severity distributions, and peak time windows for each cluster. The frontend is Next.js 14 with Tailwind CSS and Mapbox GL JS for the map. The analysis engine is entirely rule-based and client-side no external AI API calls, no latency, no failure points. The simulate fix scoring uses improvement factors derived from published Ontario infrastructure intervention outcomes.
Challenges we ran into The biggest challenge was the raw data itself — 330 rows had zero coordinates and needed to be filtered, boolean fields used inconsistent representations across rows, and intersection names had to be parsed from a freeform notes field. Building a clustering algorithm that grouped nearby points meaningfully without over-merging distinct intersections took significant tuning. Keeping the entire analysis engine deterministic and offline was a deliberate constraint that required building the full rule and fix mapping system from scratch.
Accomplishments that we're proud of Shipping a complete, polished, data-driven product when the experience we have in under 24 hours using real open data is something we are really proud of. The My Risk Score geolocation feature finding your nearest high-risk intersection in real time. The simulate fix panel showing meaningful before/after impact projections. The fact that the app never makes an external API call for analysis it works instantly, every time, without failure.
What we learned Real open data is messier than expected but more powerful than any mocked dataset. A deterministic rule-based engine can be just as compelling as an AI API call and far more reliable in a demo. Scoping ruthlessly and shipping one complete loop beats building five half-finished features.
What's next for SafeRoute Region-wide KW coverage by integrating Waterloo and Cambridge open data portals. A real-time traffic layer overlay. Exportable PDF reports formatted for city planning submissions. Every Canadian municipality publishes this data. SafeRoute scales nationally. As well as producing a mobile app so everyday citizens can use easily and for free, so they know where to be careful and how to stay careful while navigating our busy world.
Built With
- gl
- mapbox
- nextjs.
- node.js
- tailwindcss
- typescript
- vercel


Log in or sign up for Devpost to join the conversation.