Inspiration
We wanted to find safe investments for housing across the country due to overall market outlook and our passion for environmental change. As a result, we started aggregating environmental natural disaster data and kept going from there.
What it does
We collected county-level disaster data from FEMA's National Risk Index, included housing financial data from Zillow, and performed risk analysis through a few complex formulas.
From FEMA NRI:
Expected Annual Loss: $$EAL = P(hazard) × exposure × damage$$
From combining FEMA and Zillow Data:
Risk Ratio: $$RR = Total Building Value / Expected Annual Loss$$
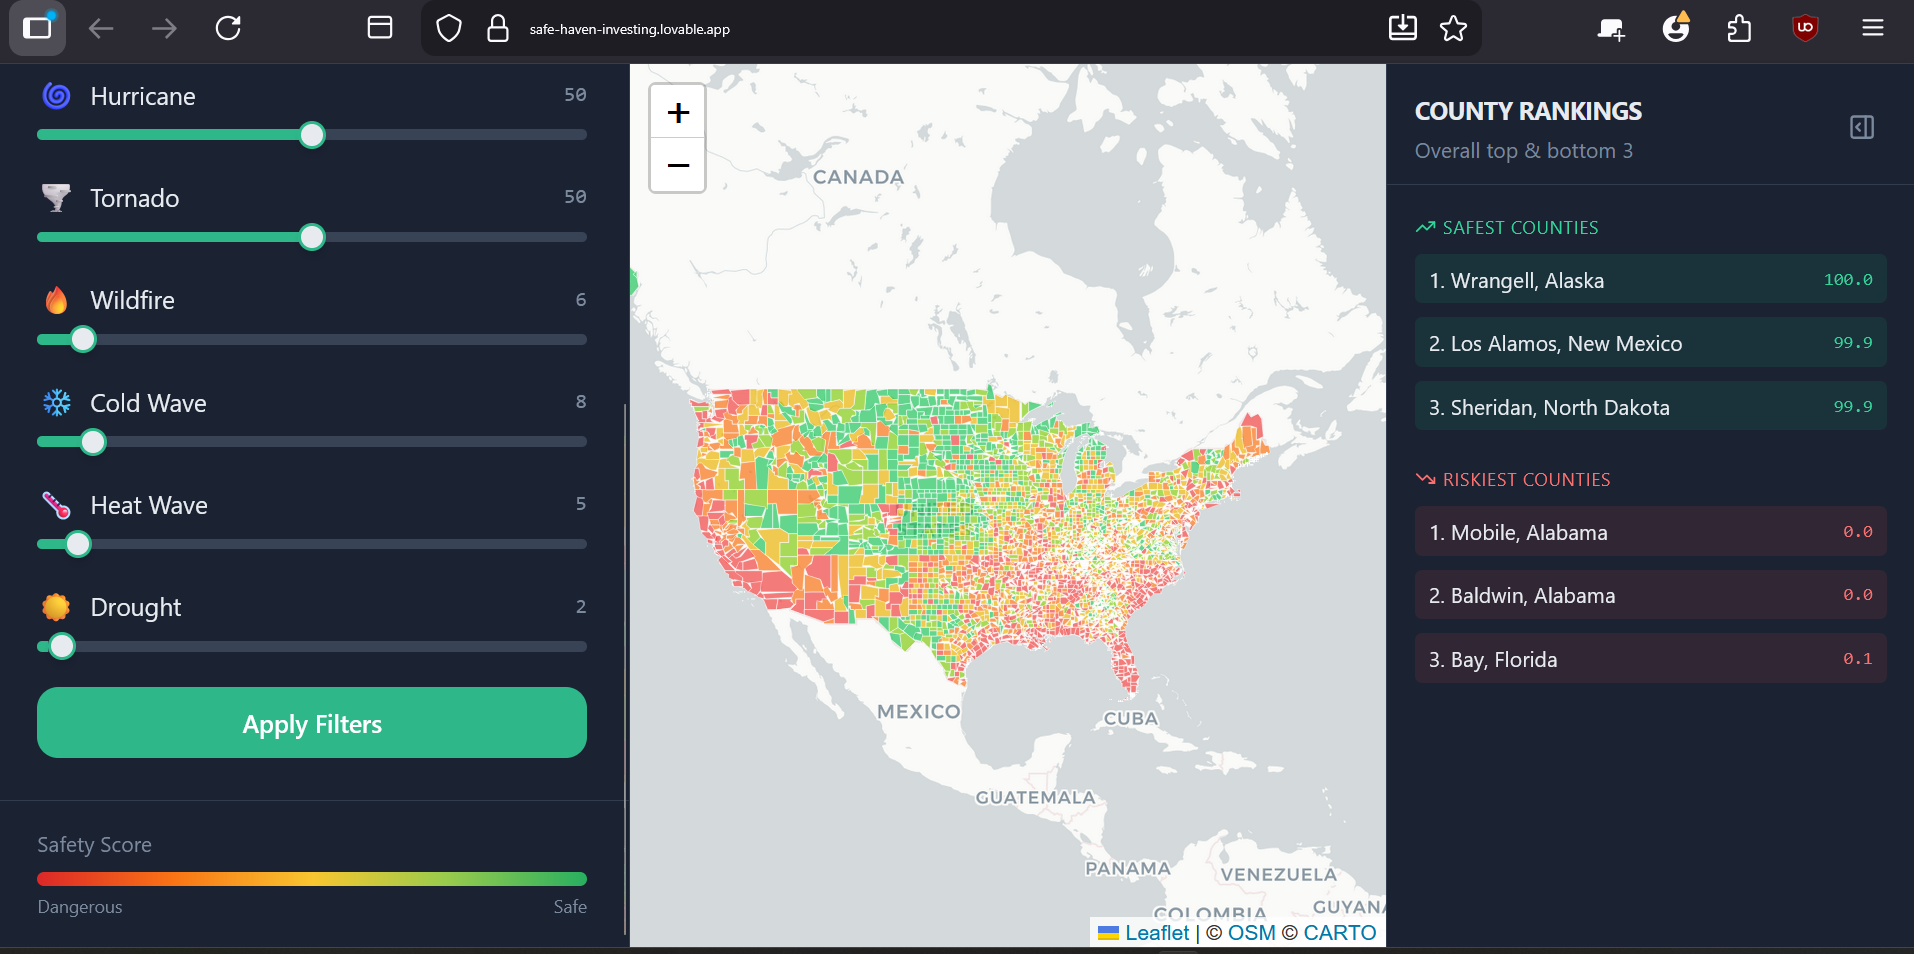
The frontend UI takes in input sliders from the user and adjusts the risk calculations based upon the user's preferences. For example, if the user is okay with earthquake risk, they set it to zero, and places with higher earthquake risk have overall more improved scores.
How we built it
From there, we developed several python scripts to automate these mathematical processes and compile these new risk calculations alongside the county data. We then built a geojson mapping and were able to host the data so that the FastAPI could handle receiving inputs and sending data out to the frontend.
We used Lovable as a framework to develop the frontend and assist with TypeScript development while we curated the UI to be user-friendly.
Challenges we ran into
We ran into several challenges throughout our design process.
Our original plan was to incorporate Zillow’s Zestimate API to allow for an address-level lookup model. Ultimately, obtaining the API took time that we did not have, up to 6 weeks, so we were made to move to a county-level model.
This then led to some confusion with aligning multiple datasets with different spatial resolutions and formats. FEMA’s National Risk Index is county-based, Zillow data is metro-based, and ZIP-to-county crosswalks introduce weighting complexities. Ensuring consistent GEOID formatting became necessary before proceeding.
We finally encountered frontend–backend integration issues, including CORS configuration, mismatched hazard key names between the slider UI and backend model, and ensuring the map dynamically refreshed its GeoJSON source after recalculating scores, which required several iterations of normalization and scaling adjustments.
Accomplishments that we're proud of
We are very proud that we have a fully-published, publicly accessible site that any user with the address can use and test.
The map being interactive and displaying the statistics that we hand-processed was very gratifying, as we worked on data processing and conversion to geojson, a format none of us were truly familiar with beforehand.
What we learned
We as team members learned a lot more about TypeScript and overall frontend work, as none of us were particularly strong at frontend development from the start. We learned how to make composite scoring out of the various statistical inputs, a new form of statistical analysis. We did also end up learning far more about which areas of the country were prone to various disasters and how to protect potential countrywide investments.
What's next for SafeHaven
We plan to continue this to use FEMA and Zillow's APIs so that we can pull live data and give our users the most accurate scoring possible. We also plan to improve our modeling, including more data from various housing markets to be integrated into the scoring system so that users can be sure that their investments will grow.
Built With
- css
- fastapi
- html
- lovable
- python
- typescript

Log in or sign up for Devpost to join the conversation.