-
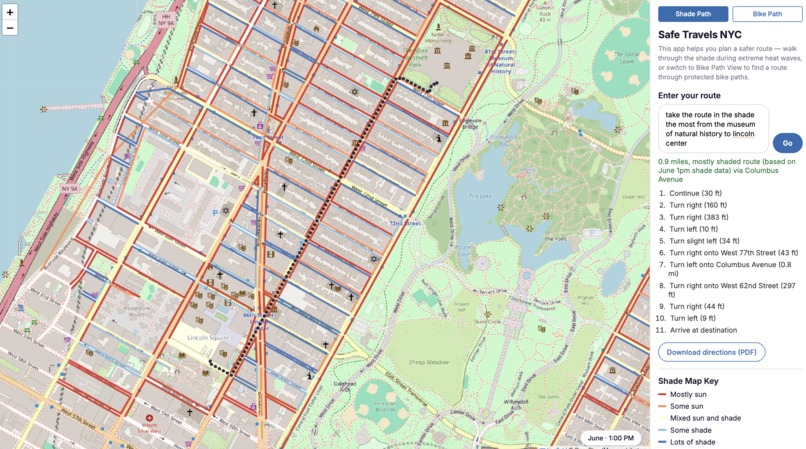
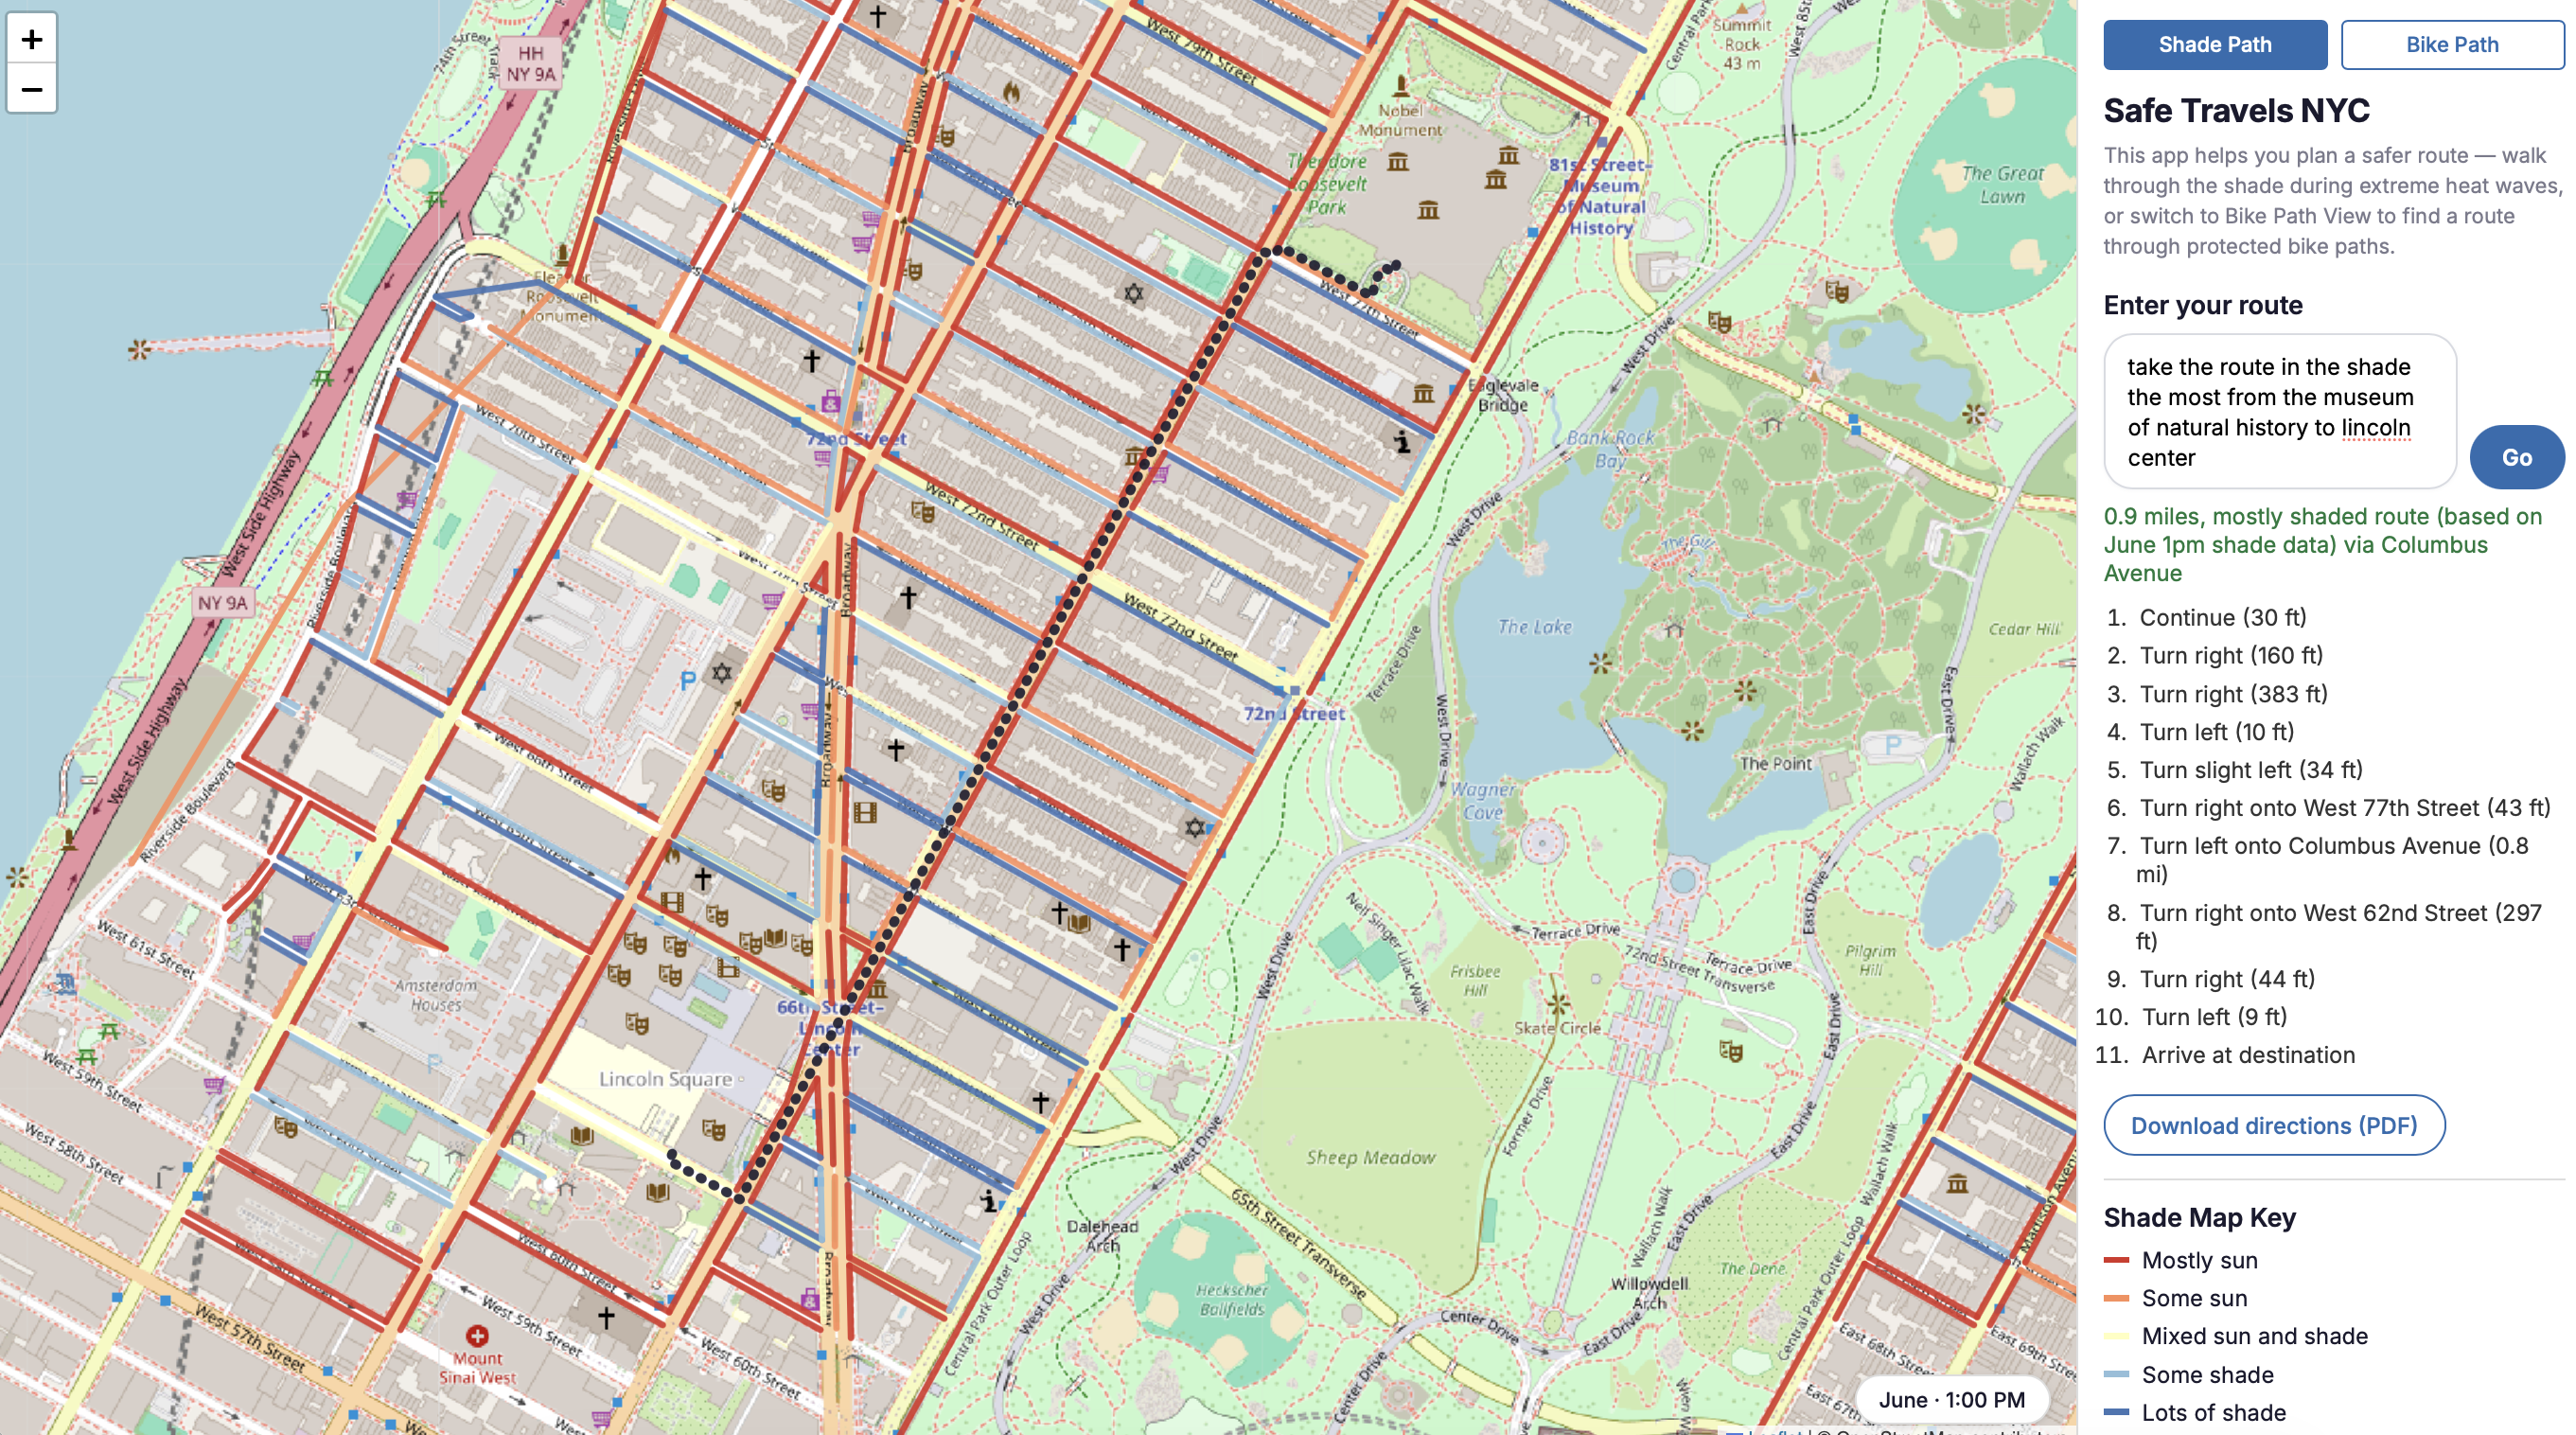
Shaded path example
-
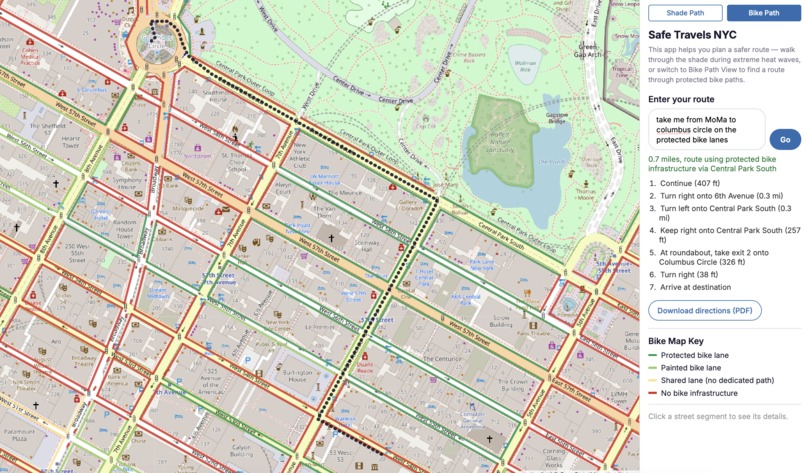
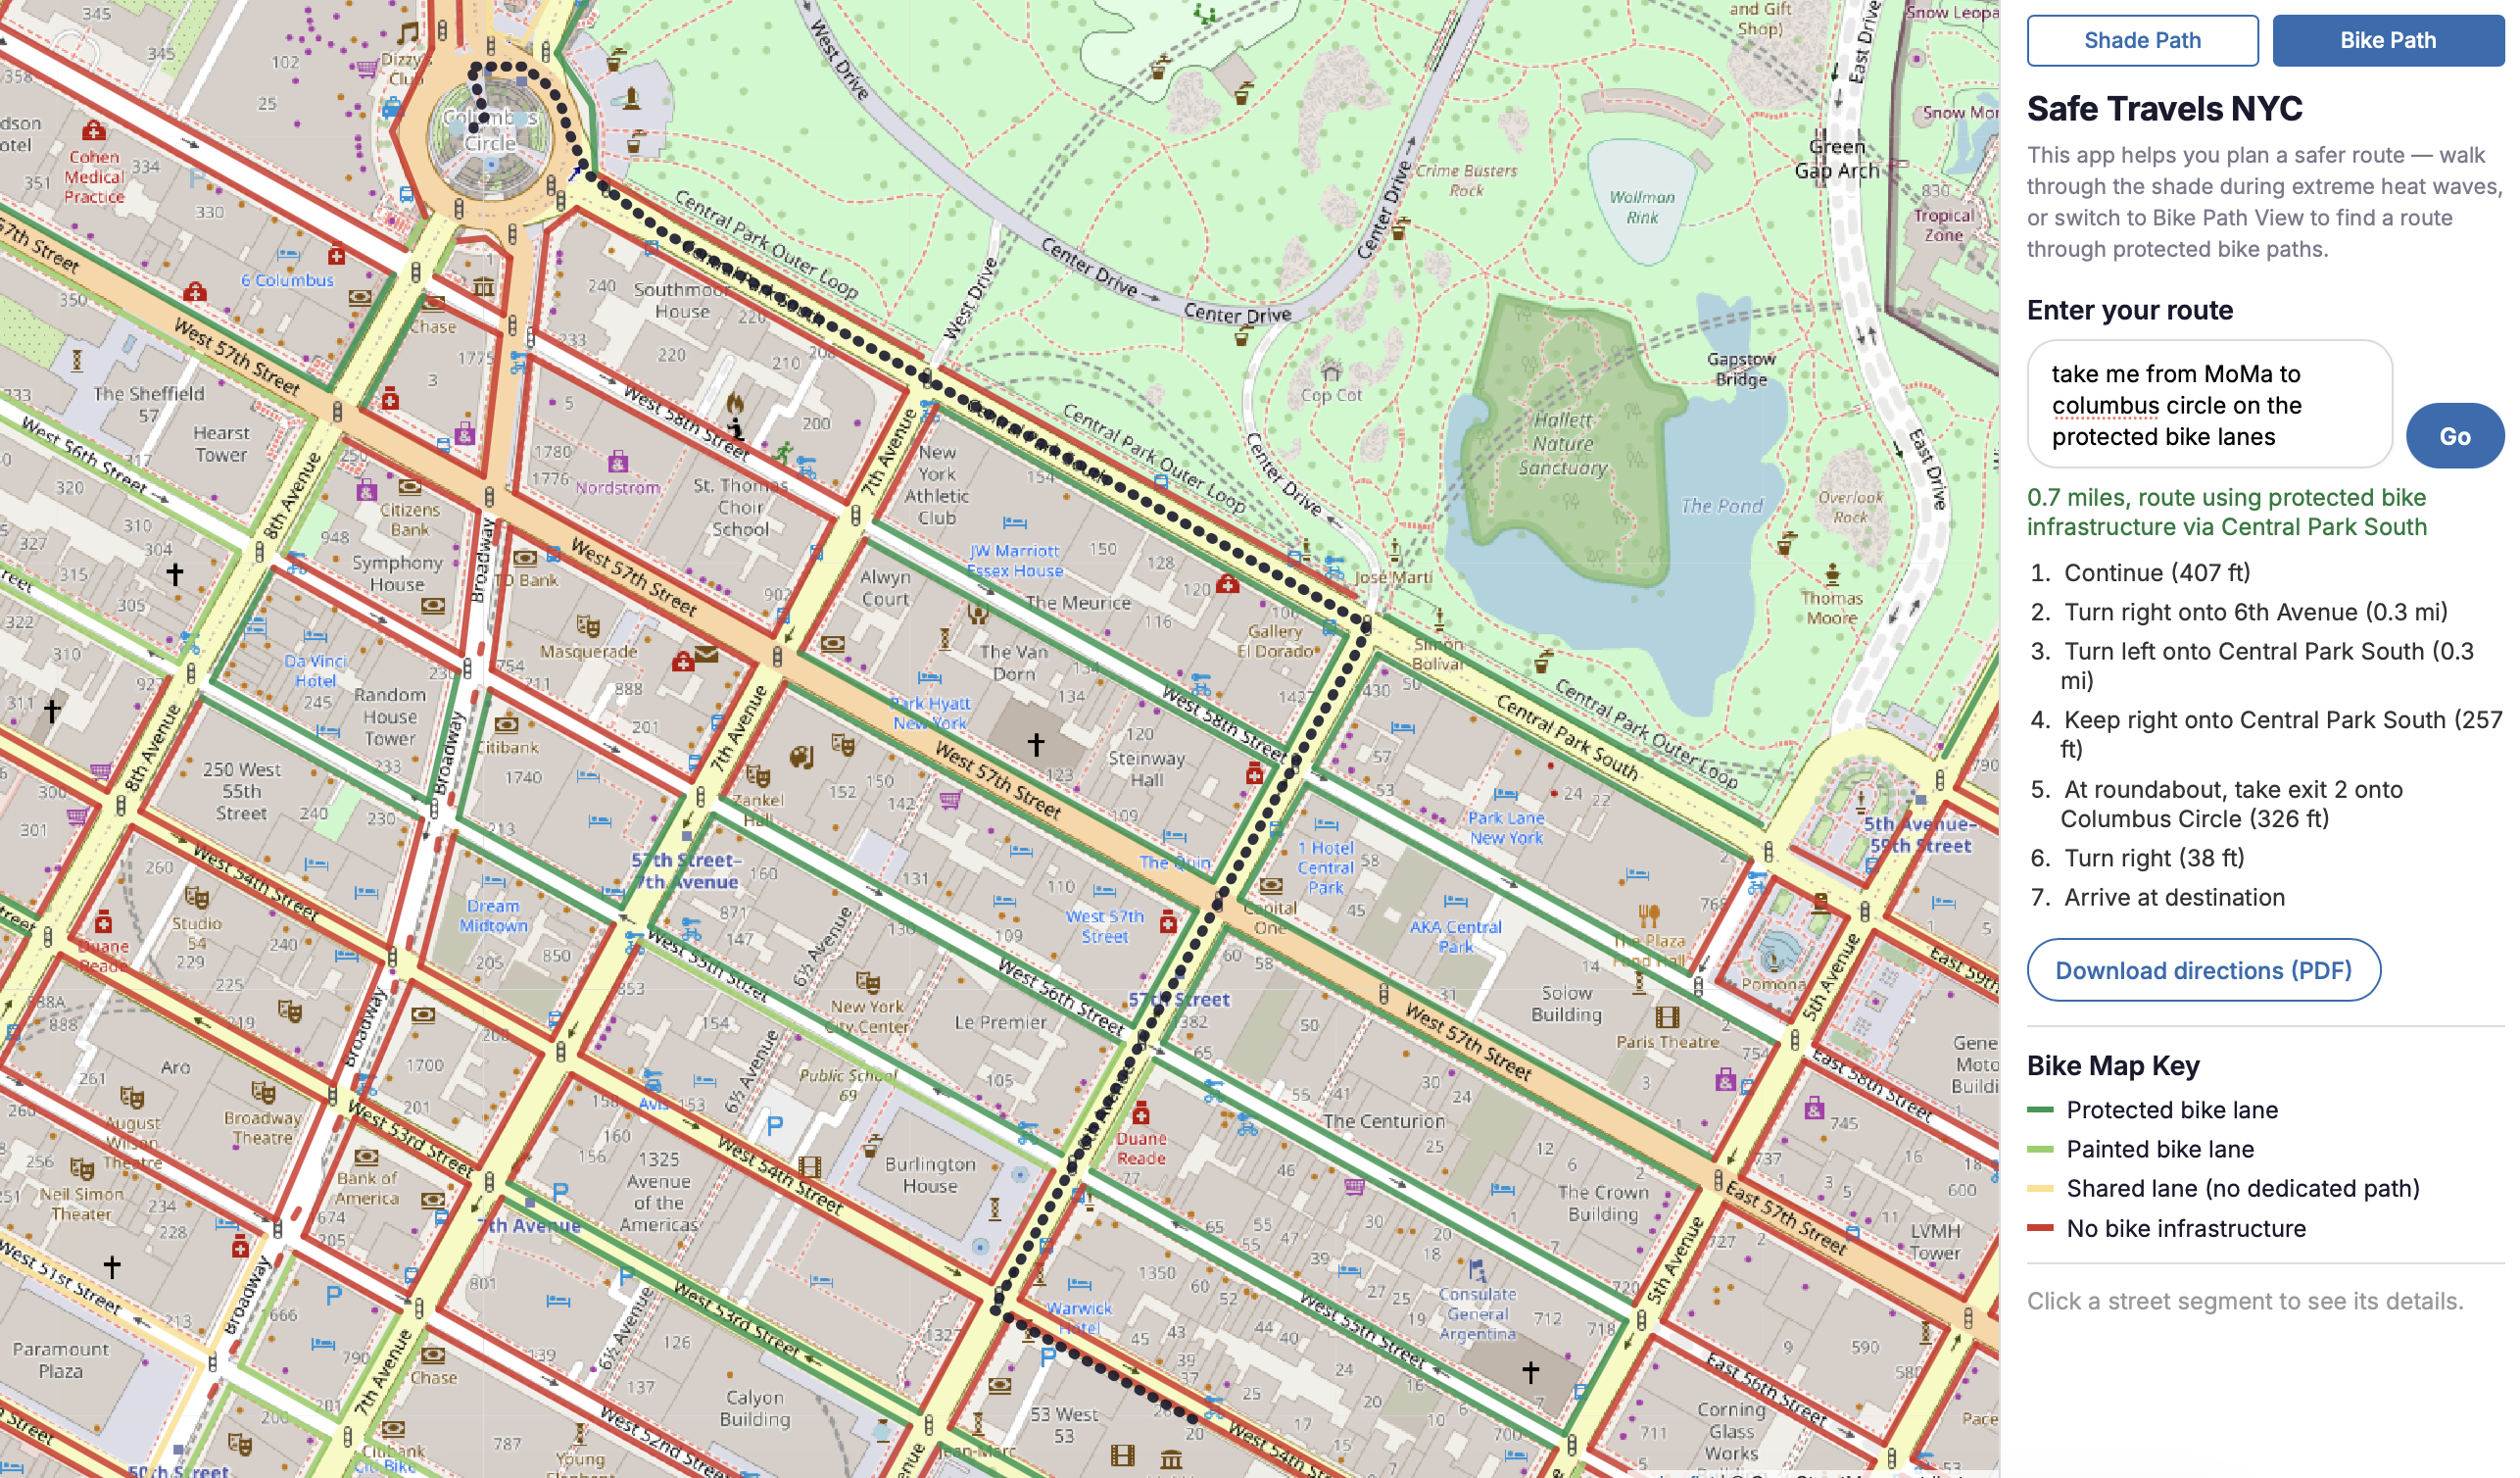
Bike path example
Inspiration
I was inspired by the effect of heat waves, and how the trajectory of the sun changes the likelihood of you walking on a path with shade. I was also inspired by how bikers would rather bike on protected paths versus on the street with cars.
What it does
My web app allows a user to enter a text query that will calculate a route that will either be in the most shade or along the most protected biking paths.
How we built it
I built most of the app with Claude Code, initially creating three large architectural and infrastructural prompts in Claude Desktop. Using those, I went through three phases: data processing, navigation routing, and ai integration. I used NYC Open Data (Socrata) — building footprints, 2015 Street Tree Census blockface, NYC Bike Routes (queried directly via curl against data.cityofnewyork.us) for my data, and python and FlaskAPI for backend services. Initial testing was done for the Upper West Side. Then I used GraphHopper, Leaflet, OverpassAPI, and Nominatim for route navigation creation and visualization. Finally I used Anthropic API to handle the natural language querying, and translating those into JSON parseable format for GraphHopper. UI is built in JS and HTML/CSS.
Challenges we ran into
I ended up changing my idea halfway through development on the first day of the hackathon. I found out that someone had a similar idea, and after brainstorming, came upon this idea. However, it made me lose half a day of development, so I didn't have as much time to refine the UI as I would have liked.
I had challenges with validating the correcting of the shade calculations since those were calculated and moved to a library. I combined three different data sources, the building heights, tree data, and the trajectory of the sun, in order to come up with a score for how shady/sunny a street would be. These layers of data added complexity that was hard to virtually validate.
I also ran into issues with deciding what tools to use, like my decision to use GraphHopper. GraphHopper runs self-hosted in Docker, but my initial plan focused on using Valhalla. When I went to implement Valhalla, I realized that it wouldn't work if I want to specify a custom route. Hence, I found GraphHopper which thankfully could run in Docker which I've used before.
Accomplishments that we're proud of
I'm proud of my flexibility to switch to a new idea and use new tools that I've never used before. This is my first AI tool using Anthropic's API, and my first time building a project with GraphHopper, Leaflet, GeoPandas, and Shapely. It inspires me to use this more in future projects.
What we learned
I learned a lot about GraphHopper, Anthropic API, Leaflet, Docker, and GeoPandas. It also learned a new way of building with AI. Instead of starting to code just with an idea, I should come up with the architecture, plan steps, and tools I want to use in Claude Desktop beforehand. This allows me to have a better idea of how the codebase will grow, and it gave me better flexibility with pivoting in my plan since most infrastructure or architectural issues were caught earlier.
What's next for Safe Travels NYC
There are quite a few things I want to add to this tool. I will add the ability to send the route to Google Maps for immediate use, as well as make it mobile friendly. I also want to make the map work for the entirety of NYC. I want to ensure the routes are accurate as well. I'd improve the visuals for a more modern tool. The codebase is also a little messy, so I would clean it up and separate the JS scripting and styling in the web pages. I have seen the power behind this tool, and I'm excited to keep improving it!
Built With
- anthropicapi
- docker
- eclipse
- geopandas
- graphhopper
- leaflet.js
- python
- shapely

Log in or sign up for Devpost to join the conversation.