-
-

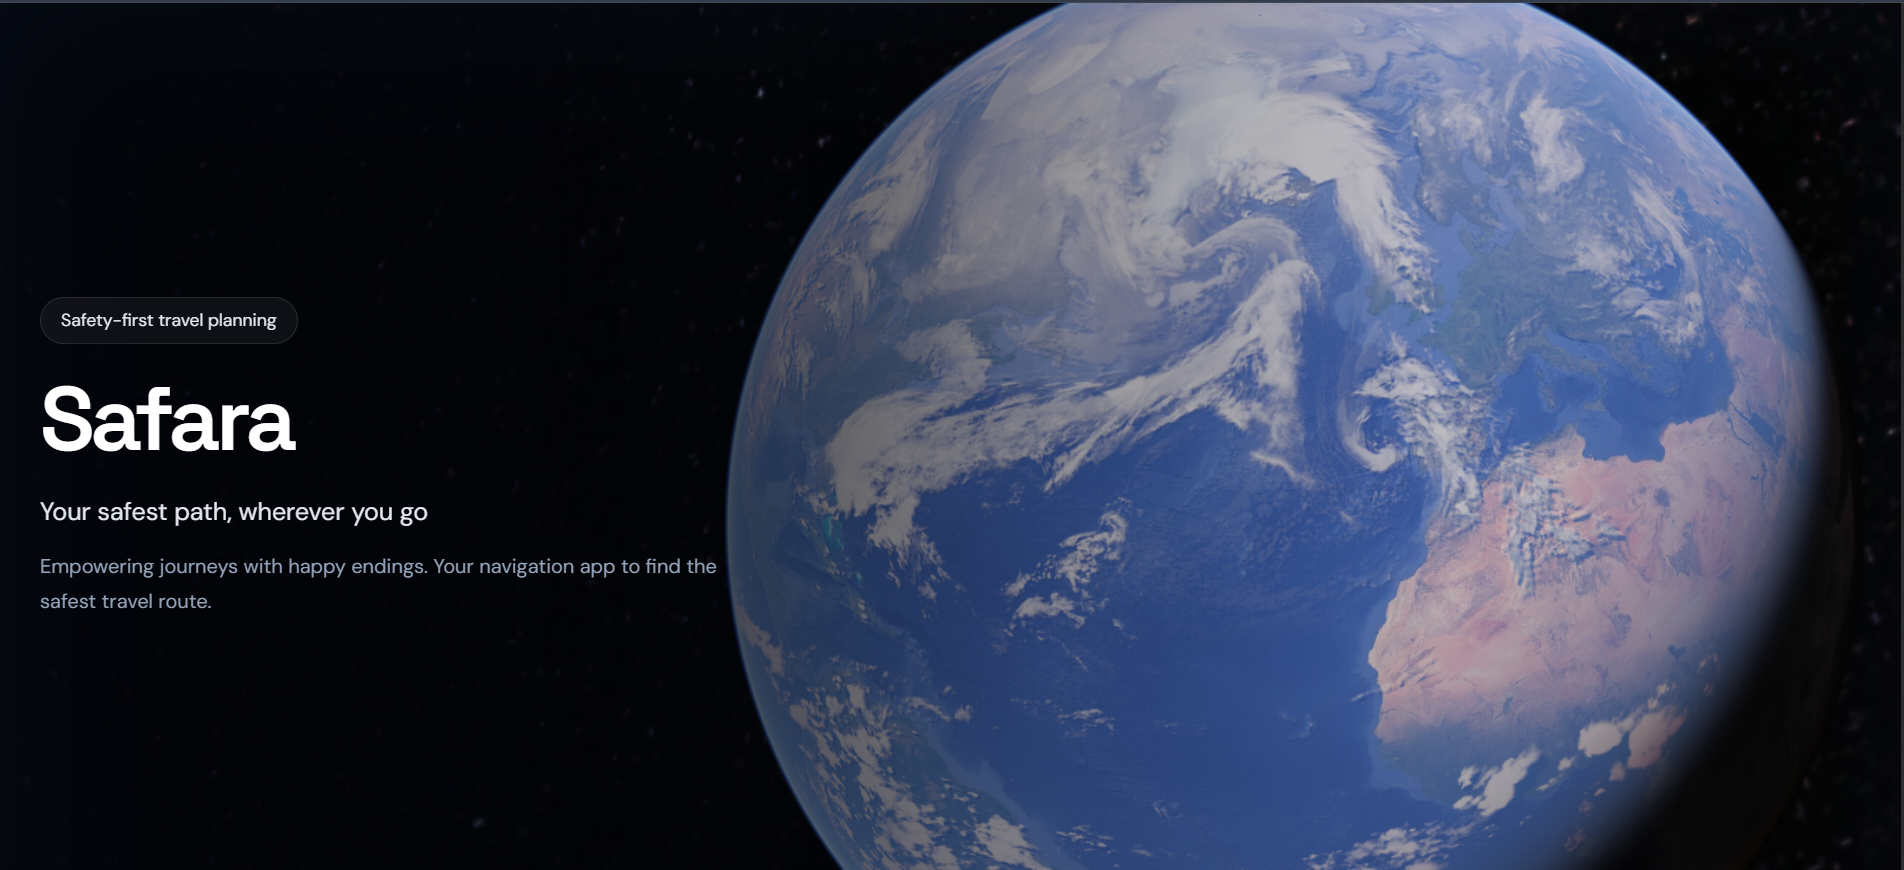
Landing Page
-
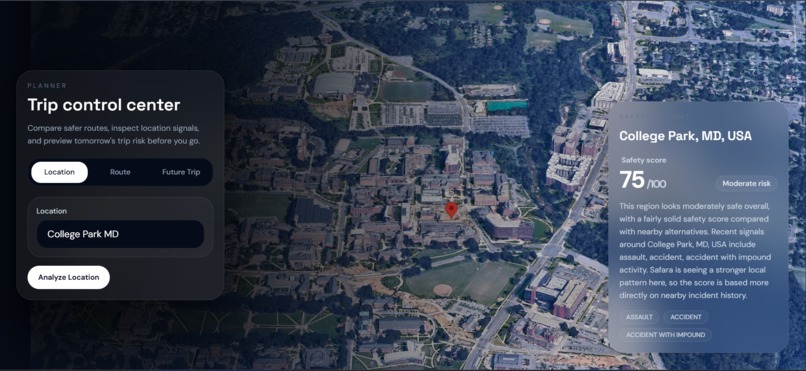
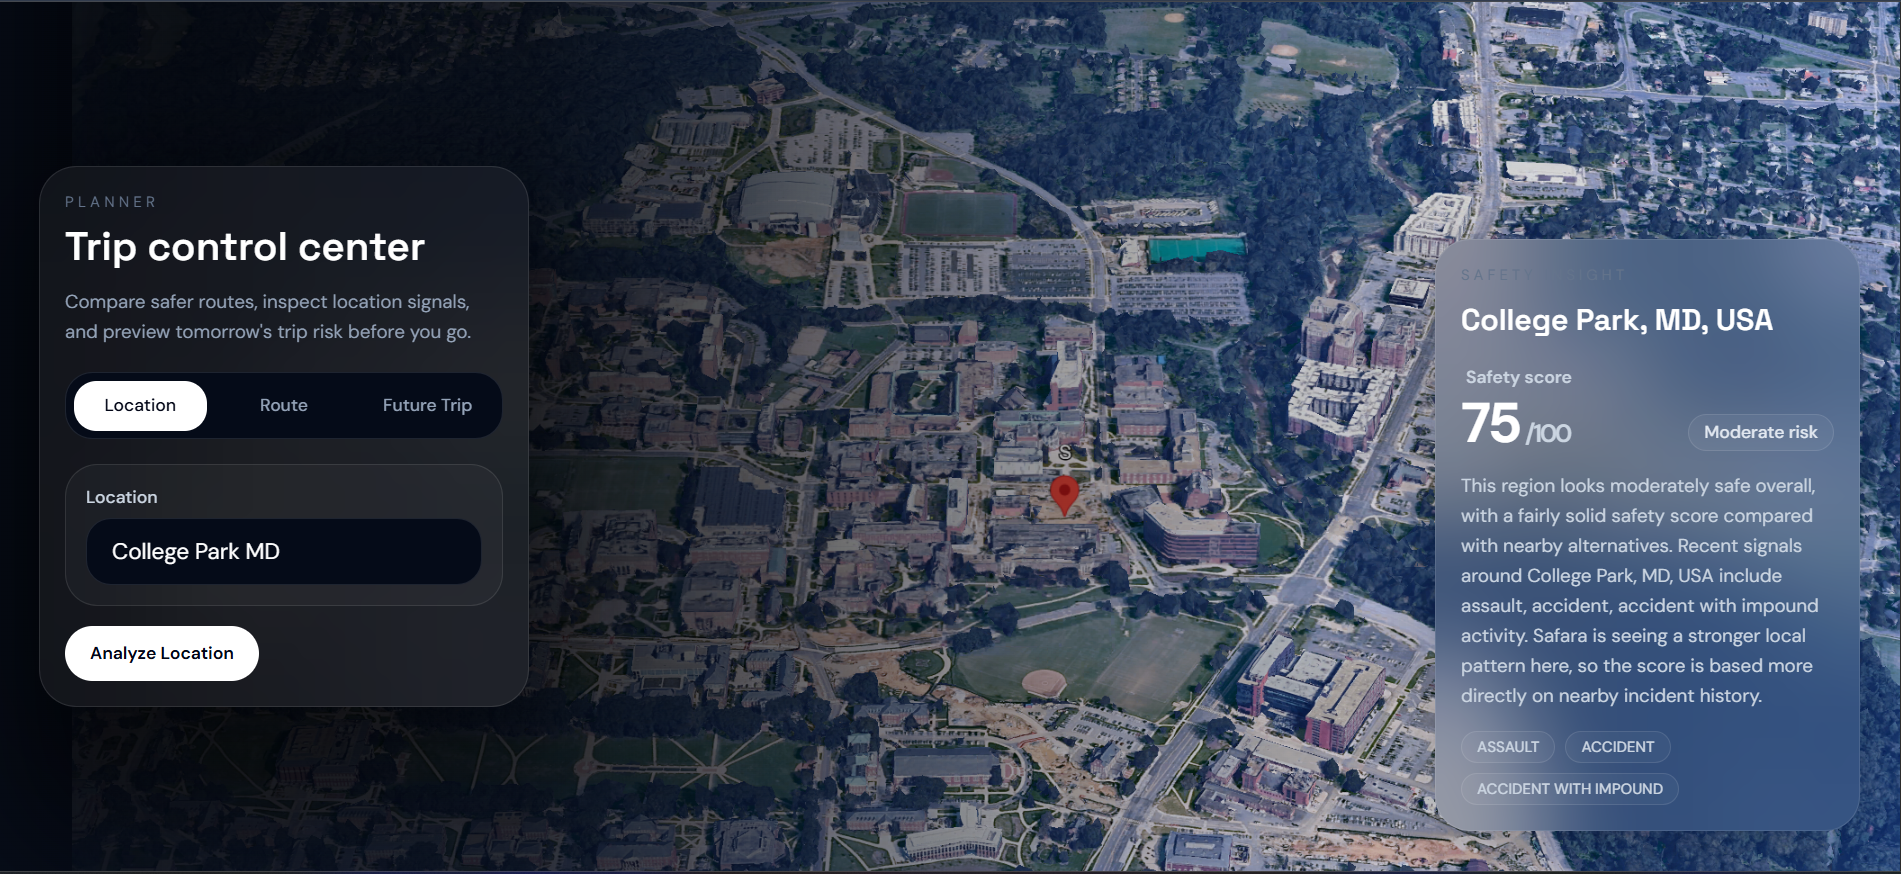
Safety of a Specific Location
-
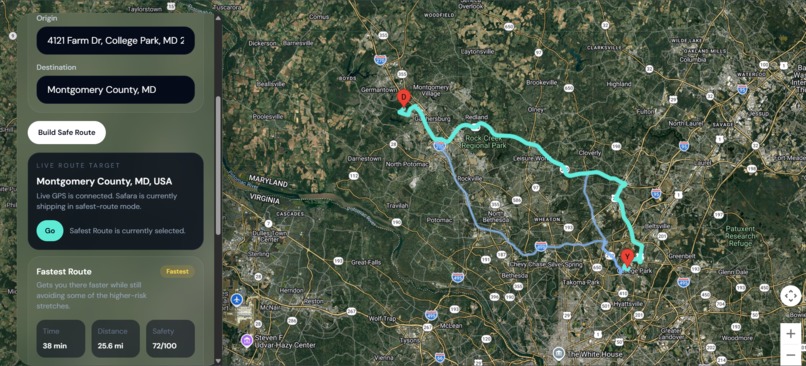
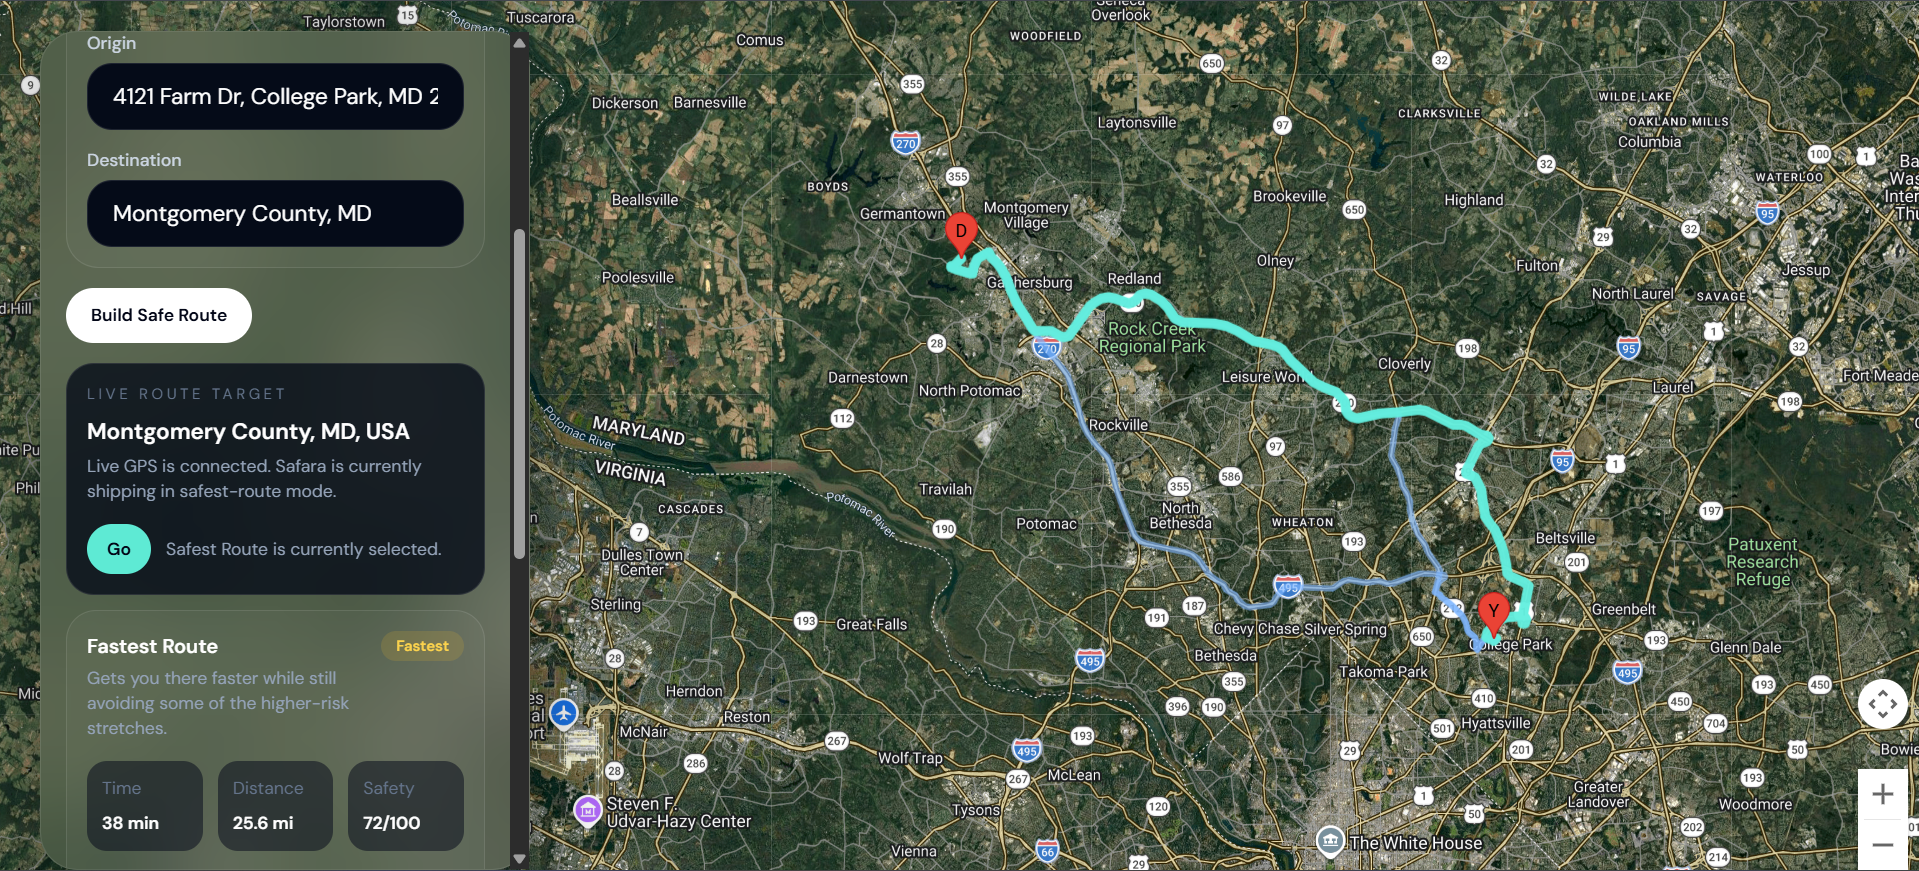
Getting Routes
-
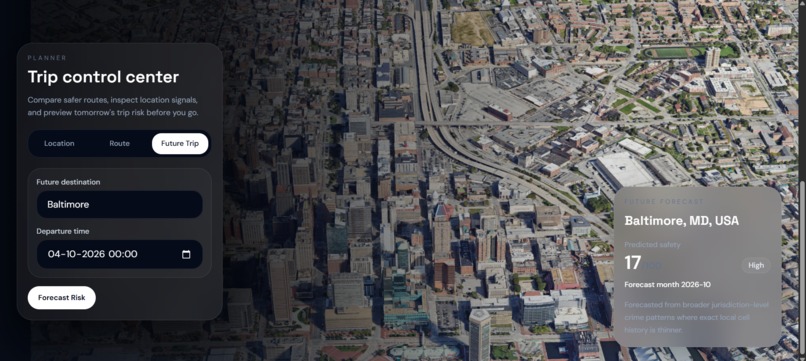
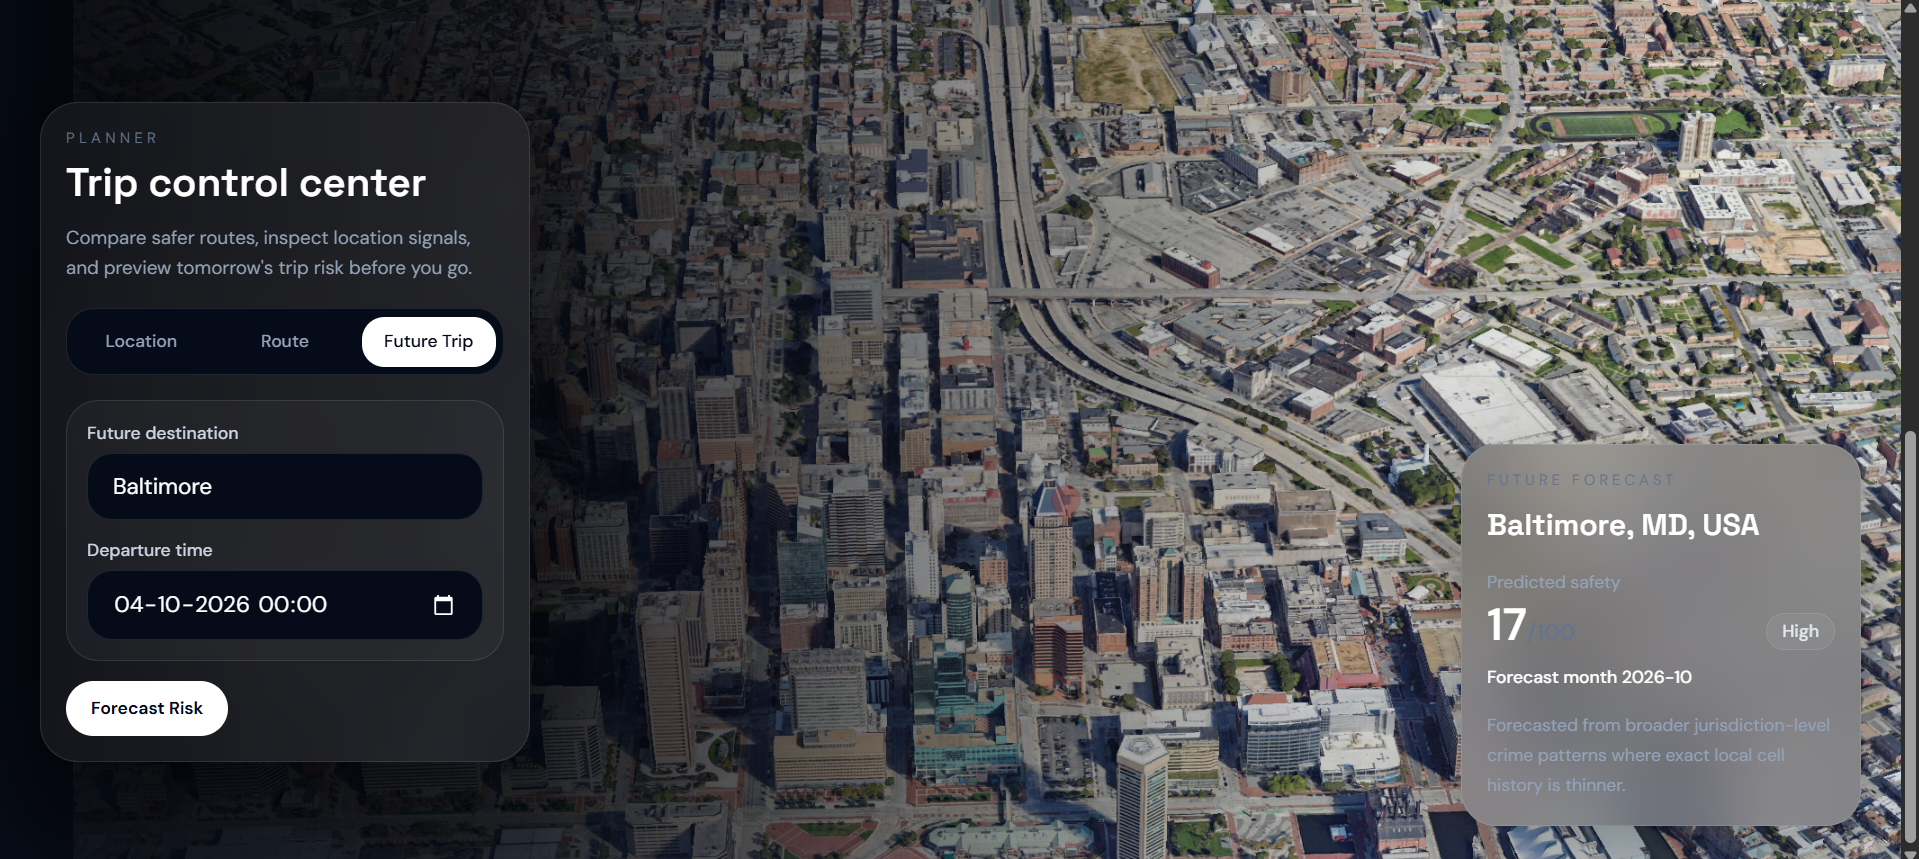
Future Risk Prediction
-
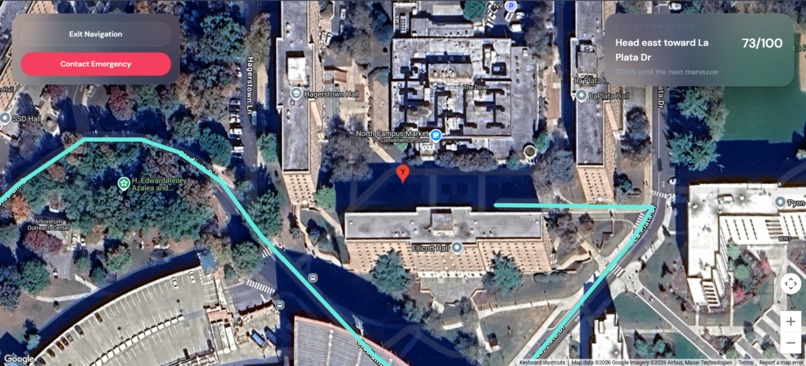
Navigation
-
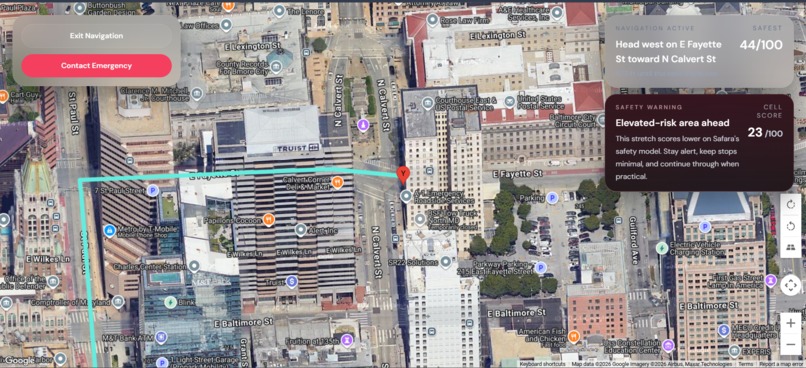
Alert When Entering Dangerous Zone


Inspiration
Safara was inspired by a simple problem: most navigation apps are built to optimize for speed, not safety. If someone is traveling late at night, commuting through an unfamiliar area, or planning a trip with personal safety in mind, they usually have to piece together that judgment themselves. Traditional maps can tell you the fastest route, but they do not help answer questions like: “Is this area relatively safe?” or “Should I take a slightly longer route if it avoids higher-risk corridors?”
We wanted to build a tool that treats safety as a first-class navigation signal rather than an afterthought. Our goal with Safara was to create a travel experience that gives users more context, more confidence, and more control over the choices they make when moving through a city.
We were especially motivated by the idea that public safety data is often technically available, but not easily usable in real decision-making. Safara turns that information into something practical: a location safety score, safer route comparisons, future trip forecasting, and in-navigation safety awareness.
What it does
Safara is a safety-first travel routing app focused on the Maryland and DC region.
It offers three main experiences:
1. Location safety lookup
A user can search for a place and instantly see:
- a safety score out of 100
- a readable risk label
- a human-friendly explanation
- a confidence signal indicating how strong the local data is
This helps users quickly understand whether a place appears relatively low-risk, moderate-risk, or higher-risk based on nearby incident patterns.
2. Safer route planning
A user can enter a destination and Safara builds multiple route options. Instead of only showing the fastest route, Safara compares alternatives such as:
- Safest Route
- Balanced Route
- Fastest Route
Each route is scored based on the risk characteristics of the areas it passes through. That means users can see the tradeoff between safety and travel time, instead of blindly following the shortest path.
3. Future trip forecasting
Safara also lets users forecast the risk level of a destination for a future date. This gives people a way to plan ahead and ask not just “Is it safe now?” but also “What might this area look like when I go?”
4. Active navigation support
During navigation, Safara keeps the selected route highlighted, follows the live user location, rotates the map based on heading when available, and monitors the current area for possible safety alerts. It also includes off-route rerouting logic and a demo emergency contact flow.
At a high level, Safara helps users not only get somewhere efficiently, but get there more safely.
How we built it
We built Safara as a modern web application using a Next.js frontend with TypeScript and Tailwind CSS. The interface uses Google Maps and Google Earth-style views to make the experience feel visual, immersive, and intuitive.
On the mapping side, we used:
- Google Maps JavaScript APIs for map rendering and geocoding
- Google Routes API to generate multiple route candidates and step data
- live browser geolocation for origin detection and navigation behavior
For the safety model, we built a deterministic spatial scoring pipeline around H3 hexagonal indexing. Instead of treating safety as a vague label, we mapped incident data into H3 cells and computed risk directly from the geographic distribution of crime reports.
The core scoring flow looks like this:
- Normalize crime datasets from multiple local and regional sources into a shared schema.
- Assign each event to an H3 cell.
- Weight each event by severity and recency.
- Aggregate those weighted events into a local cell-level crime score.
- Smooth the score across neighboring cells so the model is not too brittle.
- Fall back to a broader county baseline when exact local coverage is sparse.
- Convert risk into a user-facing safety score.
Conceptually, the scoring behaves like:
[ \text{Risk} \approx f(\text{severity}, \text{recency}, \text{local density}, \text{neighbor smoothing}, \text{baseline fallback}) ]
and then:
[ \text{Safety Score} = 100 \cdot (1 - \text{Risk}) ]
with bounds and calibration applied so the result remains interpretable and stable.
For route scoring, we decode each route polyline, map its geometry into H3 cells, look up the risk for each traversed cell, and compute metrics such as:
- average risk
- maximum risk
- count of elevated-risk cells
- route alerts
We then create deterministic route cost functions for different strategies:
[ \text{Fastest Cost} = 0.8 \cdot \text{Time} + 0.2 \cdot \text{Risk} ]
[ \text{Balanced Cost} = 0.5 \cdot \text{Time} + 0.5 \cdot \text{Risk} ]
[ \text{Safest Cost} = 0.2 \cdot \text{Time} + 0.8 \cdot \text{Risk} ]
This lets Safara rank routes in a way that is explainable and tunable.
For future forecasting, we added a future-risk pipeline that uses trained model artifacts and then calibrates those predictions against current local conditions. This keeps the forecast grounded in both historical patterns and present-day context.
We also integrated a demo emergency flow using Twilio to show how a safety-first navigation product could escalate support when needed.
Challenges we ran into
One of the biggest challenges was data quality and consistency. Crime data does not come in one neat format. Different local sources structure their fields differently, cover different years, and vary in precision. We had to spend a lot of time on ingestion, normalization, and cleaning before the scoring pipeline could be reliable.
Another major challenge was granularity. Exact cell lookups were often too brittle because a user might land in a cell with limited direct observations even when surrounding cells clearly contain useful signal. That forced us to improve the model with neighbor smoothing and fallback logic so results would feel more realistic and less noisy.
We also faced architectural challenges. Large raw and processed datasets were too heavy for a simple frontend-only deployment flow, and they were not a good fit for GitHub or Vercel builds. That pushed us toward a two-machine architecture:
- one machine focused on frontend and UI delivery
- one machine focused on local safety data and backend processing
That separation helped us keep the heavy data pipeline local while still exposing clean APIs to the frontend.
Another challenge was product design. Safety is a sensitive topic, so the app cannot just throw numbers at users without context. We had to think carefully about explanation quality, confidence signals, fallback messaging, and how to present safety information responsibly without pretending to offer certainty.
Accomplishments that we're proud of
We are proud that Safara is not just a concept mockup. It is a working system that connects:
- real geocoding
- real route generation
- real spatial risk scoring
- real route comparison
- real future-risk forecasting
- live navigation behaviors
We are especially proud of the safety model design. Instead of jumping straight to a black-box ML system, we built a deterministic, interpretable scoring framework that we can explain clearly and improve incrementally. That made the product easier to trust, debug, and present.
We are also proud of the user experience. The app combines a cinematic Earth-style interface with practical route and safety information, which helps it feel both compelling and useful.
Finally, we are proud that Safara frames navigation differently. It asks a question many people already care about but that mainstream tools rarely prioritize: not just “How fast can I get there?” but “What is the safer way to get there?”
What we learned
We learned that building a safety-focused product is as much a data and systems problem as it is a UI problem. Good visual design matters, but the real work is in making noisy real-world datasets usable.
We also learned how important spatial modeling choices are. Small technical decisions, like H3 resolution, neighbor smoothing radius, recency weighting, and fallback blending, can have a huge impact on whether the output feels stable and believable.
Another major lesson was that explainability matters. Users need more than a score; they need to understand why the score exists, how confident the system is, and what tradeoffs it is making.
On the engineering side, we learned a lot about:
- spatial data pipelines
- route geometry processing
- H3 indexing
- frontend/backend separation
- API integration with Google Maps and Twilio
- building resilient scoring systems with partial coverage
We also learned that choosing deterministic logic first can be a strength. It gave us a strong baseline before introducing more advanced predictive modeling.
What's next for Safara
Our next steps for Safara are focused on expanding both intelligence and reliability.
On the product side, we want to add:
- stronger turn-by-turn navigation logic
- better current-step detection during active navigation
- richer off-route handling and rerouting
- more safety-aware pit stop suggestions
- stronger live safety alerts during navigation
On the data side, we want to:
- expand coverage with more local datasets
- improve recency modeling
- add more years of DC and regional data
- improve future-risk forecasting quality
- continue refining fallback confidence behavior
On the infrastructure side, we want to strengthen the dedicated backend architecture so the frontend can stay lightweight while the heavier data and scoring pipeline scales separately.
Long term, we see Safara becoming a broader safety intelligence layer for travel: not only helping people choose where and how to go, but helping them travel with more confidence, awareness, and peace of mind.
Built With
- google-geocoding
- google-maps
- google-routes
- h3
- javascript
- next.js
- ngrok
- node.js
- react
- tailwind-css
- twilio
- typescript
- vercel


Log in or sign up for Devpost to join the conversation.