-
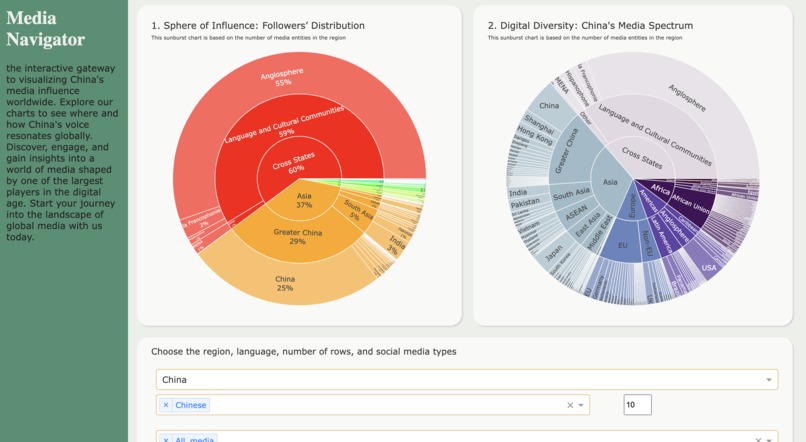
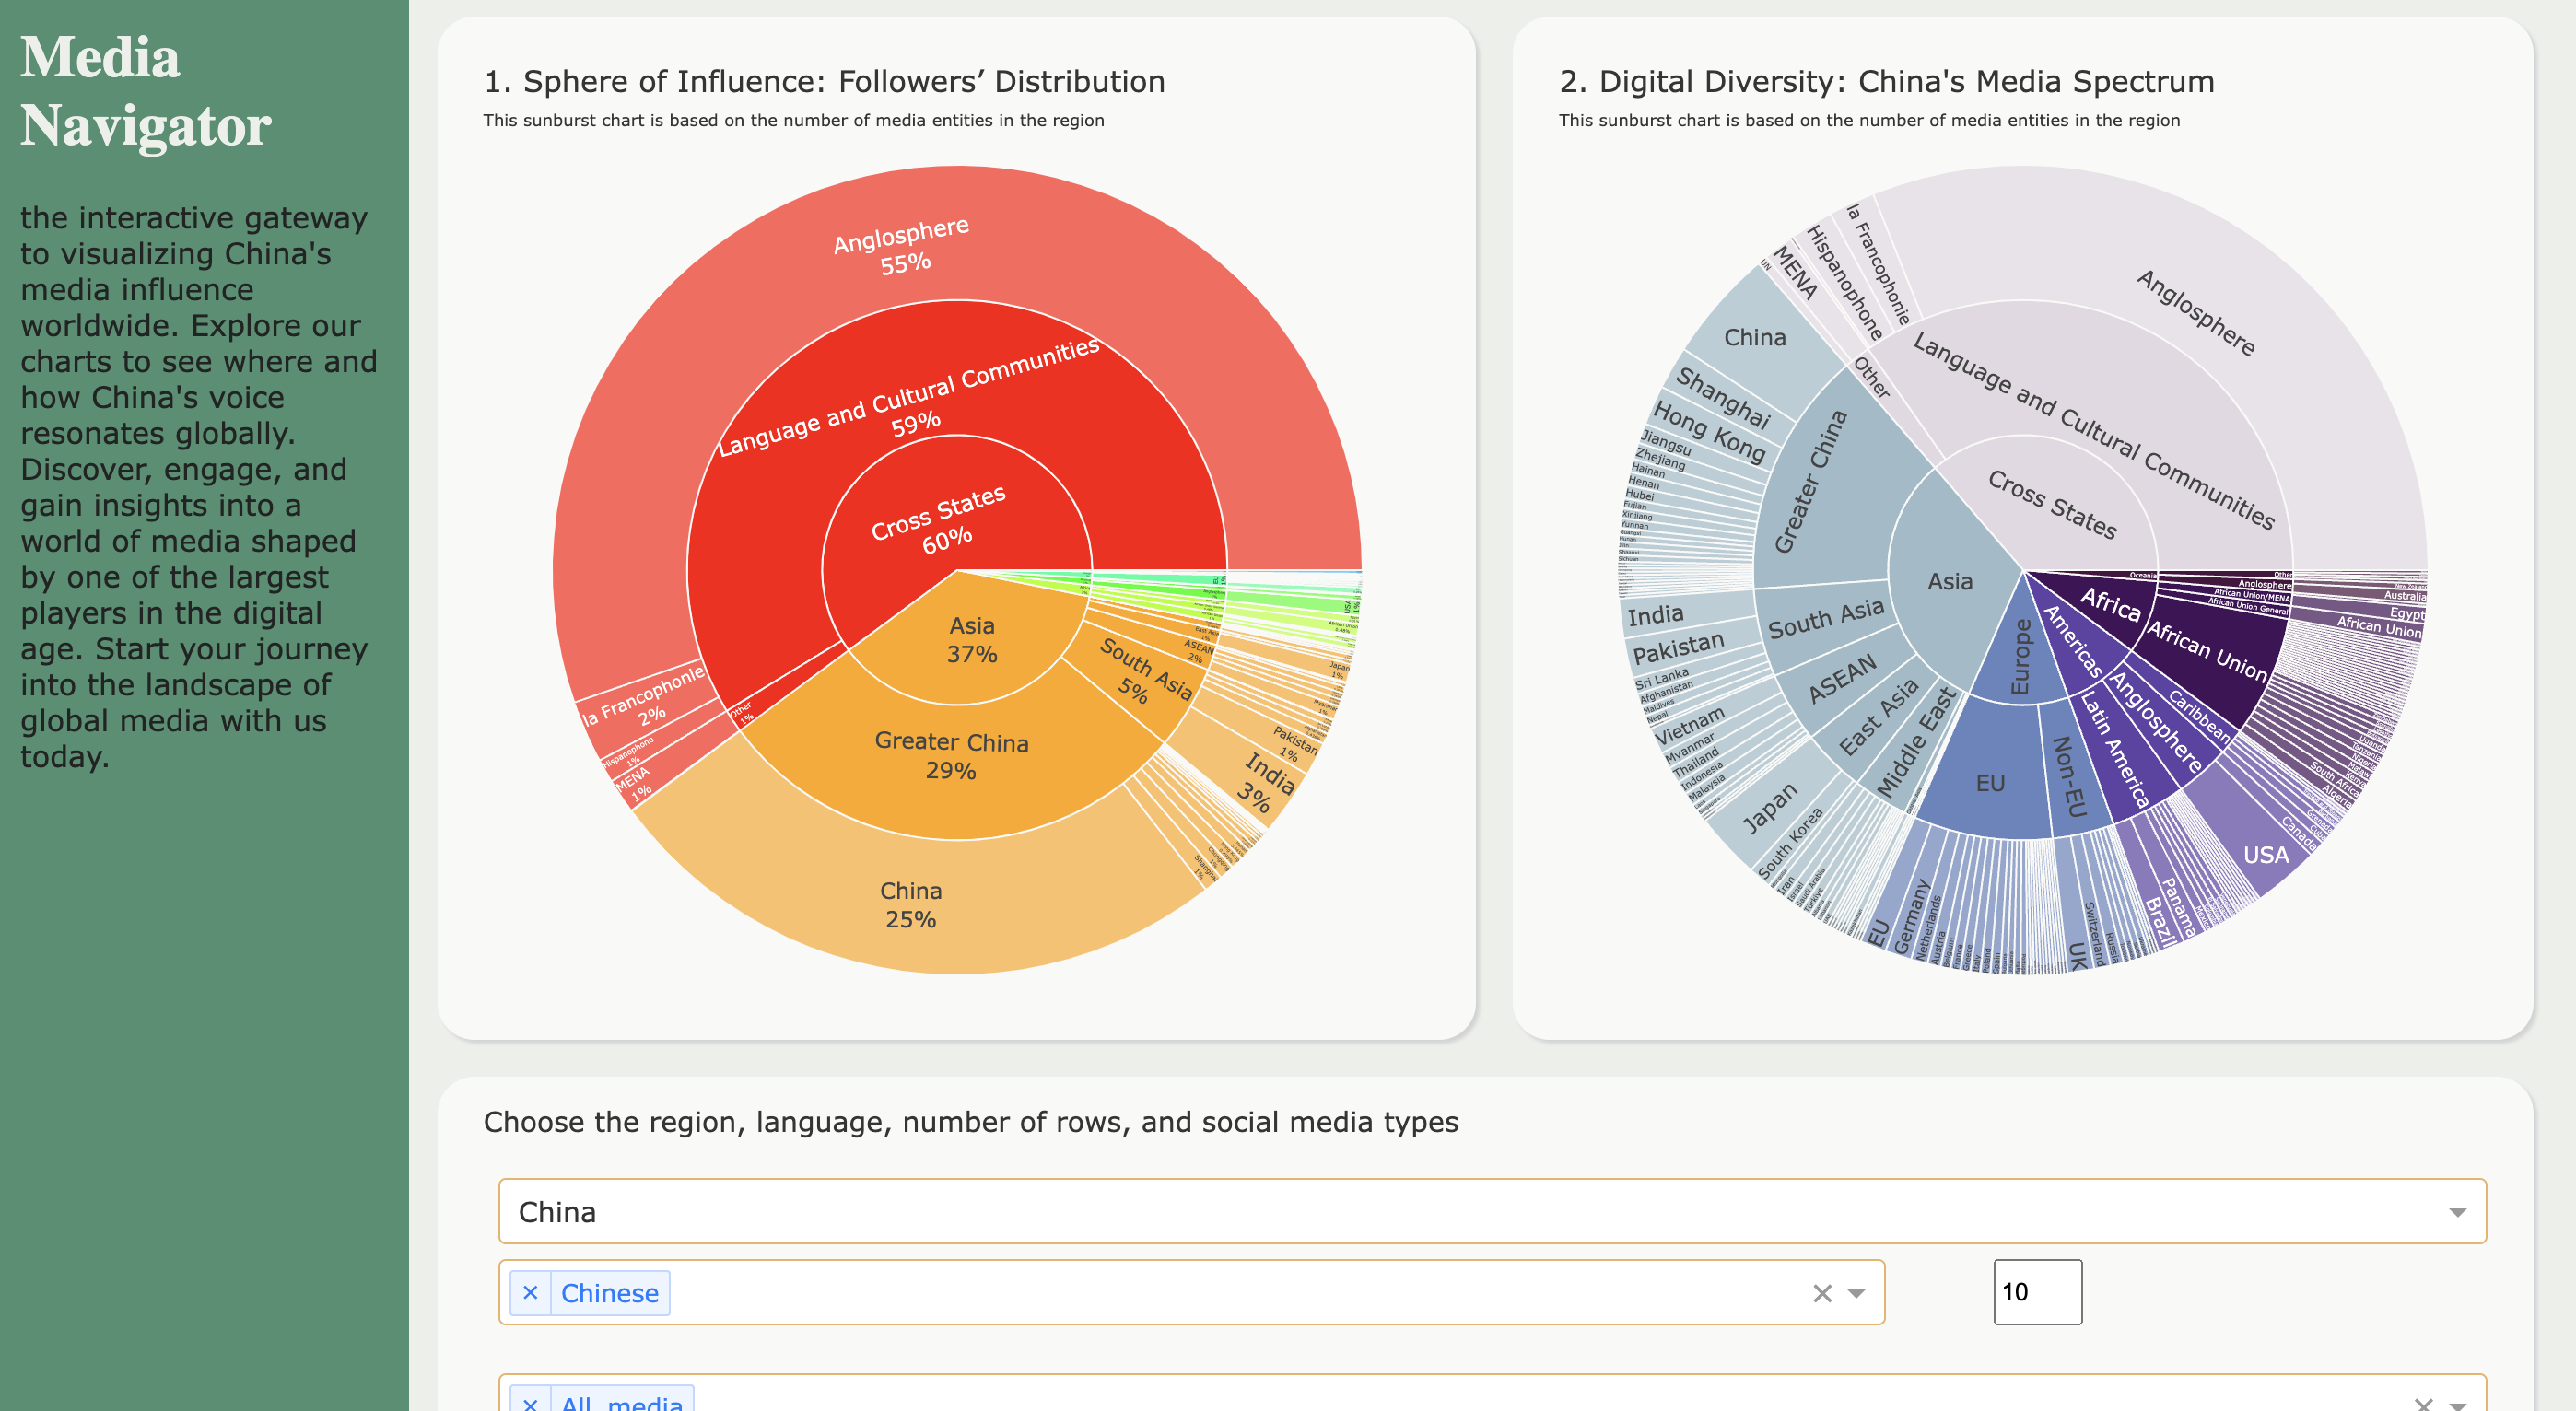
Explore China's media landscape: a colorful mosaic of regional influences
-
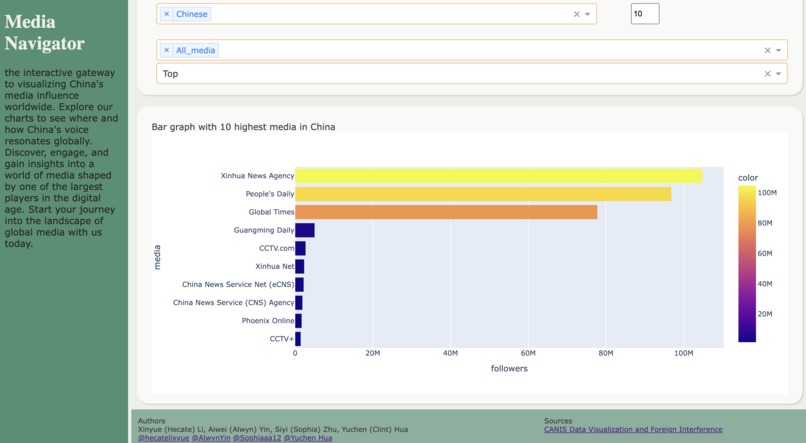
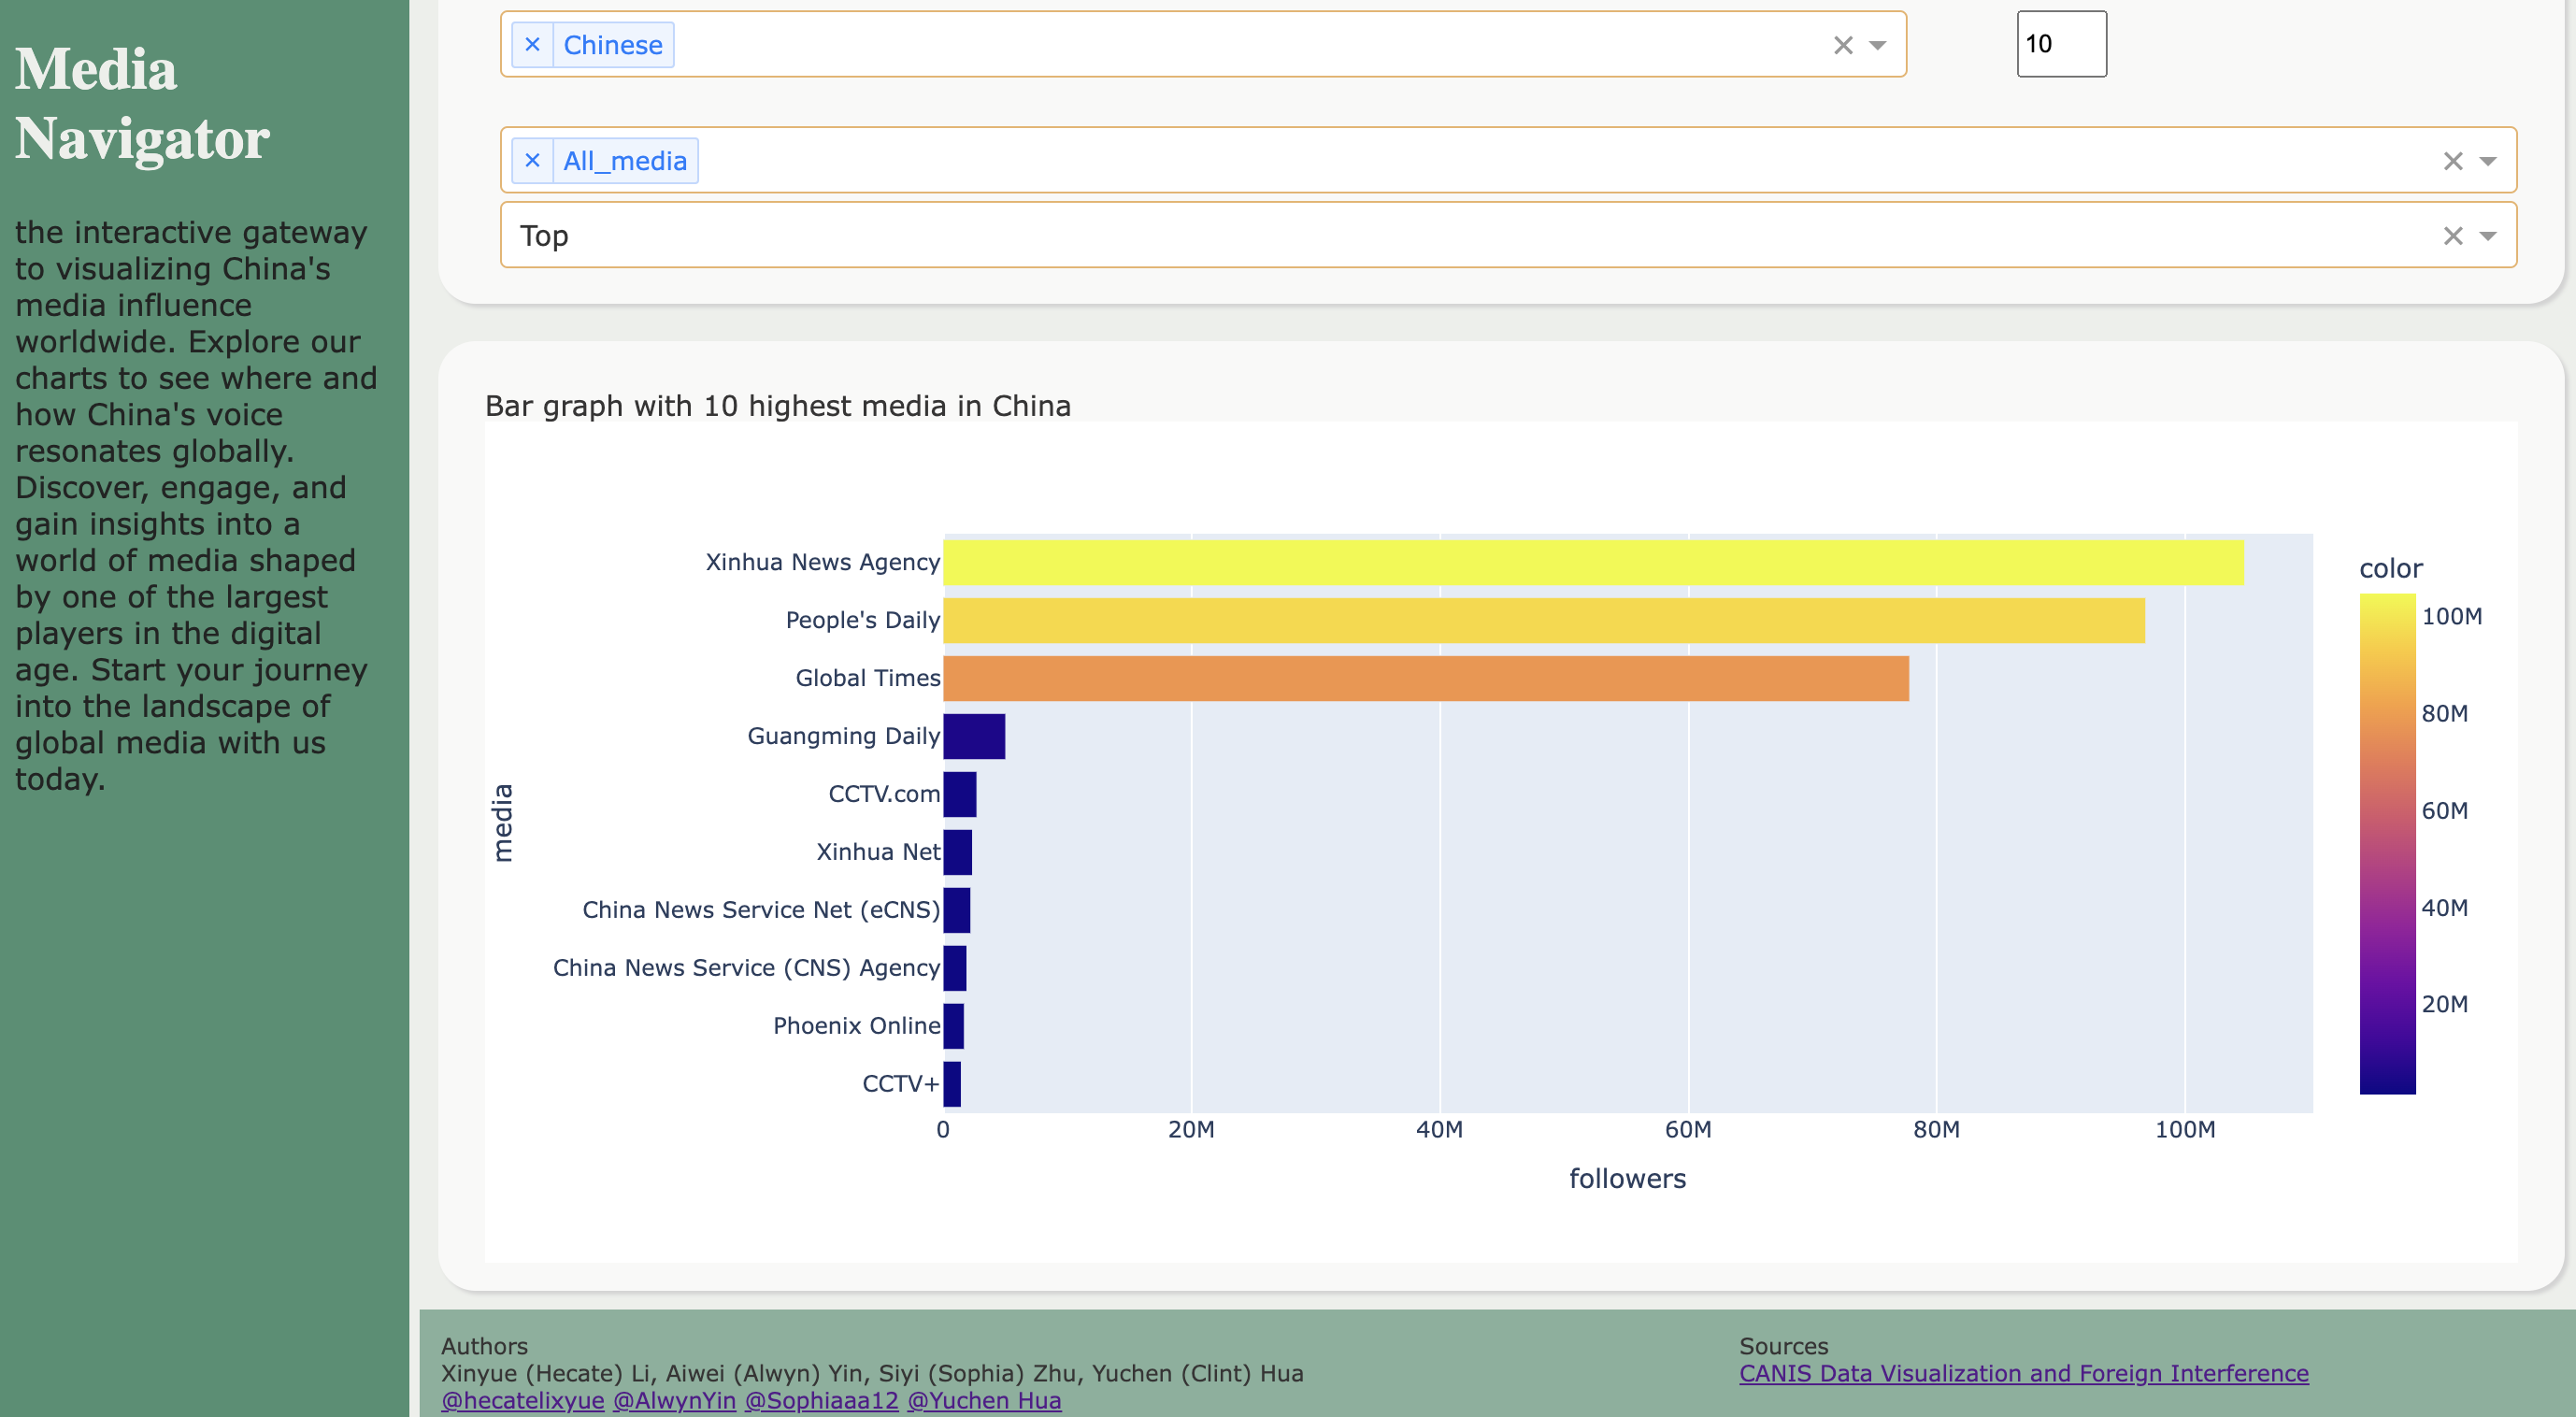
Dive into the top media entities shaping China's narrative with a glance
Inspiration
In a world where the digital media landscape is as influential as it is vast, our team was driven by the need to understand the breadth and depth of China's media presence on a global scale. Fascinated by the power of data visualization to unravel complex narratives, we set out to create a tool that not only informs but also empowers users to explore and discern the patterns of influence that shape our world's digital conversations.
What We Learned
Throughout the journey of this project, we embraced a multitude of learnings, each adding a layer of sophistication to our final product:
- Data Discovery: We learned to navigate the sea of data, identifying the most impactful metrics.
- Visualization Techniques: We honed our skills in transforming raw numbers into compelling visual stories that speak louder than spreadsheets.
- Interactive Design: We discovered the power of interactivity in engaging users, allowing them to uncover the specific insights they seek.
- Responsive Web Development: We grasped the intricacies of building a web platform that is both informative and accessible across various devices.
How We Built Our Project
Our project unfolded in a series of strategic phases:
- Data Ingestion: Starting with a robust dataset, we meticulously loaded and examined the figures that would form the foundation of our analysis.
- Metric Identification: We pointed key metrics that signified influence and engagement on social media platforms.
- Region Classification: We classified 'Region of Focus' meticulously to ensure clarity and precision in our visualizations.
- Aggregation and Insight Mining: We aggregated the data to reveal the most influential platforms and then delved deeper to mine insights region by region.
- Visualization Development: We developed a series of interactive charts, including sunburst charts and bar graphs, to visually narrate the story behind the numbers.
- Website Creation: We built an interactive website that serves as a portal for users to engage with the data, offering a user-friendly interface to navigate the complex media landscape.
Challenges We Faced
- Data Diversity: The variety in the follower and subscriber counts presented a challenge in creating a unified scale for comparison.
- Completeness of Data: Dealing with missing data points tested our ability to infer and extrapolate without compromising accuracy.
- Classification Overlaps: The overlapping regions required careful reclassification to ensure that each area was distinctly represented.
- User Experience Design: Crafting an intuitive user journey on the website demanded a balance between functionality and aesthetics


Log in or sign up for Devpost to join the conversation.