-
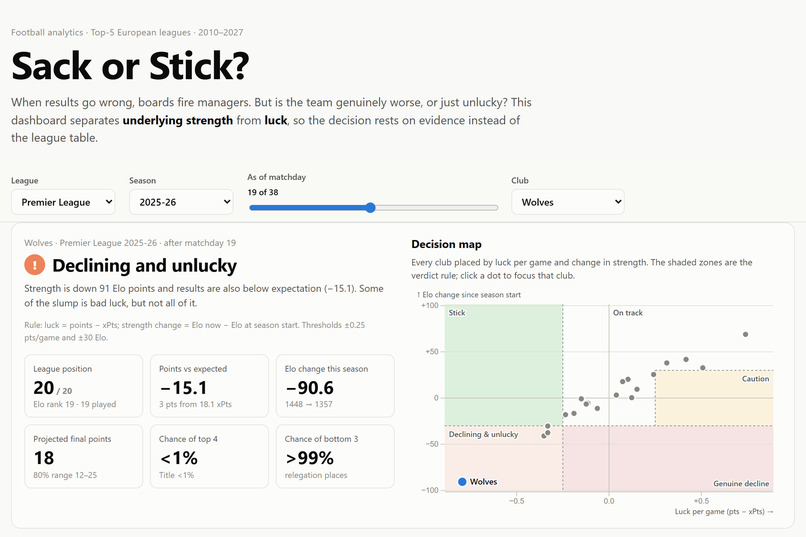
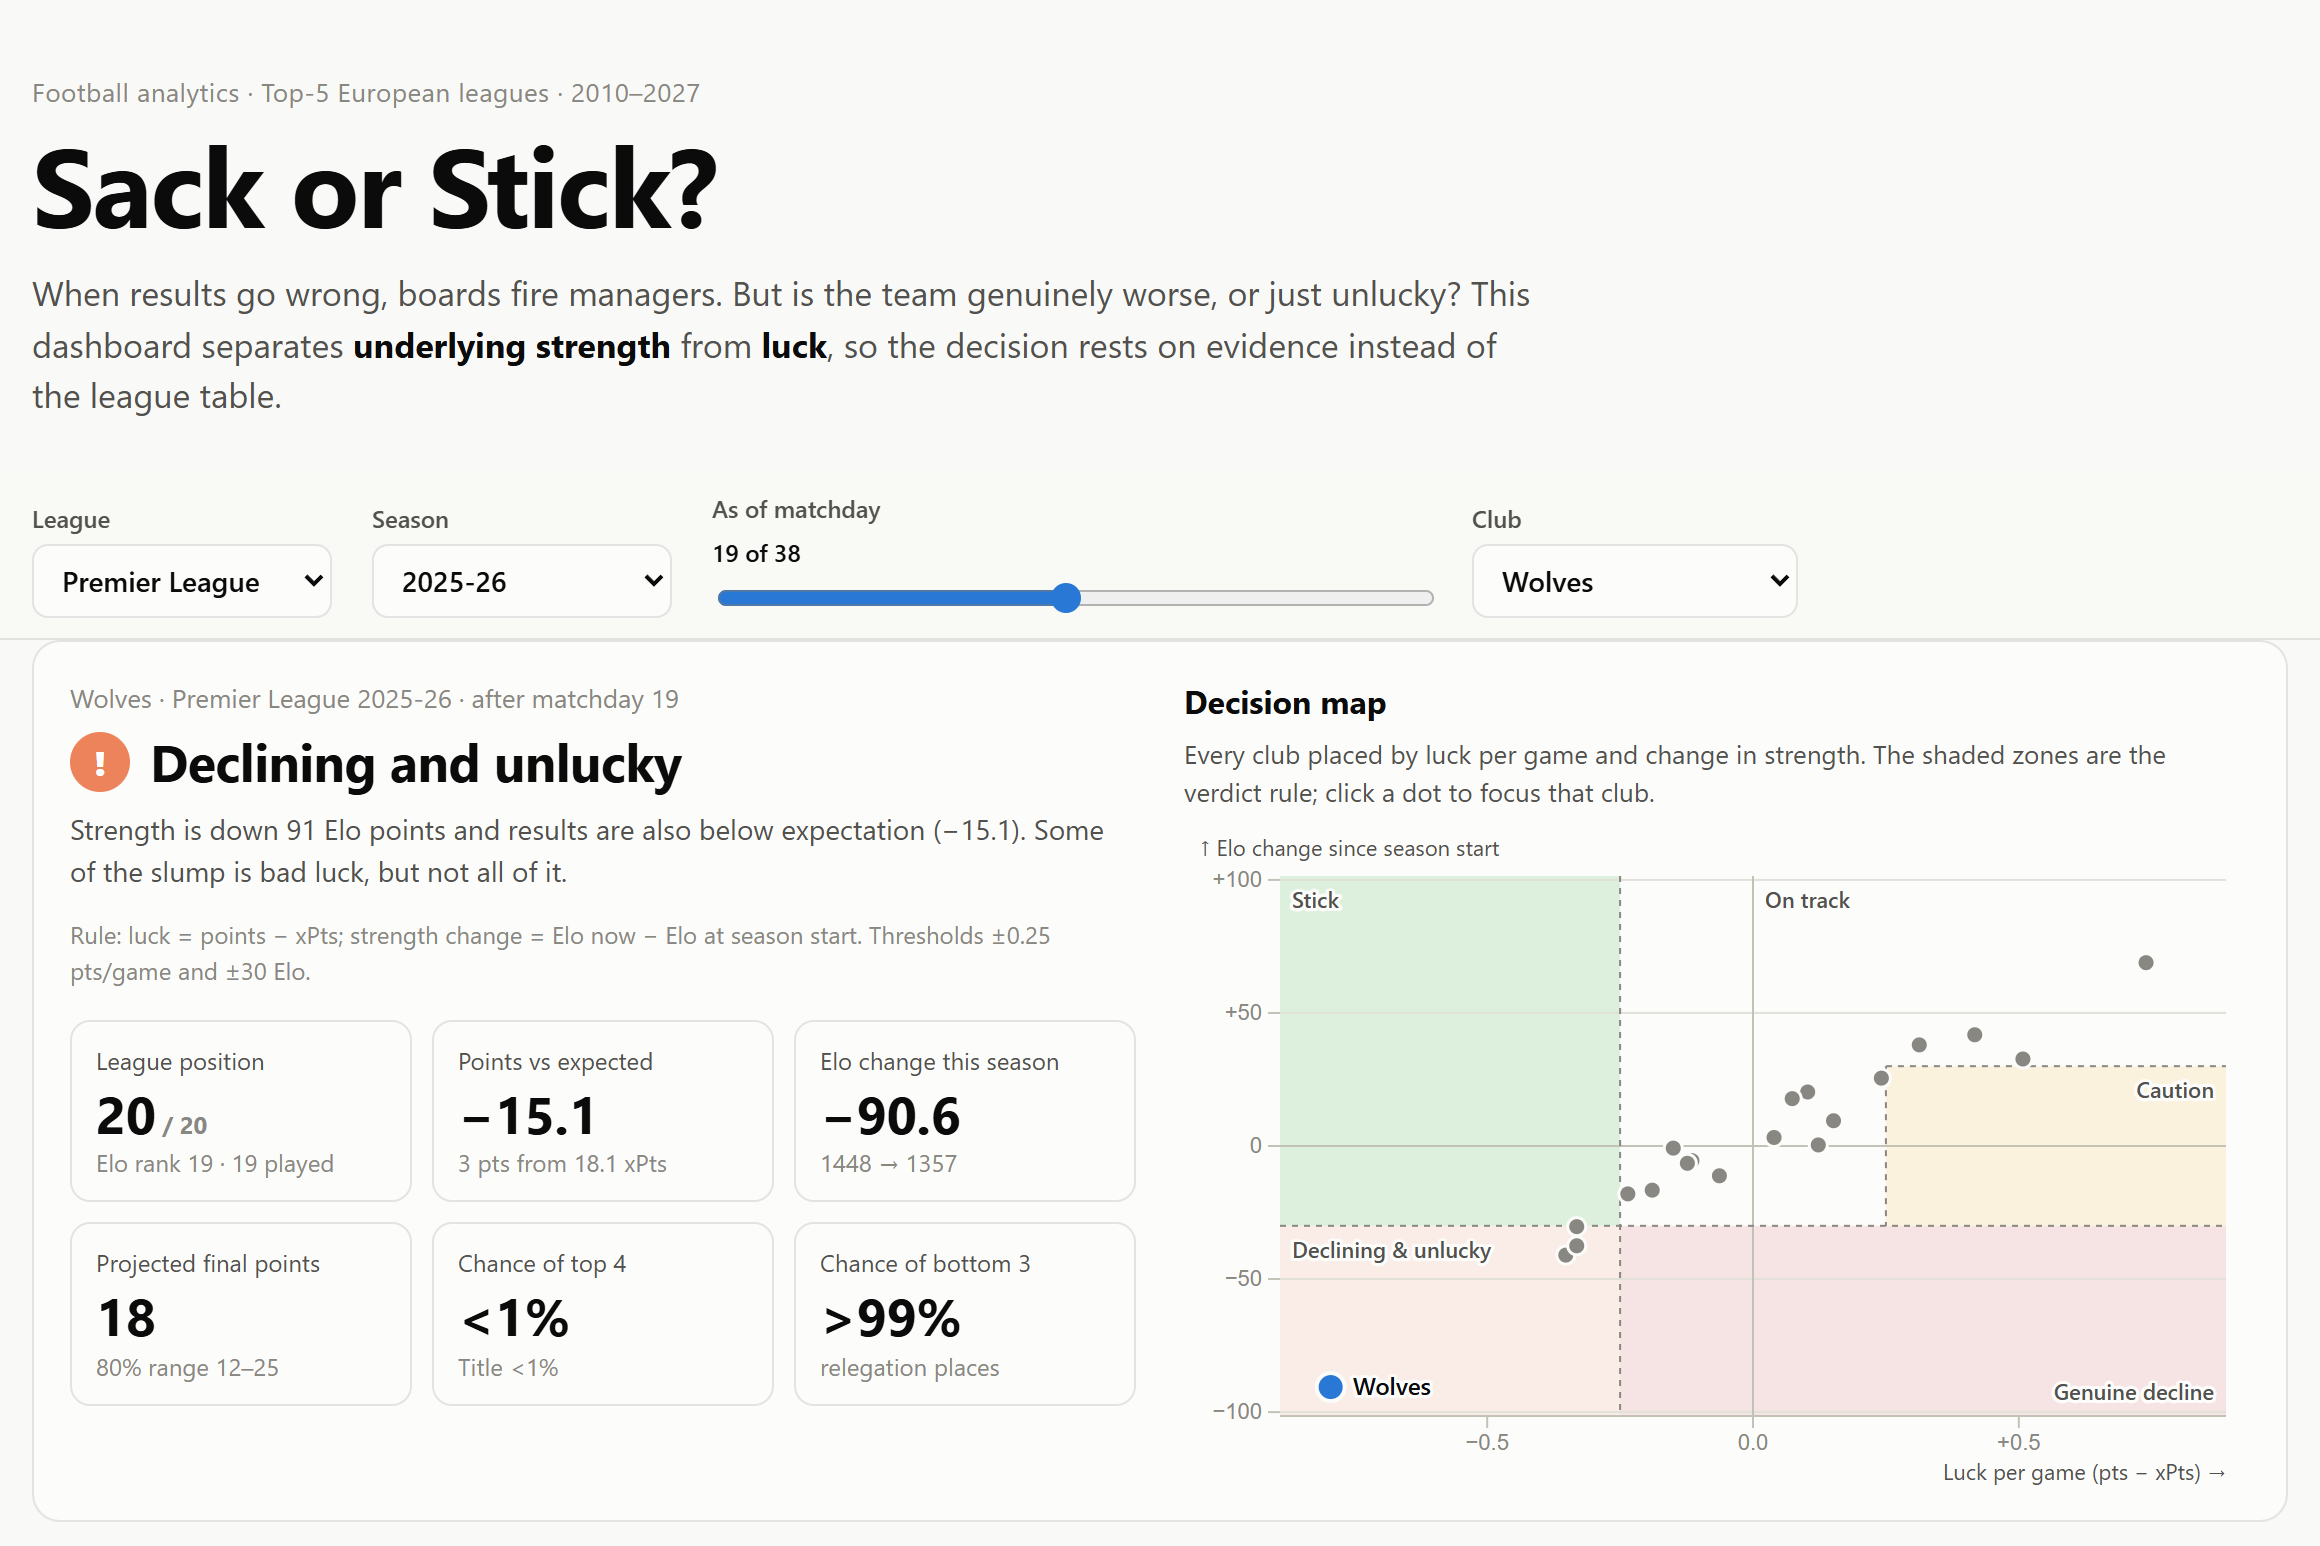
Wolves after 19 games of 2025-26: "Declining and unlucky". The decision map places every club in the verdict rule's zones.
-
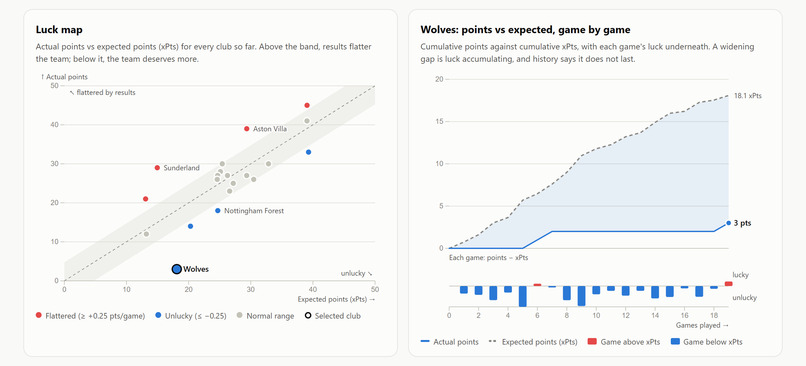
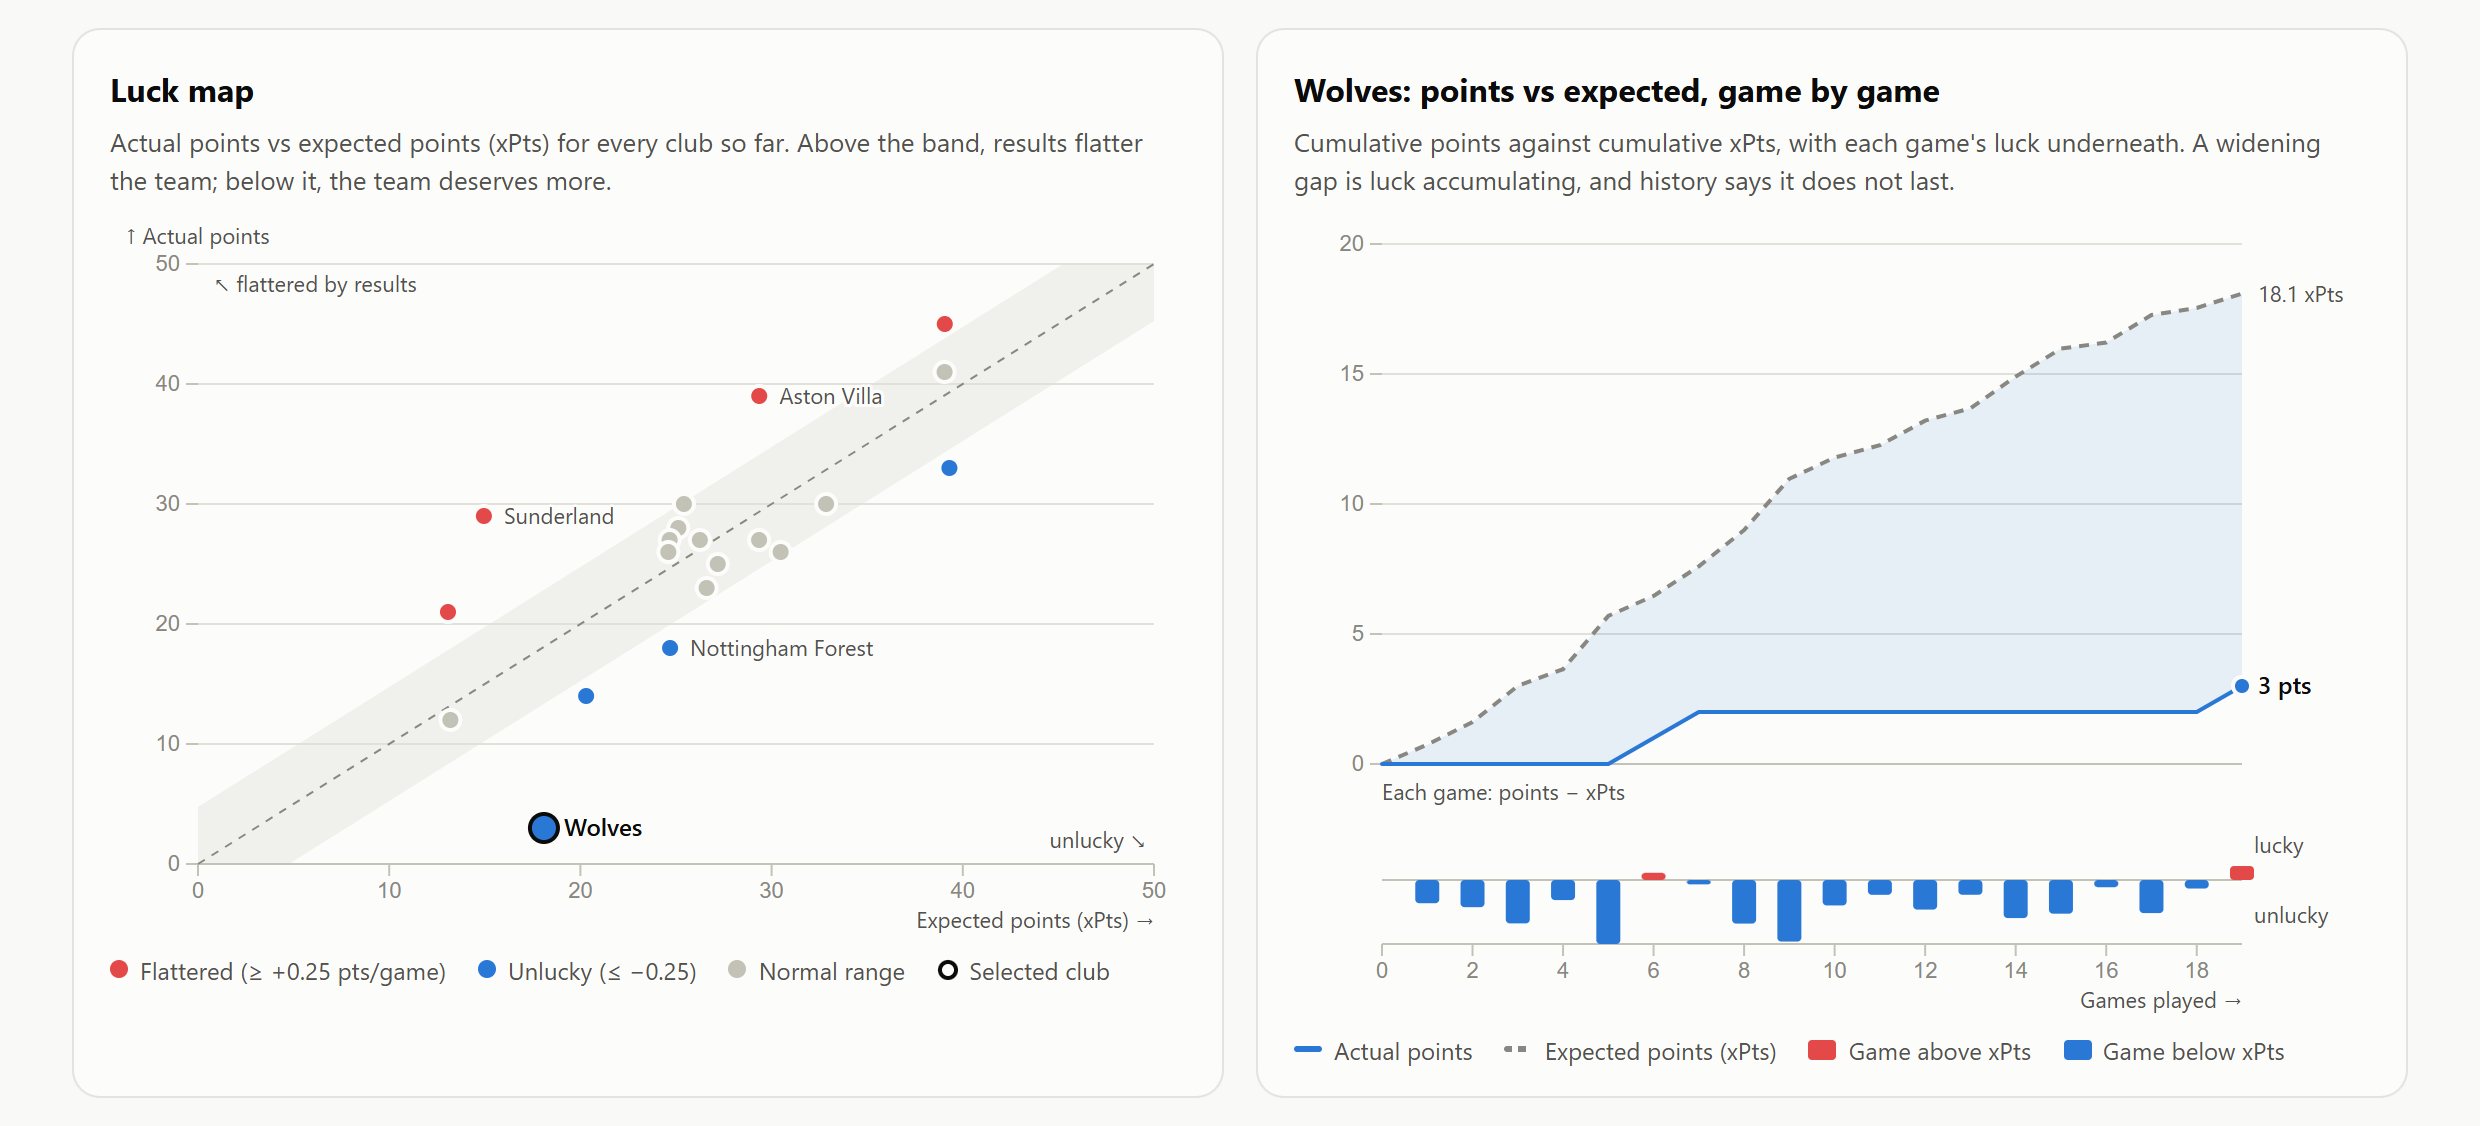
Luck map of actual vs expected points for every club, and Wolves' season game by game: 3 points from 18.1 expected.
-
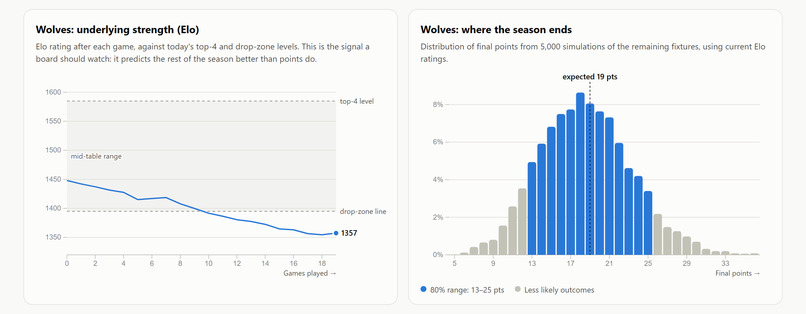
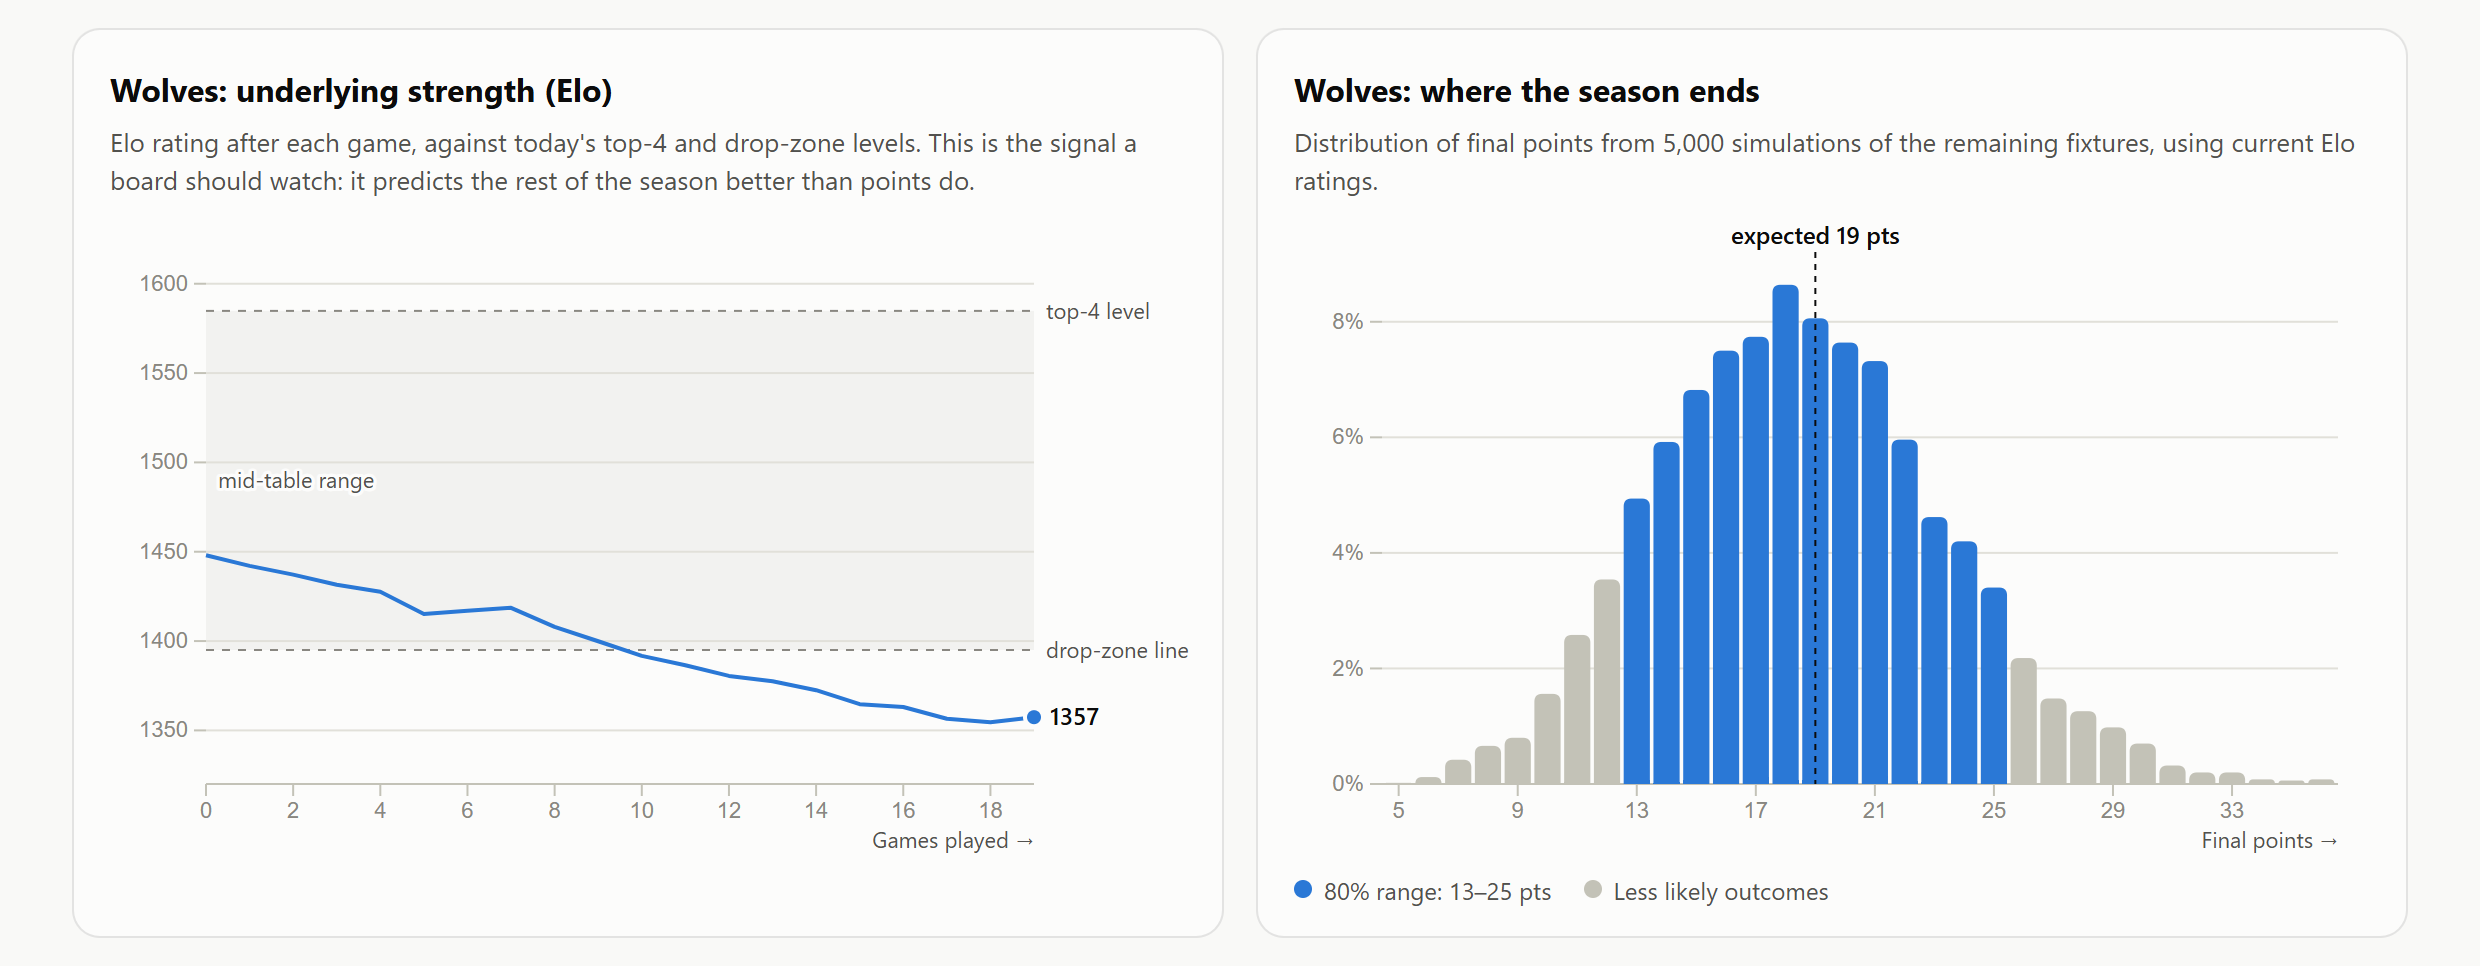
Wolves' Elo fell below the drop-zone line, and 5,000 simulations project 18 points (80% range 12-25). They finished on 20.
-
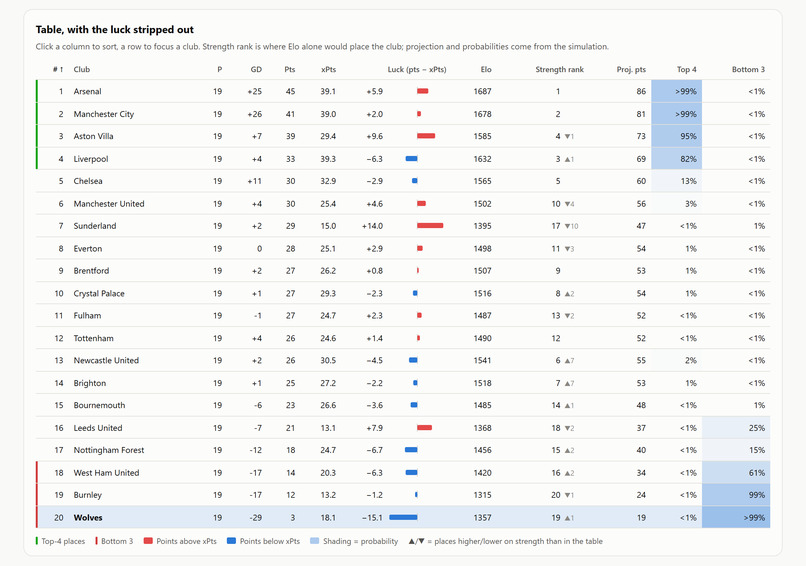
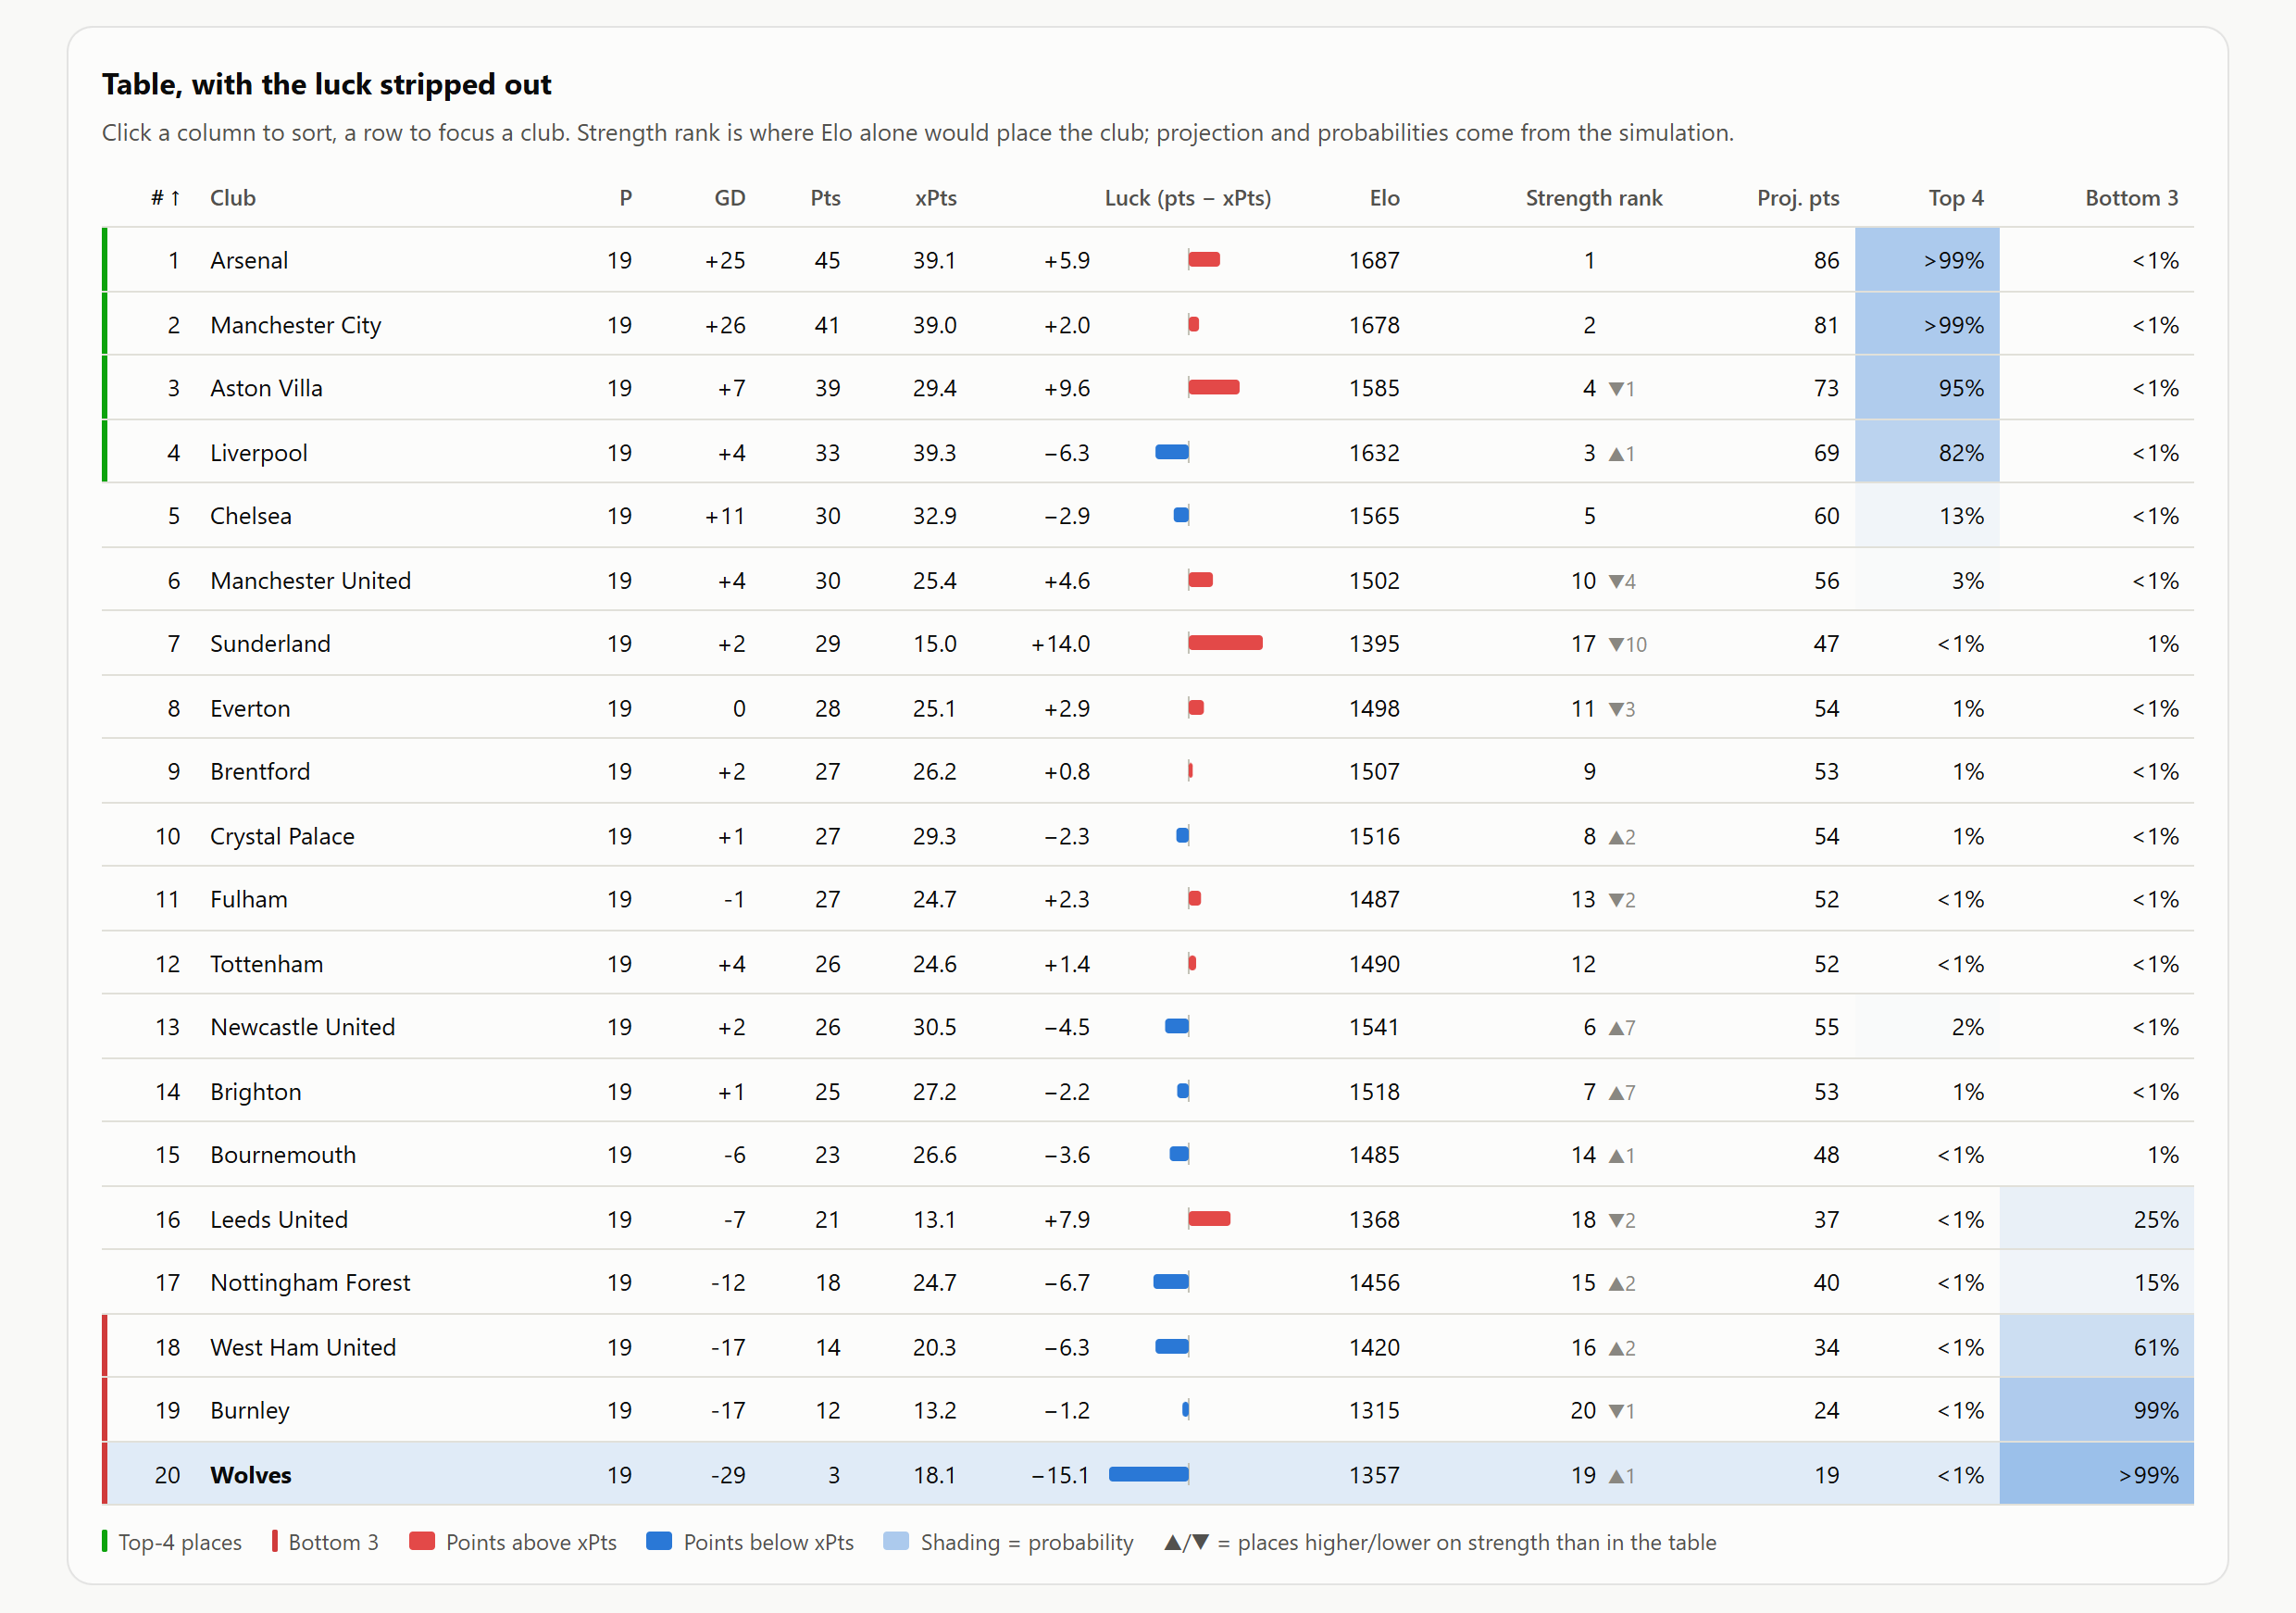
The league table with luck stripped out: points vs xPts, Elo, strength rank, projected points, top-4 and relegation odds.
-
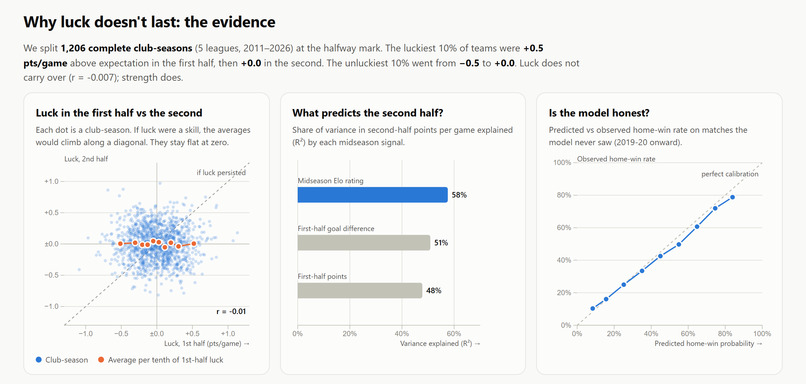
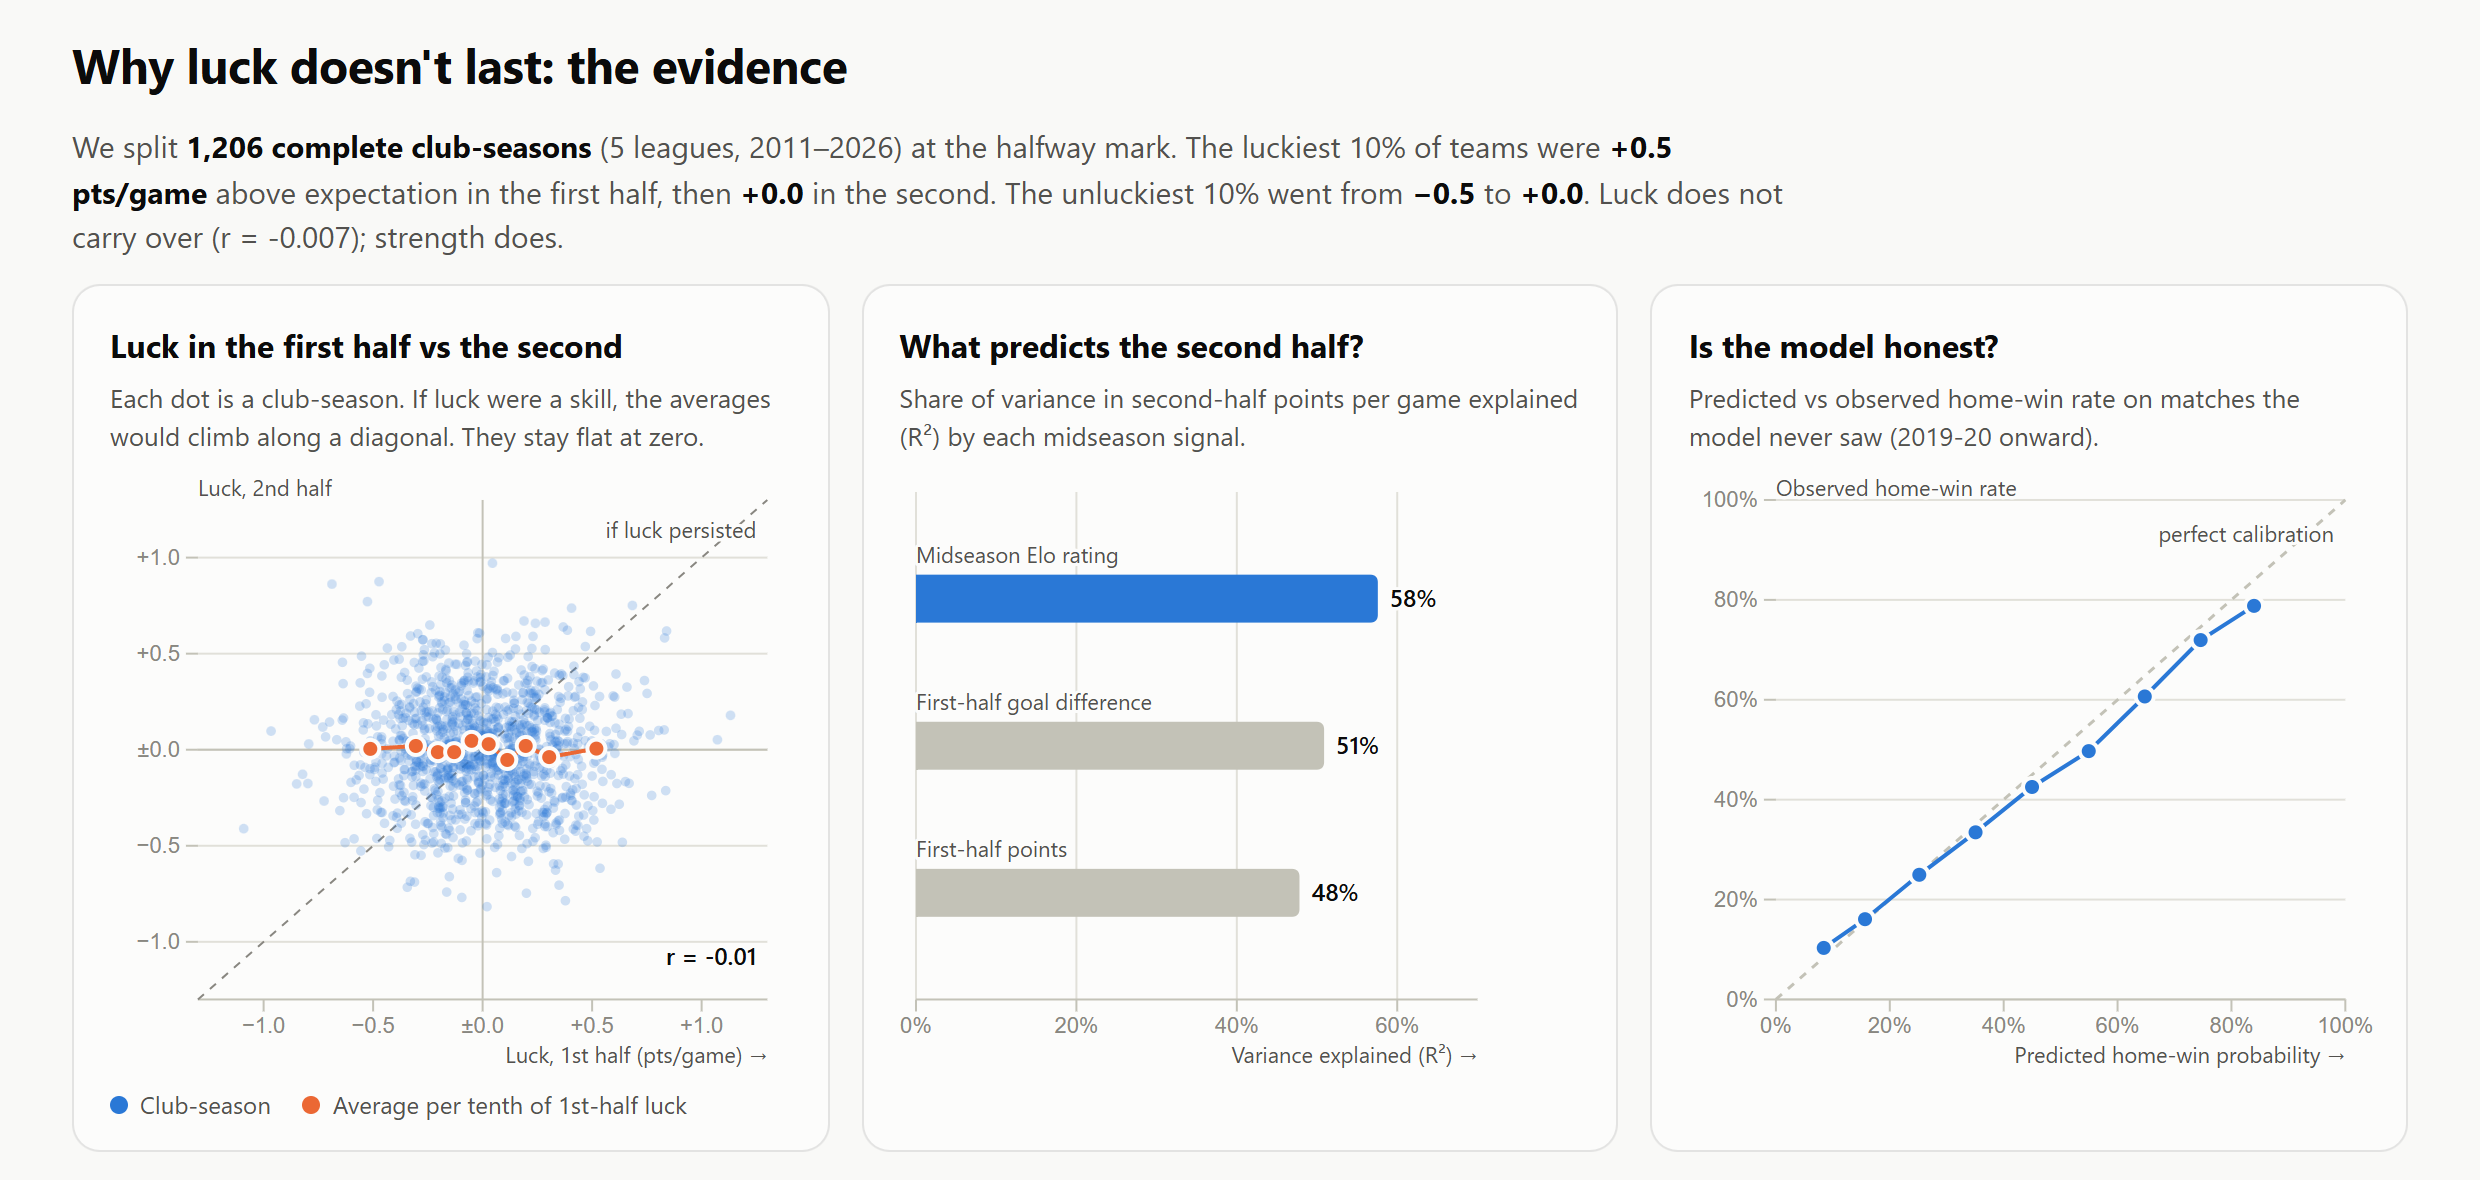
Across 1,206 club-seasons, first-half luck predicts nothing about the second half (r = -0.01). Midseason Elo predicts best.
Inspiration
Every season, clubs sack managers after a bad run, often at huge cost. But a league table mixes two things: how good a team is and how lucky it has been. I wanted to give a sporting director one question answered with evidence instead of emotion: is my team genuinely worse, or just unlucky?
What it does
Sack or Stick? is an interactive dashboard covering every match in Europe's top-5 leagues from 2010-11 to the live 2026-27 season (~25,700 matches). For any club, season and matchday it shows:
A verdict: a transparent rule combines luck (points minus expected points) and strength change (Elo now vs season start) into a call such as "Stick: the results will come", "Caution: results are flattering" or "Genuine decline, review warranted". A time machine: every view is recomputed using only information available at the chosen matchday, so any past season can be replayed to check whether the verdict was right. A decision map: every club plotted by luck per game against change in strength, with the verdict rule drawn as shaded zones, so a board member can see at a glance why a club gets its verdict and how it compares with the rest of the league. A luck map of actual vs expected points for every club (colored flattered / unlucky / normal range), game-by-game trajectories with each match's luck underneath, the Elo strength curve against the top-4 and drop-zone levels, and 5,000 Monte Carlo simulations of the remaining fixtures (projected points, top-4 and relegation odds). A luck-adjusted table with a strength rank showing where Elo alone would place each club. An evidence section proving why luck should be ignored: average second-half luck stays flat at zero across every tenth of first-half luck. Key findings Across 1,206 complete club-seasons, split at the halfway mark:
The luckiest 10% of teams were +0.52 pts/game above expectation in the first half and +0.00 in the second half. The unluckiest 10% went from −0.51 to +0.00. First-half luck has zero correlation with second-half luck (r = −0.007). Midseason Elo explains 58% of the variance in second-half points, vs 48% for the league table itself. Example: replaying the 2025-26 Premier League at matchday 19, Wolves had 3 points from 18.1 expected. The dashboard projected 18 final points (80% range 12–25) and a >99% relegation chance; they finished on 20.
Actionable impact: judge a manager on underlying strength, not points. A losing team whose strength holds steady should usually be backed; one whose strength is falling deserves a review.
How we built it
Python (numpy, scipy) pipeline: chronological Elo per league with margin-of-victory and home advantage, summer regression to the mean, and promoted clubs entering at the level of the clubs they replace. Parameters tuned on 2011–2019 only. An ordered-logit model turns the Elo gap into win/draw/loss probabilities → expected points. Tested out-of-sample on 12,688 matches (2019-20 onward): log loss 0.991 vs 1.076 baseline, Brier 0.591 vs 0.651, with a calibration chart in the dashboard. Static web dashboard (HTML, CSS, JavaScript, D3.js) with the Monte Carlo simulation running in the browser. Colorblind-validated palette, light and dark mode, mobile layout, hover tooltips on every chart. Hosted free on GitHub Pages; no server needed. Data: openfootball/football.json (public domain).
Challenges we ran into
The source changed its club naming style in 2020-21 (e.g. "Inter" became "FC Internazionale Milano"), which silently broke rating continuity. I built a name-normalisation layer and verified each season boundary shows only the expected promoted clubs. Avoiding look-ahead bias: projections and verdicts at matchday N use only ratings as of matchday N, and the model was fitted strictly on older seasons than it was tested on.
Accomplishments that we're proud of
A finding that is both statistically clean (r ≈ 0 across 1,206 seasons) and directly useful to a decision-maker, presented in a tool a non-technical board member can use in a minute.
What we learned
How much of football's league table is noise, how to validate a model honestly out-of-sample, and how to communicate uncertainty (ranges and probabilities instead of single numbers).
What's next for Sack or Stick?
Adding shot-based expected goals (xG) where available, modelling injuries and fixture congestion, and backtesting the verdict against real managerial sackings.

Log in or sign up for Devpost to join the conversation.