-
-
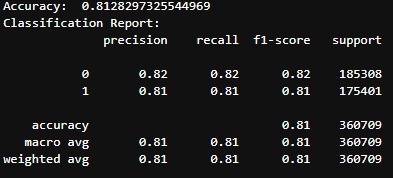
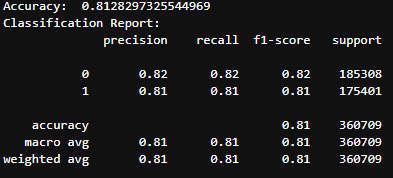
Accuracy report of the Logistic Regression model running on LinuxOne Server
-
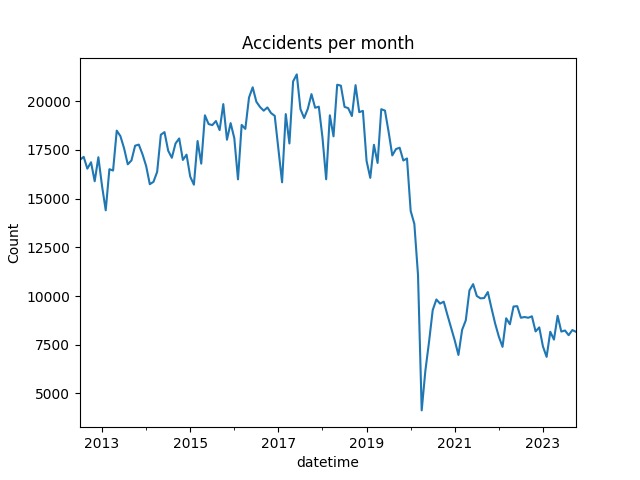
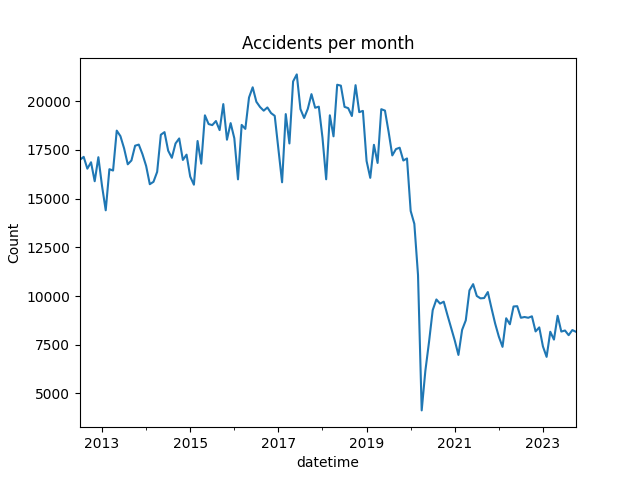
Plot of accidents per month over the entire dataset time period
-

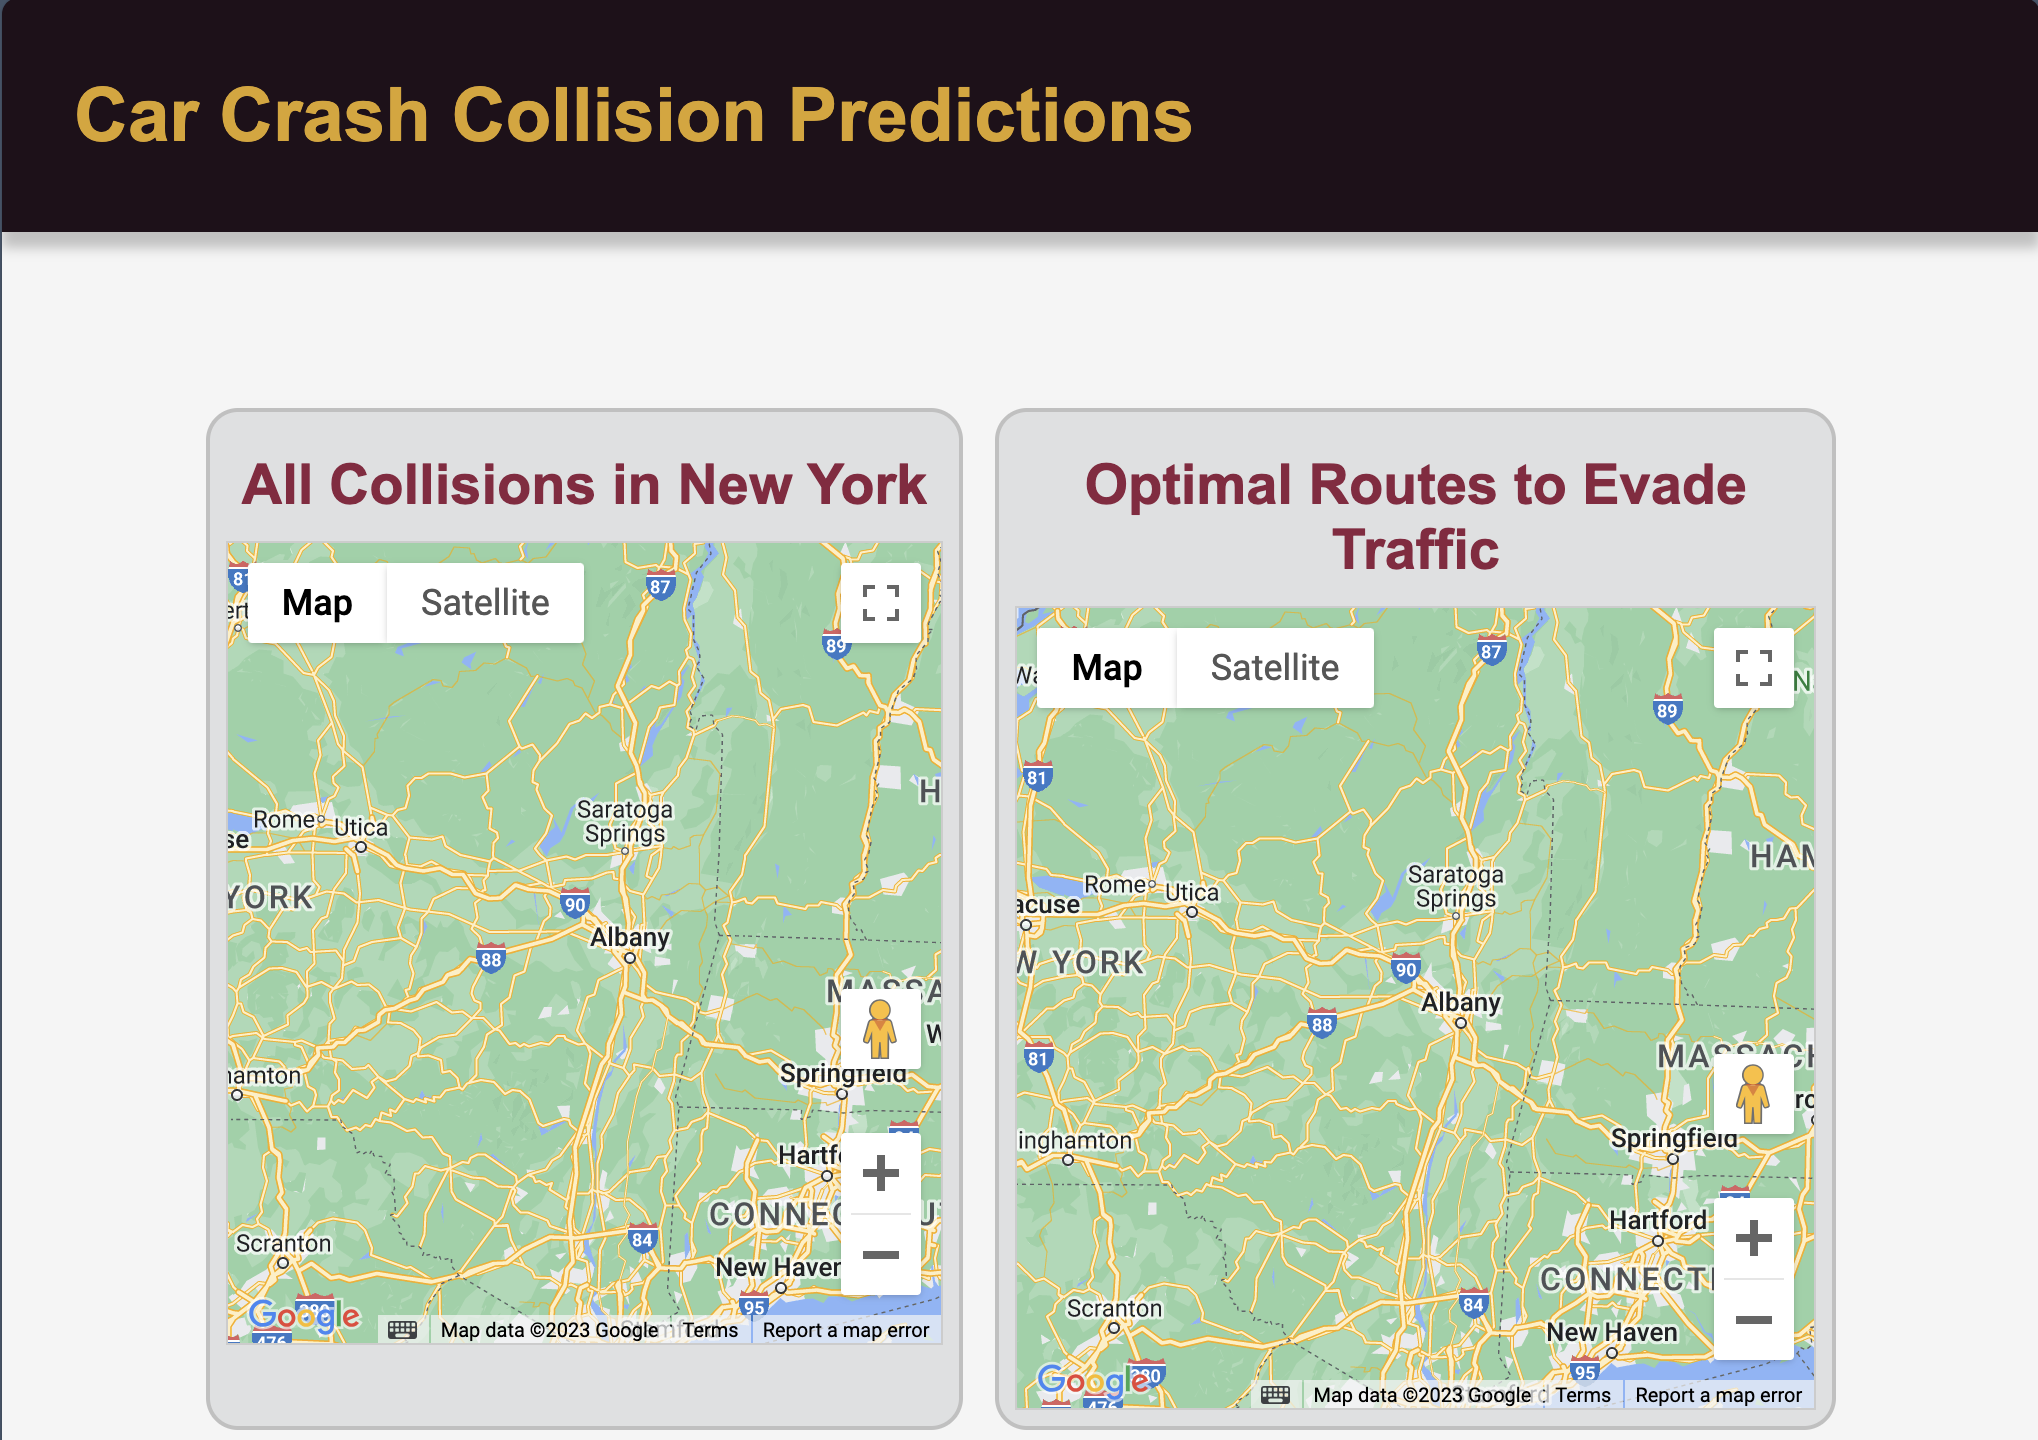
Image of the Flask app running in browser
Inspiration
Public Safety Concern:
Traffic accidents result in a substantial number of injuries and fatalities, posing a significant concern for public safety. Addressing this issue through predictive models aims to minimize accidents and their associated risks.
First Response Efficiency:
Emergency response teams, law enforcement, and healthcare services could benefit from predictive models that help allocate resources more efficiently and respond promptly to potential accident-prone areas.
Urban Planning and Infrastructure Improvement:
Identifying high-risk zones or circumstances for collisions can aid city planners and authorities in making data-driven decisions for road improvements, traffic flow optimization, and safety measures, ultimately contributing to better urban infrastructure.
Optimized Traffic Management:
Predictive models can assist in managing traffic by anticipating potential congestion points or accident-prone areas, allowing for better traffic flow management and potentially reducing commute times and overall traffic-related stress.
Overall, the inspiration behind this project lies in its potential to leverage data-driven insights and machine learning techniques on IBM's powerful LinuxOne servers to proactively address public safety concerns and contribute to creating safer and more efficient urban environments.
What it does
Given input features such as date, time, latitude, longitude, etc, the model predicts the probability of a collision occurring in a given scenario or location within New York. It utilizes the logistic regression algorithm to analyze the selected features and predict the probability of a collision. Currently, the model is 81% accurate based on the training data.
Furthermore, the data from the model is visualized on a map of New York in a web app informing users of potential risk areas and collision zones.
How we built it
There are two parts involved in creating this project:
- Building the ML Model on the IBM LinuxOne instance
- Creating a front-end, web-facing endpoint for users to interact with
Building the Machine Learning Model:
Data Acquisition:
The data used in this project was acquired from the New York City gov which made all data they have public. From this, we chose the Traffic collisions dataset in a .csv format.
Data Processing:
As the raw data we have had many null entries and outliers, it needed to be cleaned up. We adjusted the column names for easier identification, filled in null values, adjusted geospatial data to fit within the bounds of New York City, and outputted the cleaned-up data frame to a new .csv file to be used by our algorithm.
Model Selection:
Given the time constraints and technical understanding of ML models, we chose to go with a logistic regression.
Pros:
- Logistic regression provides easily interpretable results. It allows understanding of the impact of each feature on the likelihood of a collision occurrence
- It's relatively fast to train and well-suited for large datasets. With proper feature engineering, it can handle a considerable amount of data efficiently
- It provides a probability score for each prediction. This is advantageous in scenarios where knowing the confidence level of predictions is crucial, such as in traffic accident prediction
- It's less susceptible to overfitting due to its linear nature, especially when dealing with data that may contain noise or minor irrelevant features
Cons:
- Logistic regression assumes a linear relationship between the independent variables and the dependent variable. If the true relationship is significantly non-linear, the model might not capture complex patterns effectively
- It might not capture complex relationships present in the data as effectively as more advanced models like decision trees or neural networks
- The model's performance heavily relies on well-engineered features
- It may struggle to handle non-linear relationships without manual feature engineering
Building the Front-end Flask App:
We mainly wrote the backend Flask code and refactored lots of HTML, CSS, and JS in the front end. We also had to work on integrating Google Maps JavaScript API into the front end. Made in-app API handlers within Flask that use JSON to talk to the front end and vice versa. The markers on the map still do not show despite our best efforts. The static data in the Python code is legitimate from our model fed to the Google Map scripts.
Challenges we ran into
There were some issues setting up the Jupyter Notebooks environment provided to us but once resolved everything worked smoothly. Processing the data took a bit of effort since the .csv file was very large, requiring us to batch-process it in chunks of 1000 rows. Furthermore, adjusting the geospatial attributes required a bit of reading online documentation so that only clean data would remain.
As for building the ml model, we used the Sci-Kit learn python library and this was the first time we built a working ml model thus a lot of research and learning new topics went into this project. We ended up doing a logistic regression using StandardScaler which normalizes the data to a common scale for building a ML model.
Accomplishments that we're proud of
- We are very proud to have built a basic working model of our idea turning it into a functioning app.
- We are proud to have implemented new technologies for the first time successfully using the provided workshops, online documentation, and existing coding skills.
- Proud to have a front-end facing server and an internal server, simulating best practices used in the industry
What we learned
- Learnt about acquiring data and prepping it to feed to an ML model
- Learnt about the various ML models and the pros and cons to them
- Learnt how to leverage powerful Python libraries to easily deploy code and perform analysis
- Learnt how to use HTML, CSS, and Flask to create a web app integrated with Google Maps API to display routes
- Learned how to create secure architectures by communicating with internal servers via SSH only.
What's next for SacHacks 5 - New York Traffic Collision Detector
This project is very versatile in its applications and could impact society heavily in a positive manner. For example, we could use the data gained from the ML model and create more optimized routes avoiding collision zones giving riders a more seamless drive. This was already implemented in our Flask app but were unable to fully complete it due to time constraints. Moreover, first responders and the city government could use this app to allocate resources appropriately to collision-heavy zones.
Another thing we could have improved is the efficiency of our ML model itself. The input features used were time, place, longitude, and latitude. Many more features could be added such as weather conditions, road conditions, etc adjusting the weights placed on inputs.
The app can also be further scaled to other major cities, improving traffic predictions and collision detections immensely.
Built With
- css
- docker
- flask
- git
- github
- google-maps
- html
- javascript
- jupyternotebooks
- linux
- matplotlib
- numpy
- pandas
- pycharm
- python
- scikit-learn
- ssh
- vscode


Log in or sign up for Devpost to join the conversation.