Inspiration
Wanted to look at the data that the city of Sacramento has online.
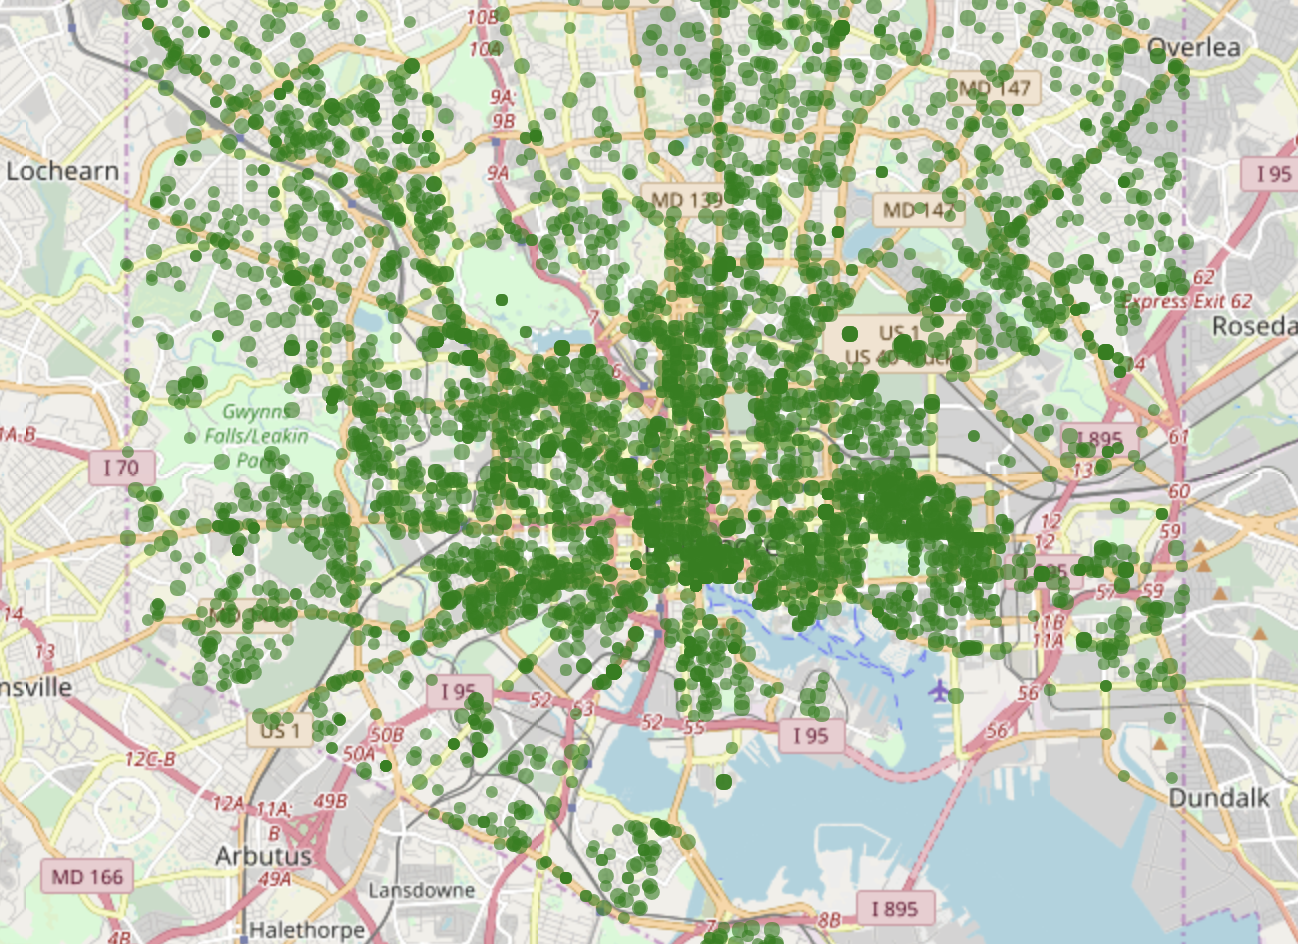
What it does
After looking at the data, it is lacking some important information compared to other cities. To make it easier to make maps for visualization, the user only needs to put in the link to the appropriate .csv and it will draw a map.
How I built it
Jupyter Notebook and Python
Challenges I ran into
Thinking about how different datasets might be labelled differently and how to validate entries.

Log in or sign up for Devpost to join the conversation.