Inspiration
We were inspired by the paradox of the modern software market: while innovation is at an all-time high, so is market saturation. We saw founders and investors struggling to distinguish real market gaps from fleeting trends, often relying on gut feeling alone. Our goal was to replace that uncertainty with data-driven clarity, creating a tool that could serve as a compass to navigate the crowded SaaS landscape and pinpoint veritable, underserved opportunities.
What it does
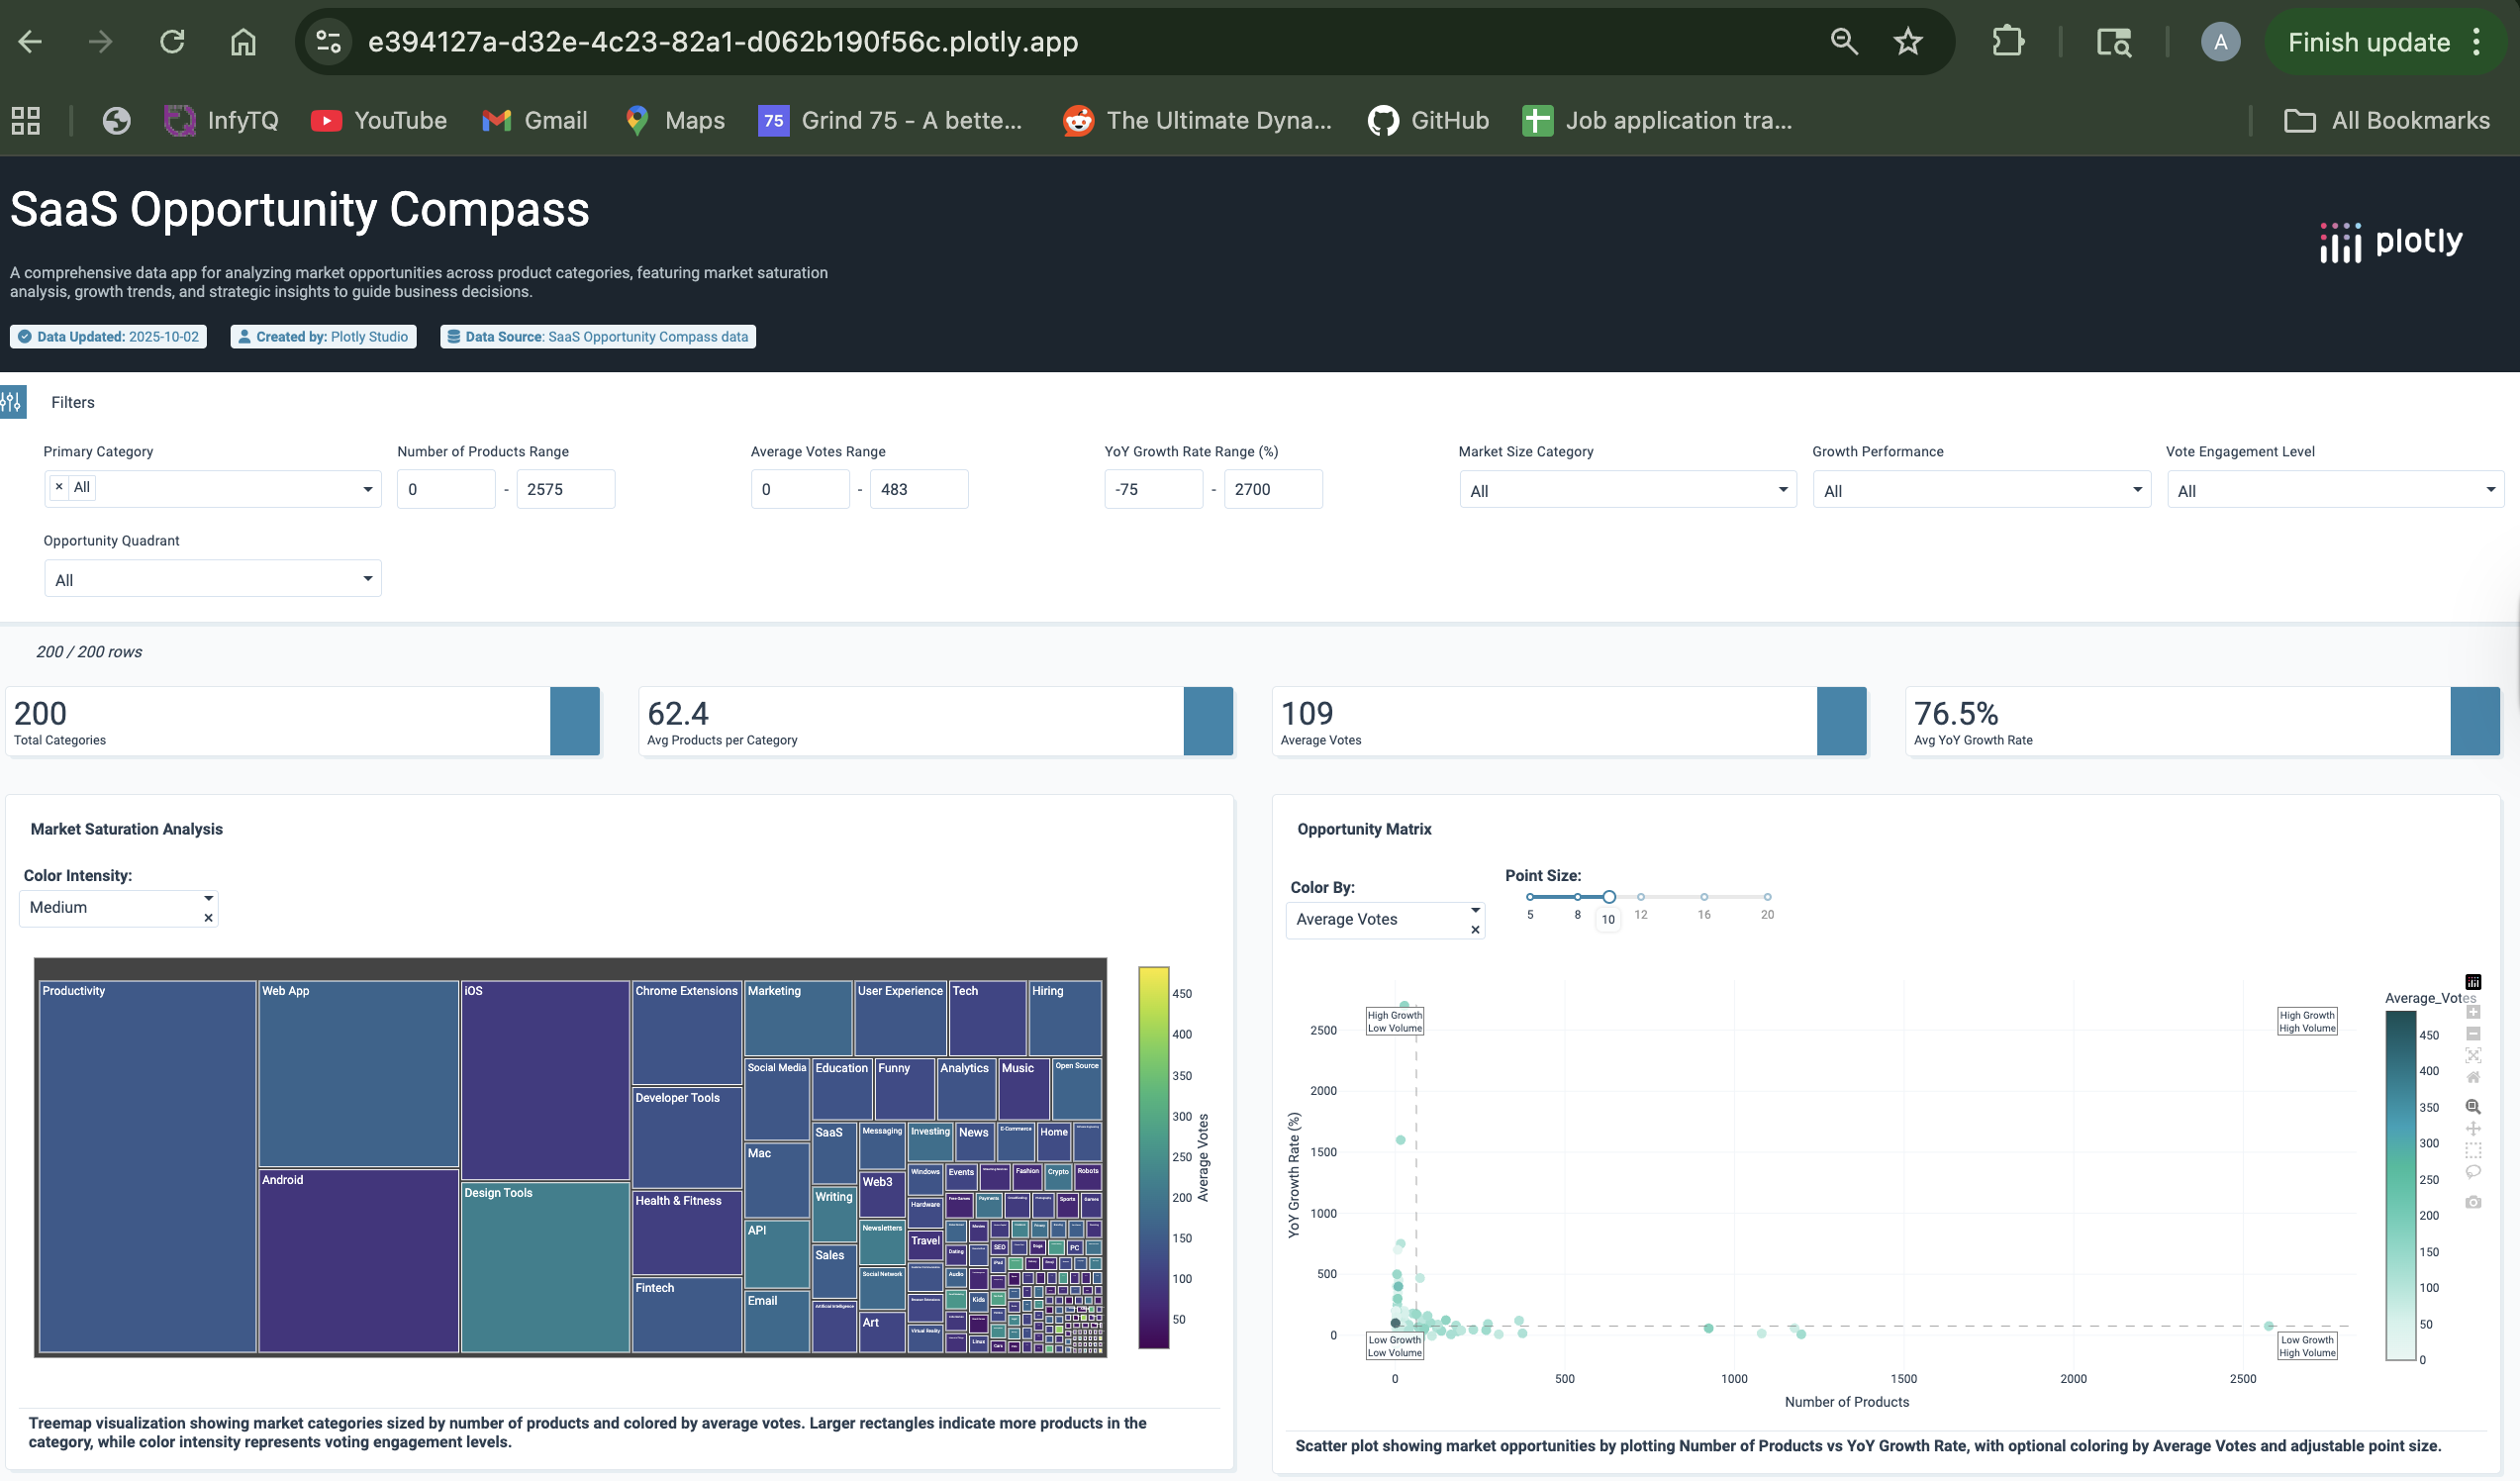
The SaaS Opportunity Compass is an interactive market intelligence dashboard built for venture capitalists and startup founders. It transforms raw product launch data into a clear strategic map by:
- Visualizing Market Saturation: A treemap instantly shows which product categories are crowded versus which are highly-rated by users.
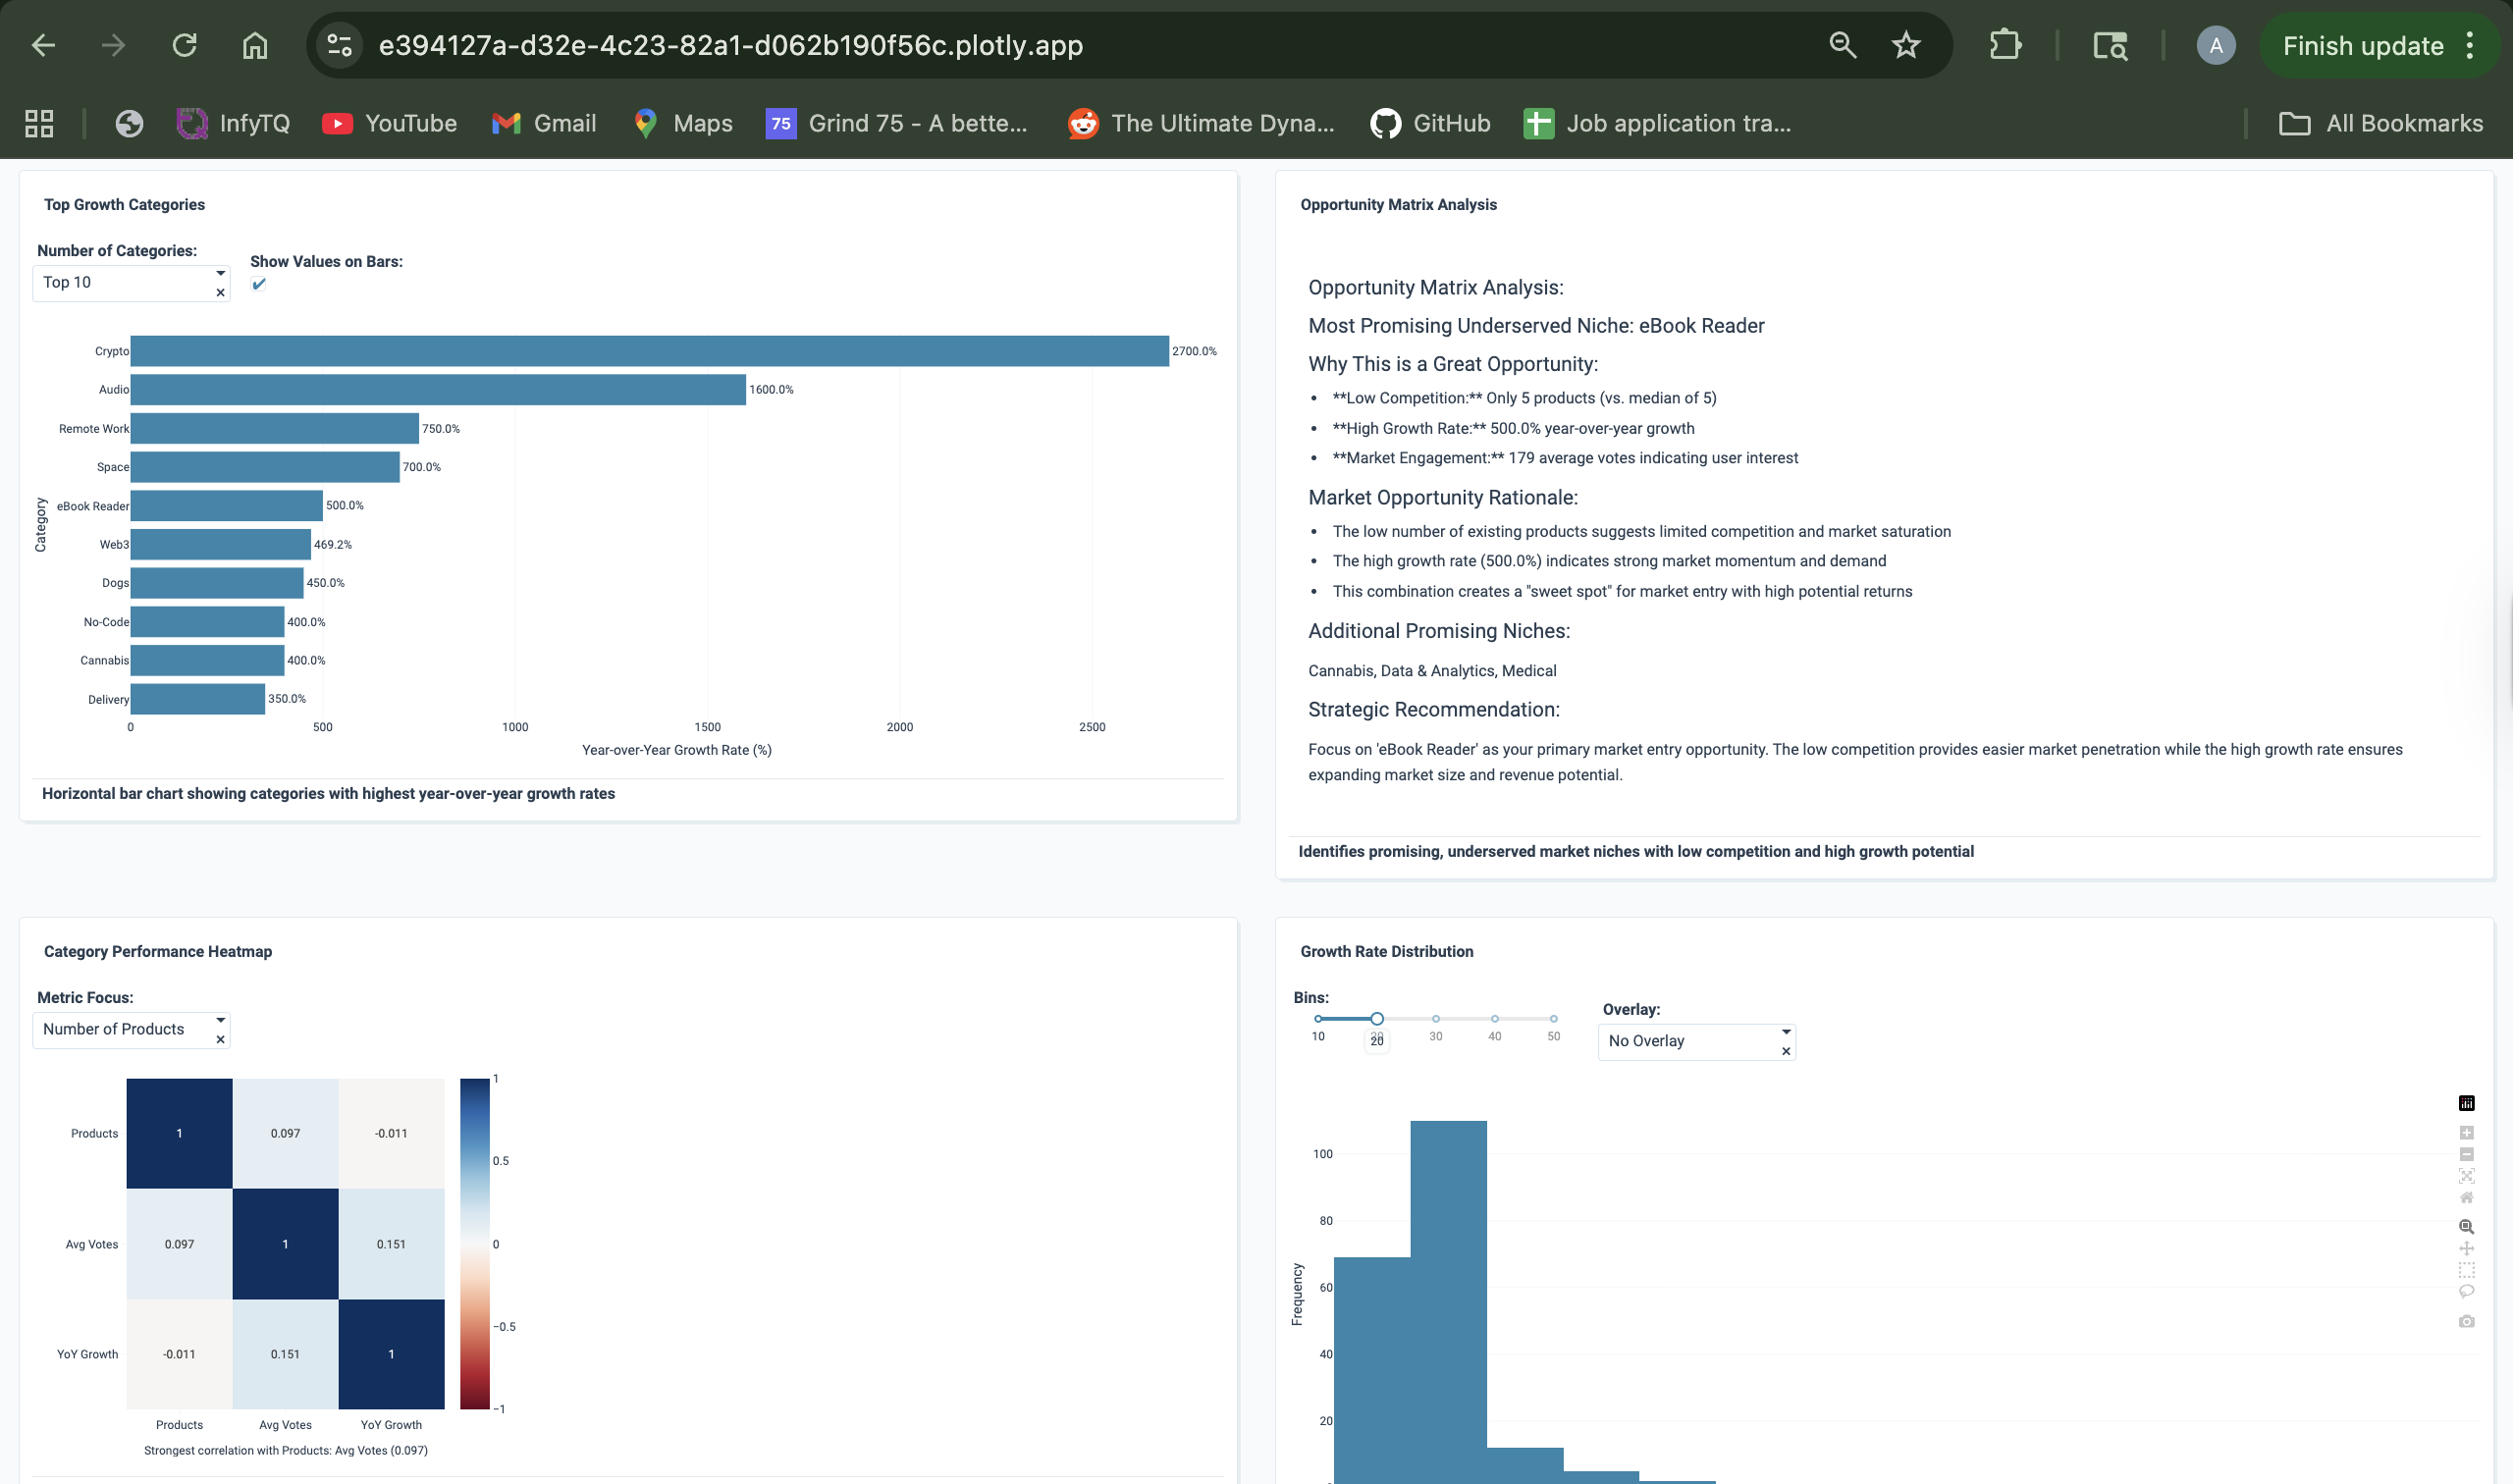
- Identifying High-Growth Niches: An Opportunity Matrix plots market categories based on their year-over-year growth and level of competition, highlighting emerging opportunities.
- Tracking Trends: Users can see which categories are growing fastest and dive into their historical launch data.
- Providing Actionable Insights: The app uses AI to generate executive-level summaries and strategic recommendations based on the user's filtered view.
How we built it
Our process was a three-stage journey from data to dashboard:
- Data Sourcing & Preparation: We sourced a comprehensive dataset of product launches from Kaggle, originally from Product Hunt. We then cleaned and standardized the data, especially the inconsistent product
topicscolumn, to create a reliablePrimary_Categoryfor analysis. - Feature Engineering: The core of our analysis involved creating derived metrics. Using Python with Pandas, we calculated the
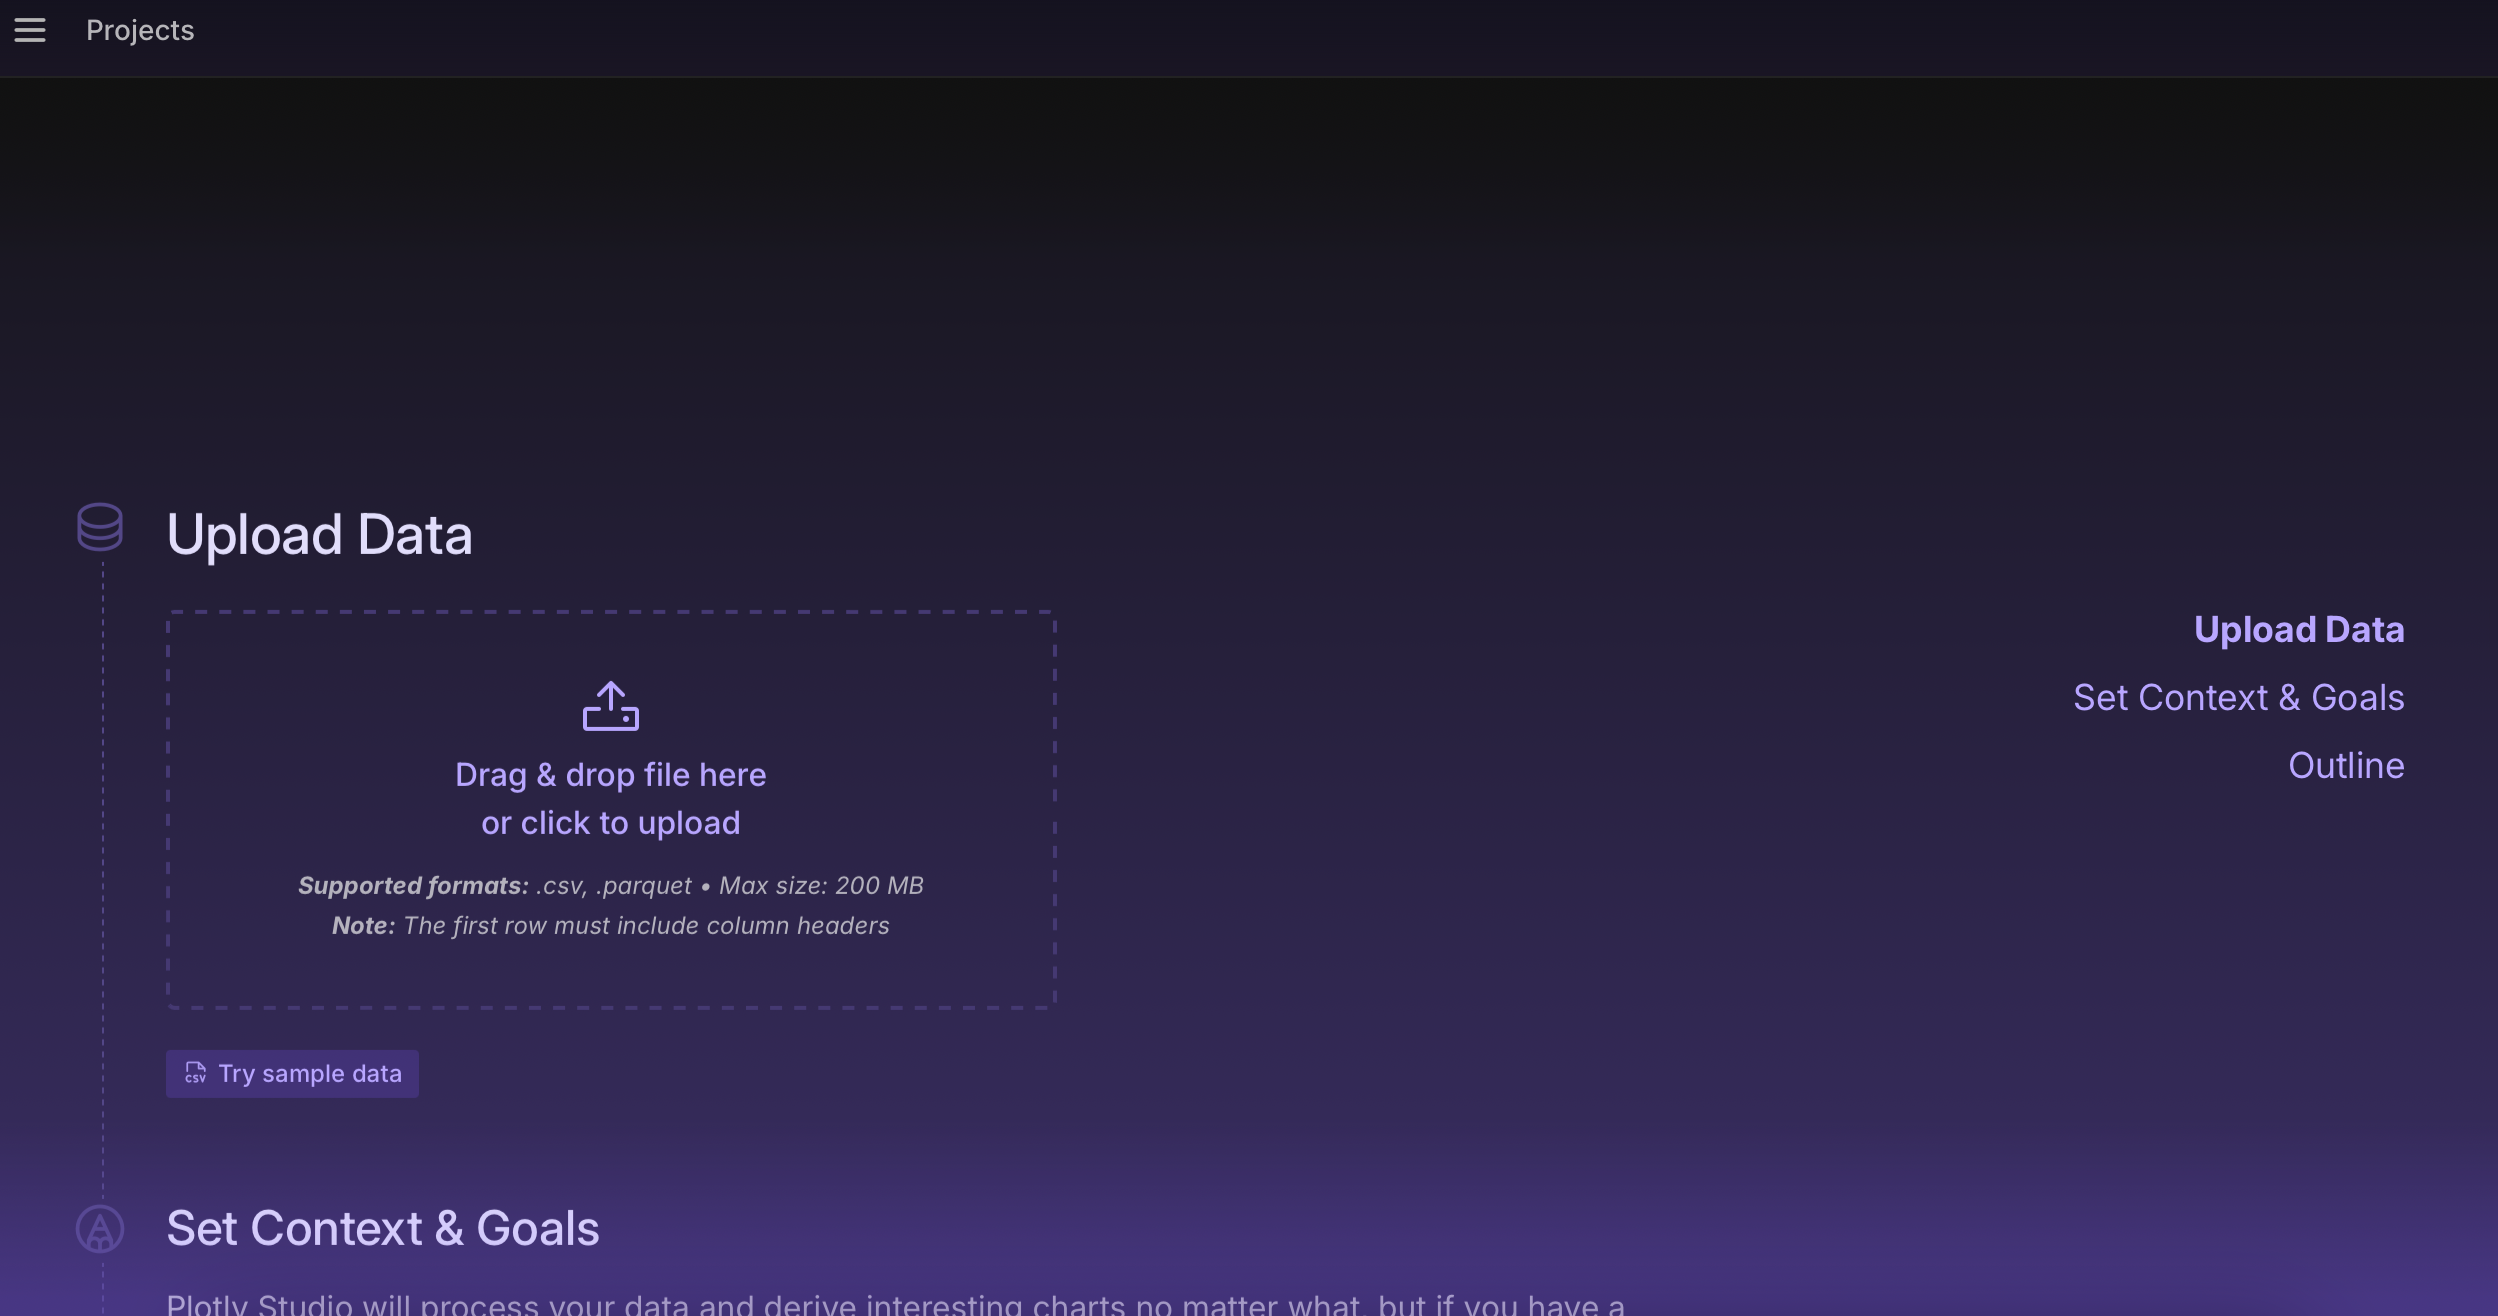
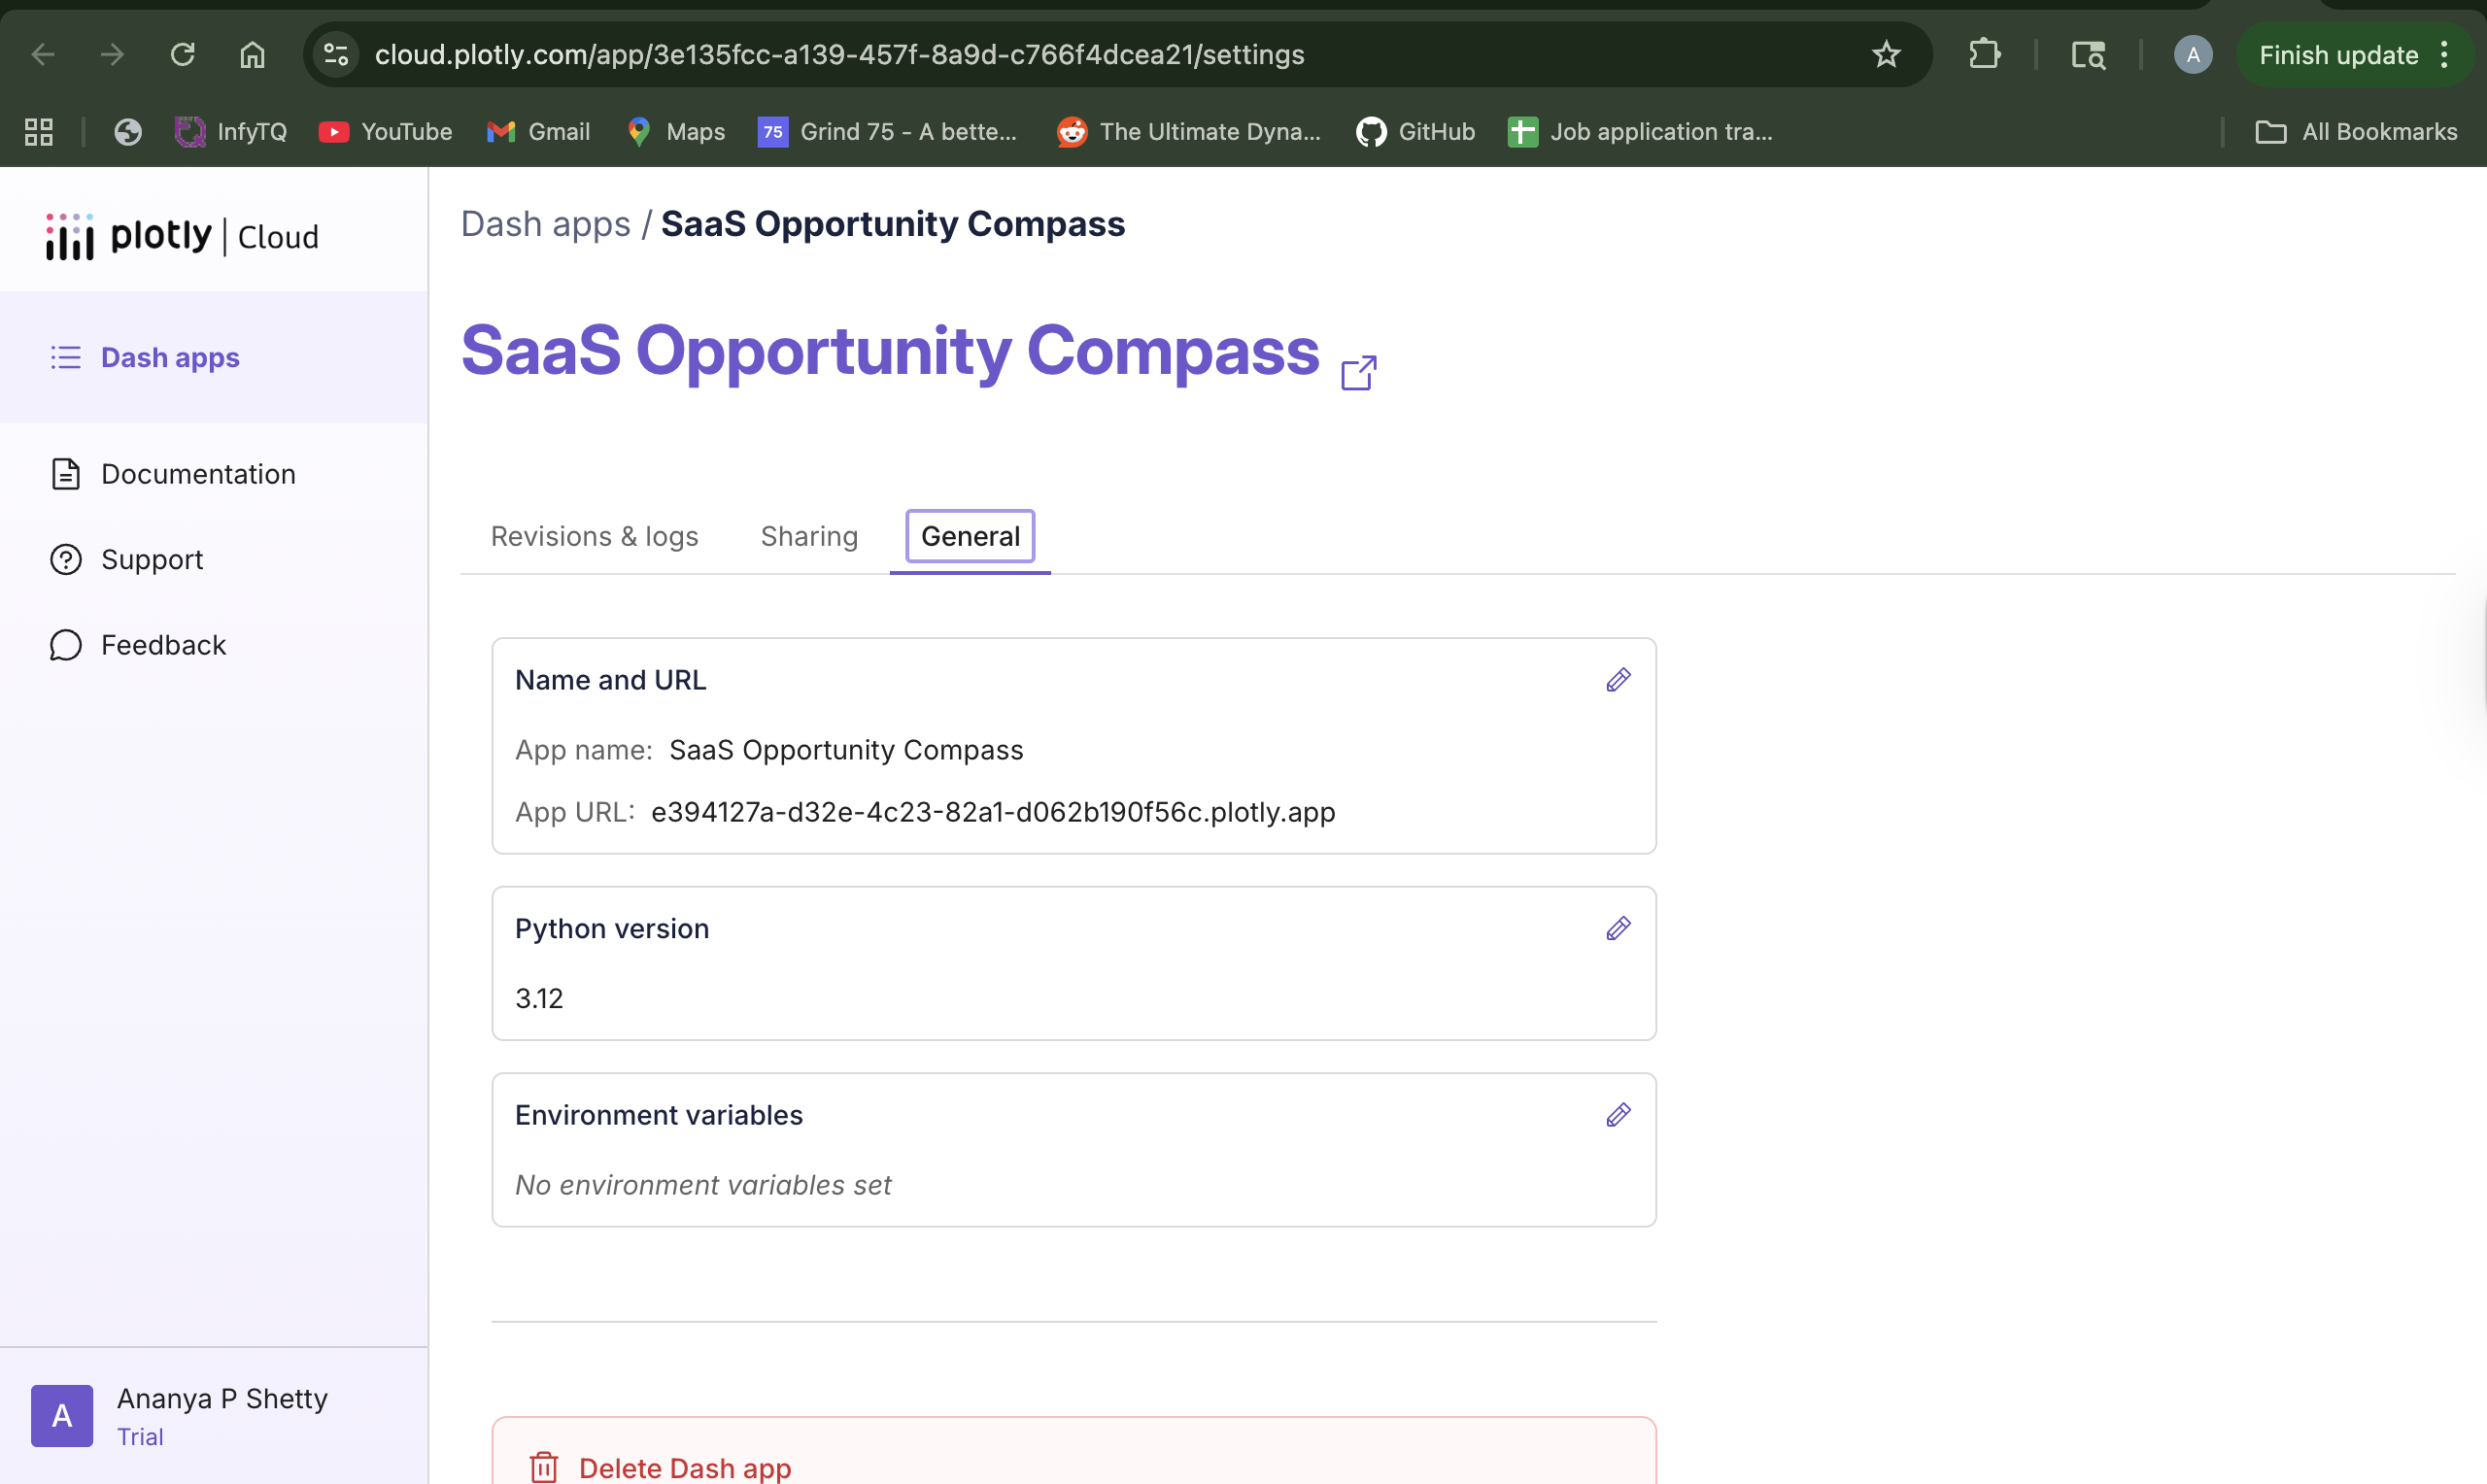
YoY_Growth_Rate, total product count, and average user votes for each category to measure market momentum and sentiment. - Visualization in Plotly Studio: We uploaded our engineered dataset to Plotly Studio and used a detailed natural language prompt to generate the initial 4-card dashboard. We then iteratively refined the app with edits, fine-tuning chart types, titles, colors, and adding the final AI-powered recommendation card to complete the narrative.
Challenges we ran into
Our main challenge was the initial data quality. The product categories were user-generated and messy, requiring a thoughtful data cleaning strategy to ensure our analysis was accurate. We also faced the strategic challenge of the hackathon's AI credit limit. This forced us to be highly efficient, planning our dashboard layout and prompts meticulously on paper before implementation to make every edit count.
Accomplishments that we're proud of
We are most proud of creating a true strategic framework, not just a set of charts. The Opportunity Matrix is an accomplishment because it transforms complex data into a simple, intuitive 2x2 grid that immediately provides strategic guidance. We're also proud of how the final AI-powered summary provides an actionable investment thesis, elevating the app from a visualization tool to a decision-making engine.
What we learned
This project reinforced the principle that raw data is only as valuable as the insights you can derive from it. The feature engineering step was where the real value was created. We also learned how dramatically AI-powered tools like Plotly Studio can accelerate the development cycle. What would have taken days of coding was achievable in a fraction of the time, allowing us to focus more on the story and the strategic insights of the data.
What's next for SaaS Opportunity Compass
The current dashboard serves as a powerful proof-of-concept. The next steps would be to transform it into a dynamic, real-time tool:
- Live Data Integration: Connect directly to the Product Hunt or other platform APIs for up-to-the-minute market analysis.
- Expanded Data Points: Incorporate additional data, such as company funding rounds or social media trends, to create a more robust "opportunity score."
- Trend & Keyword Analysis: Implement a feature to analyze keywords within product descriptions to identify emerging micro-trends before they become mainstream categories.


Log in or sign up for Devpost to join the conversation.