-
-
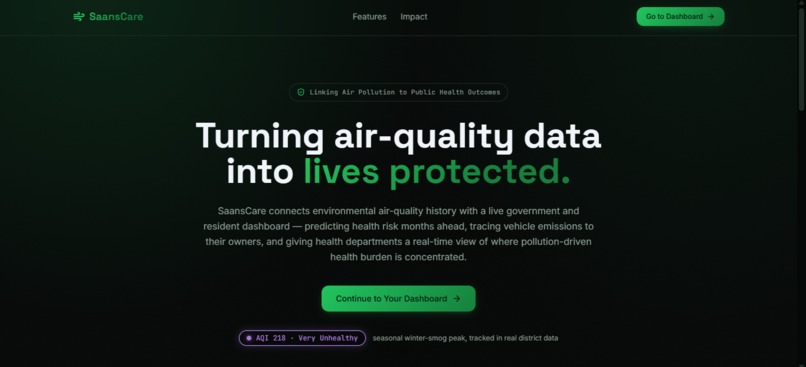
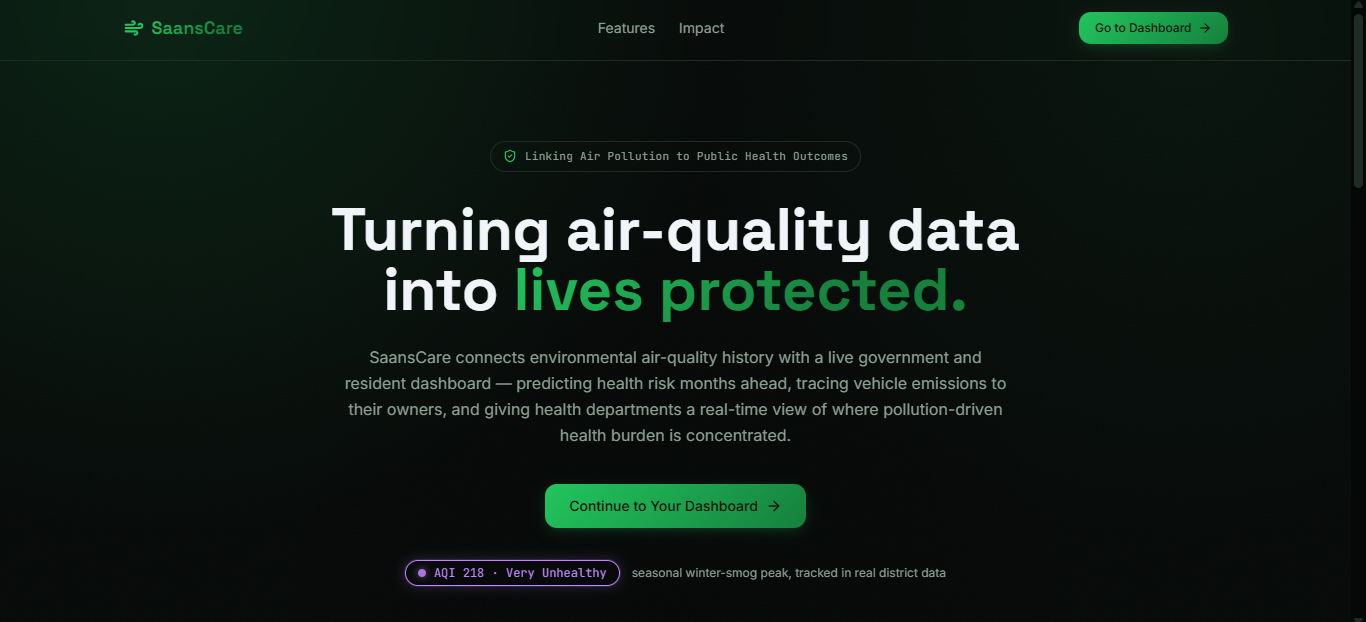
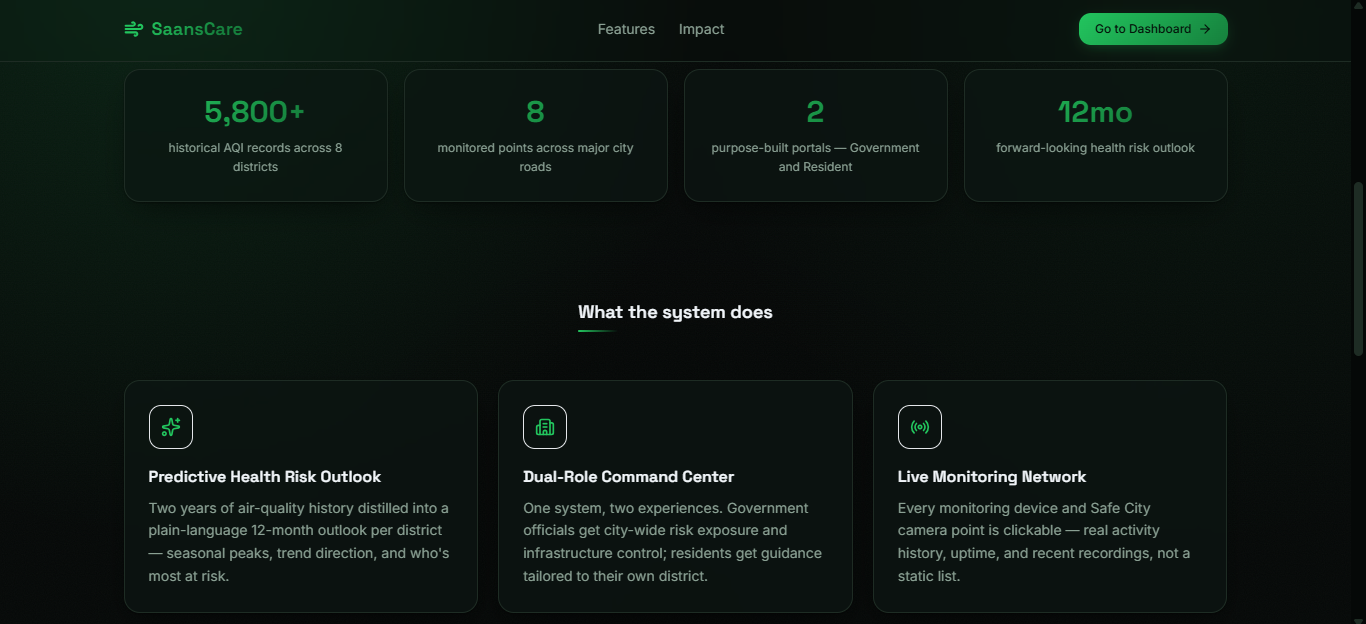
SaansCare Main Page
-
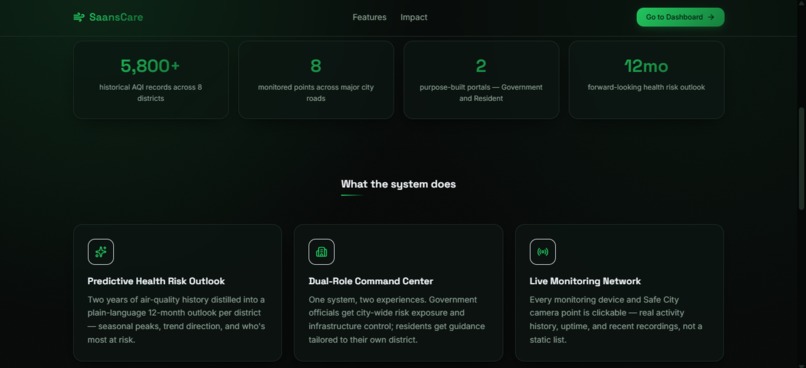
Features
-
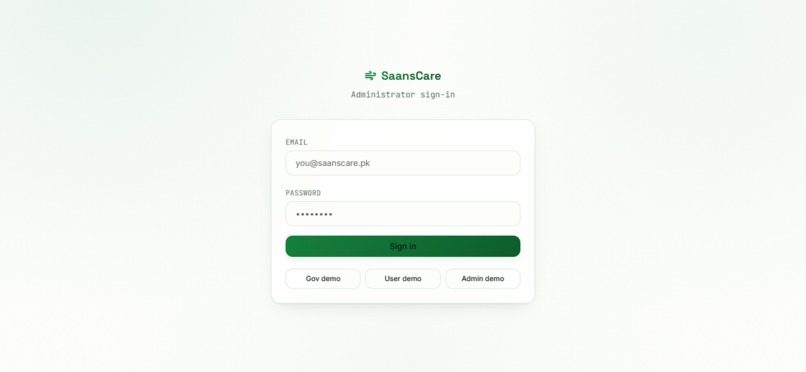
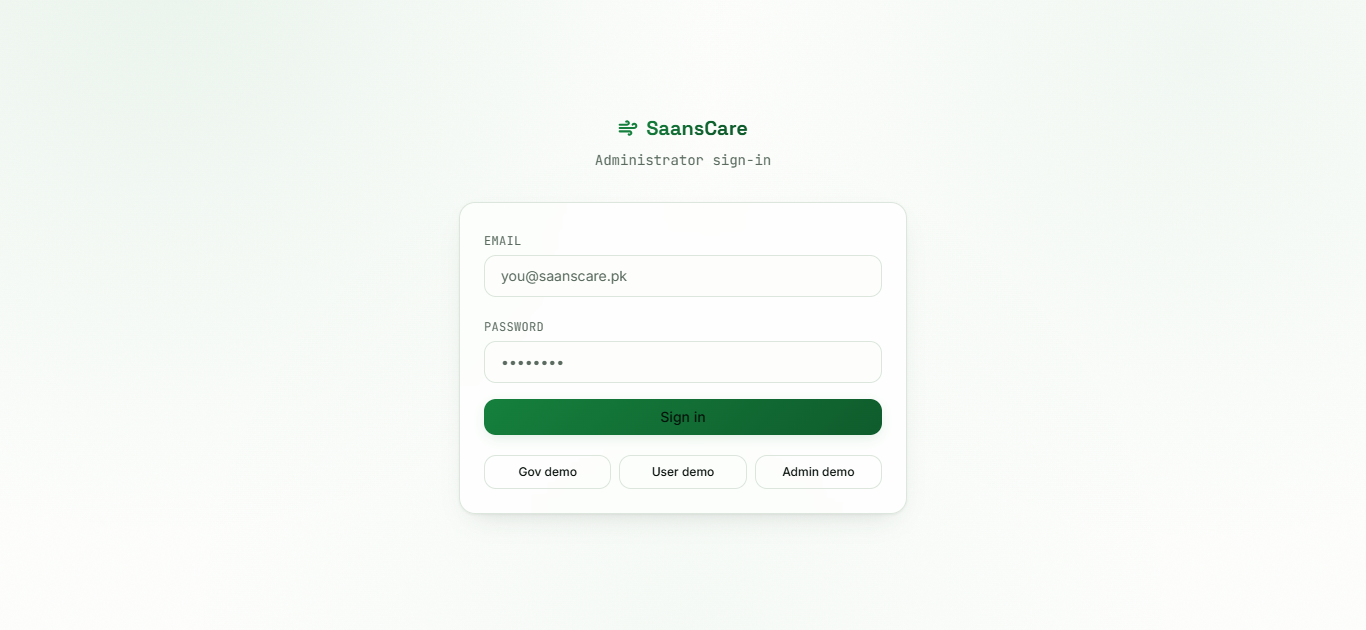
logins with demo login of user,gov,admin
-
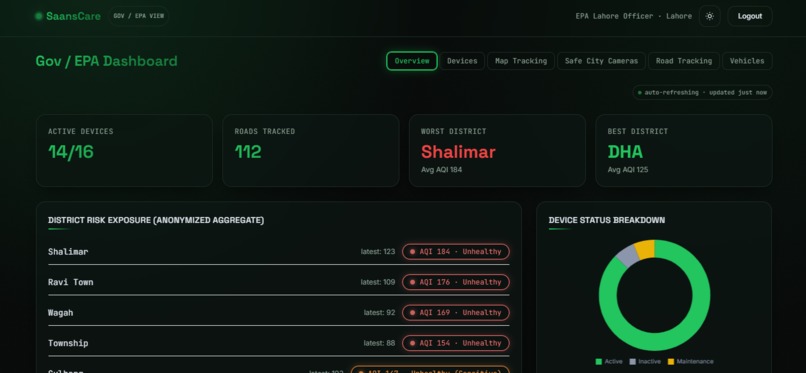
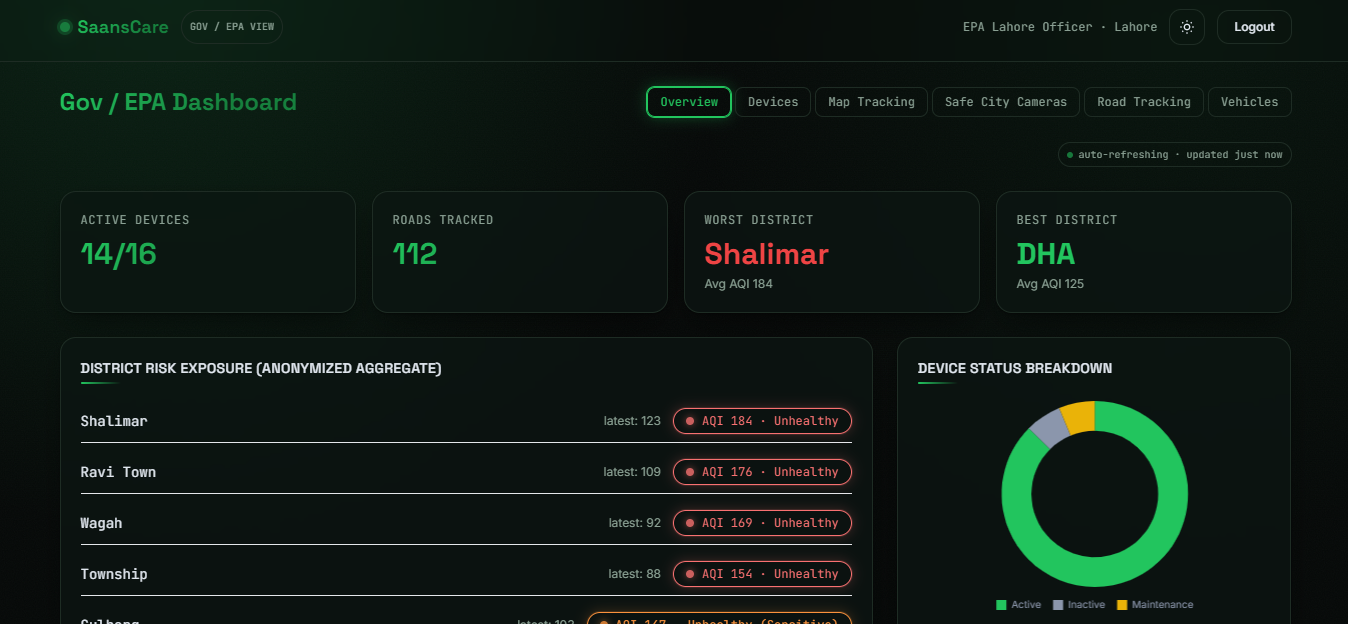
Gov Dashboard District Risk Exposure (anonymized aggregate)
-
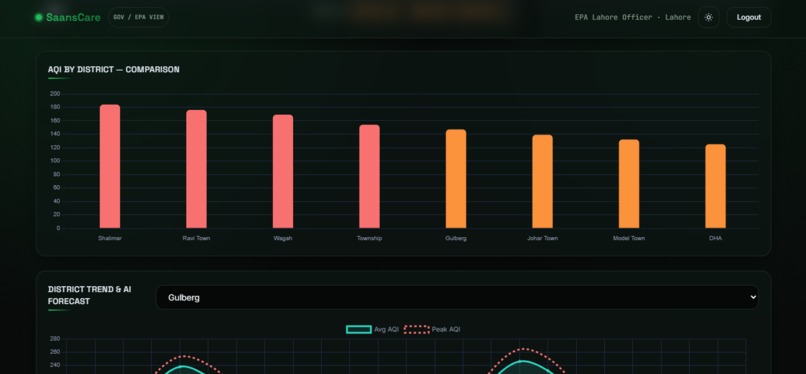
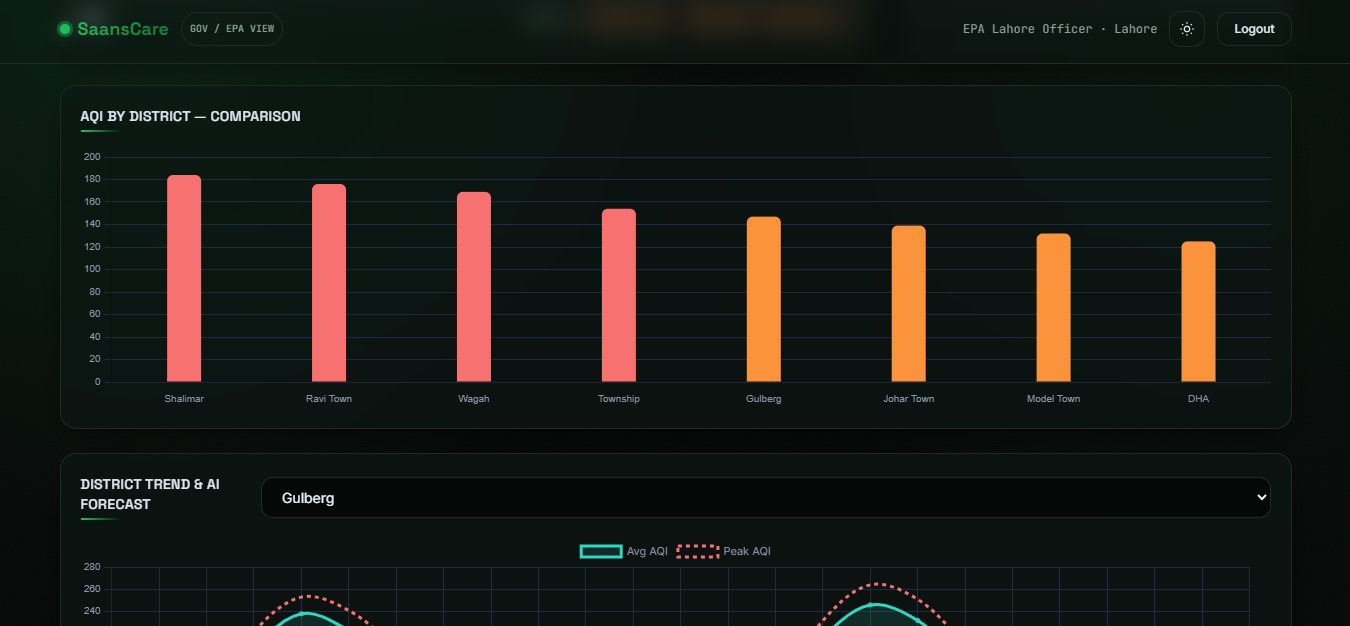
AQI by District — Comparison
-
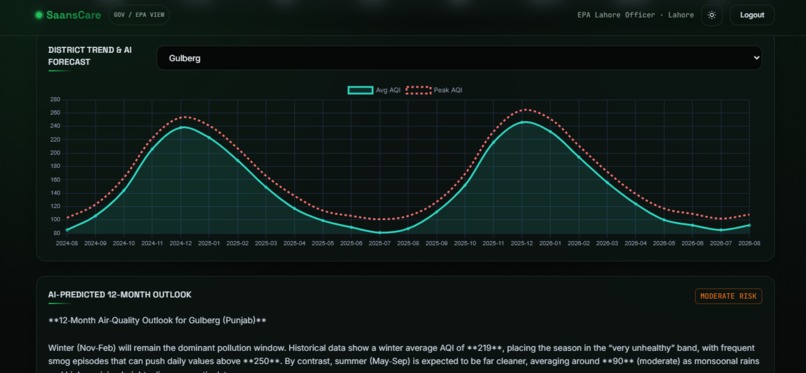
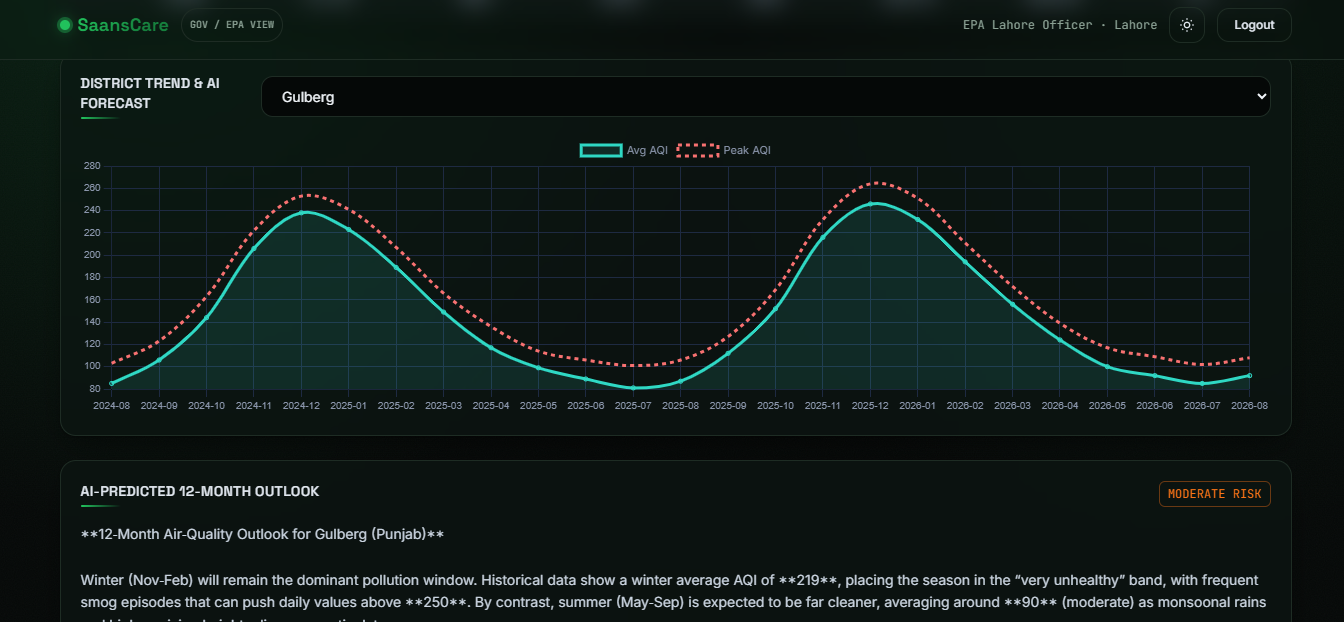
District Trend & AI Forecast
-
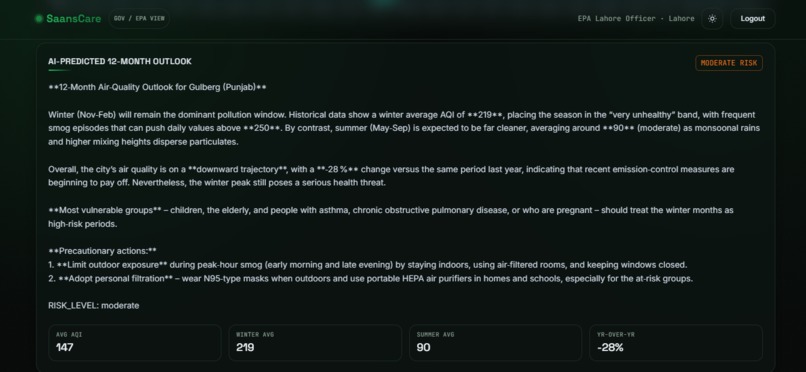
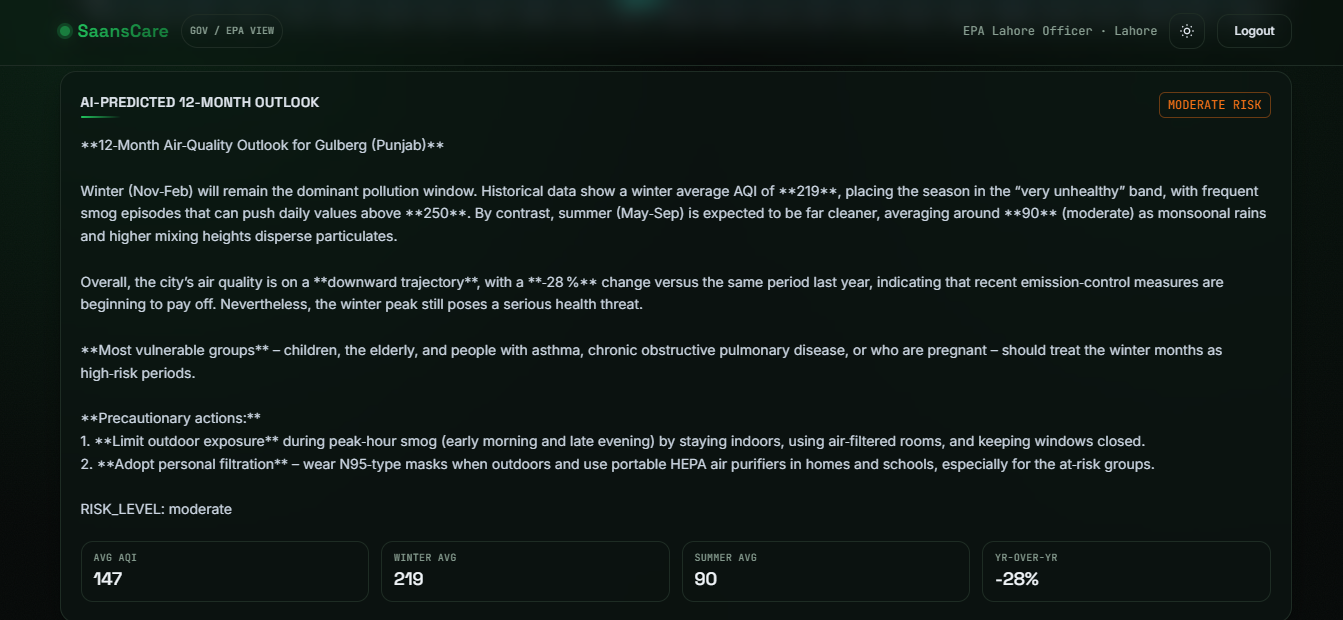
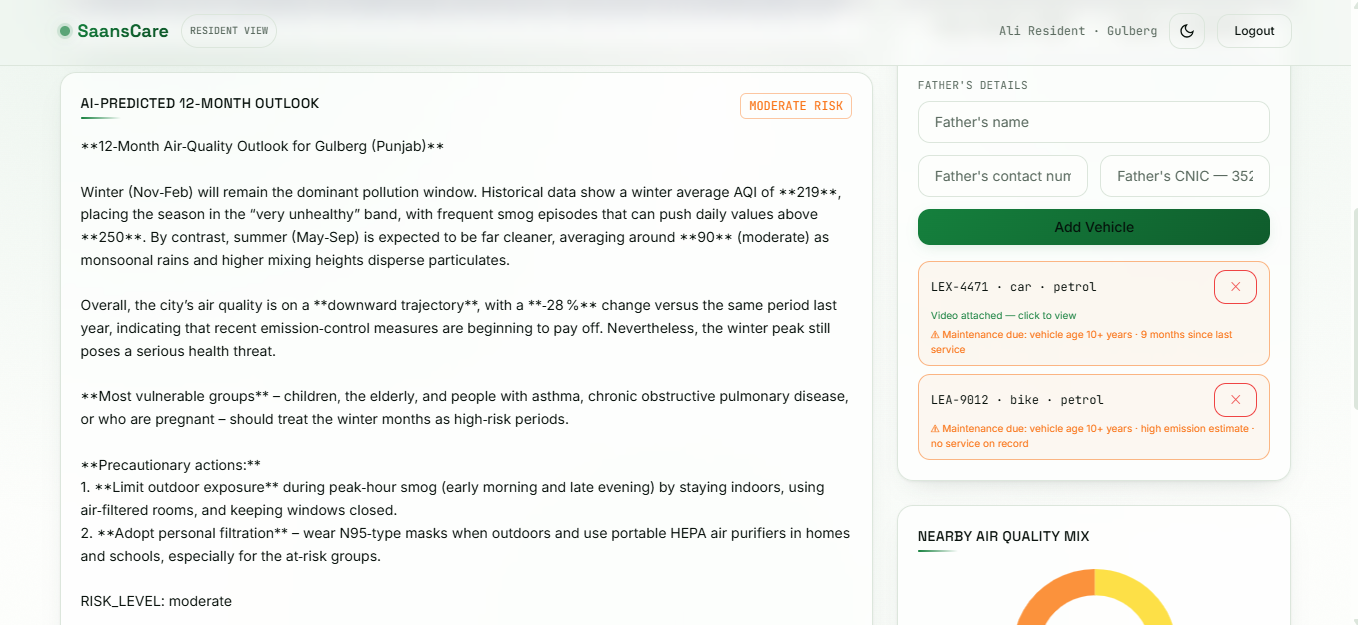
AI-Predicted 12-Month Outlook
-
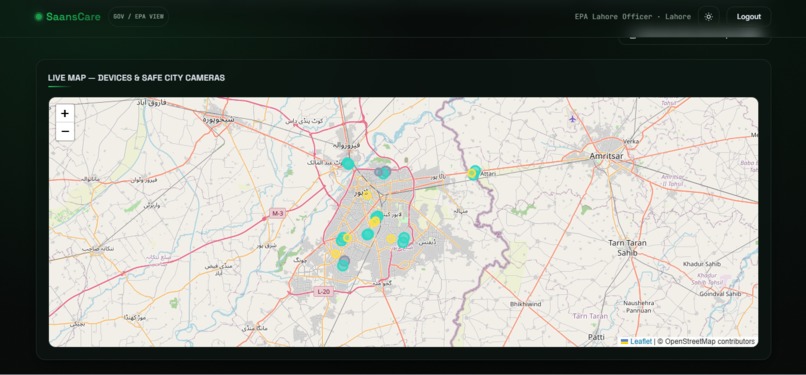
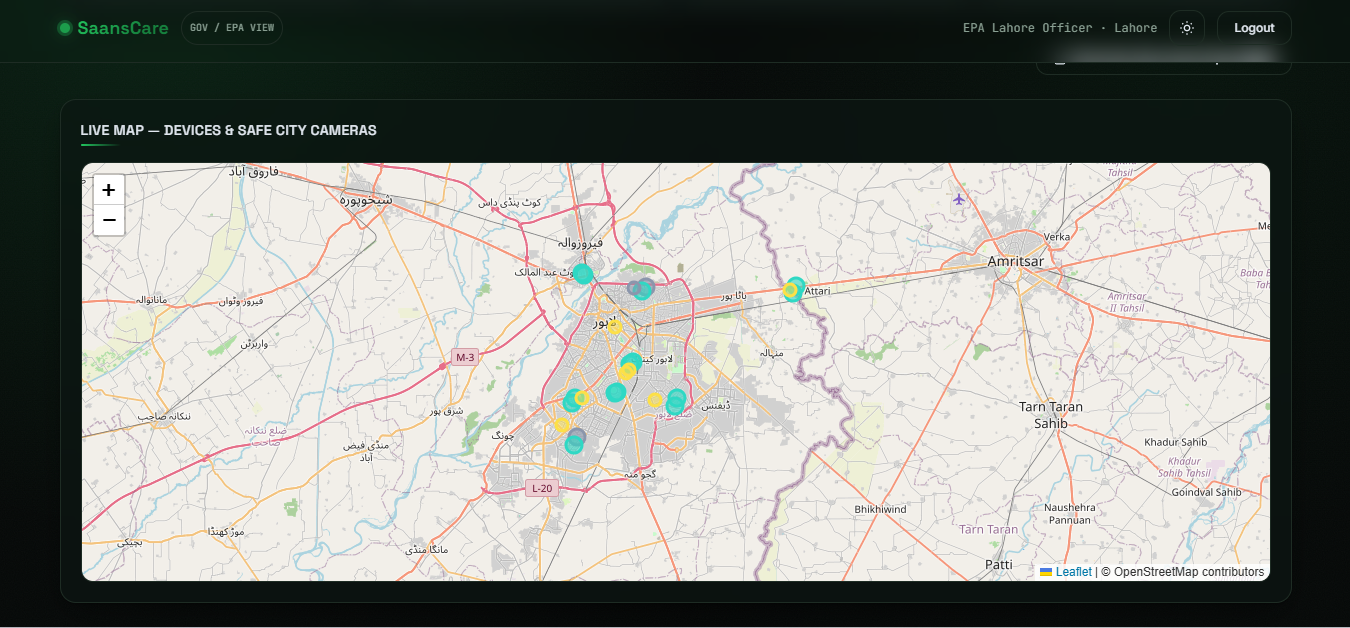
Live Map — Devices & Safe City Cameras
-
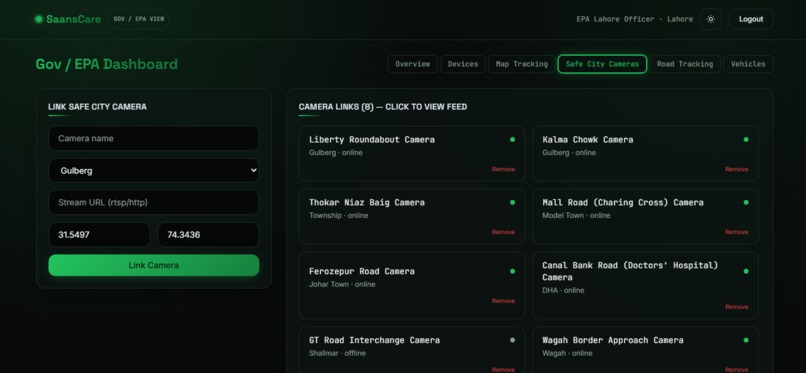
AQI Monitor Devices
-
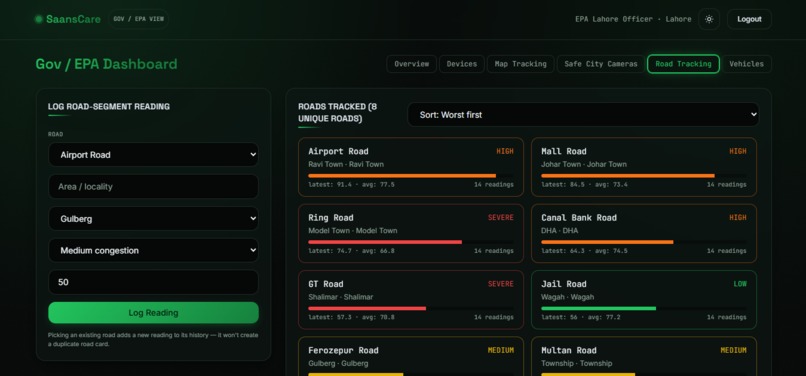
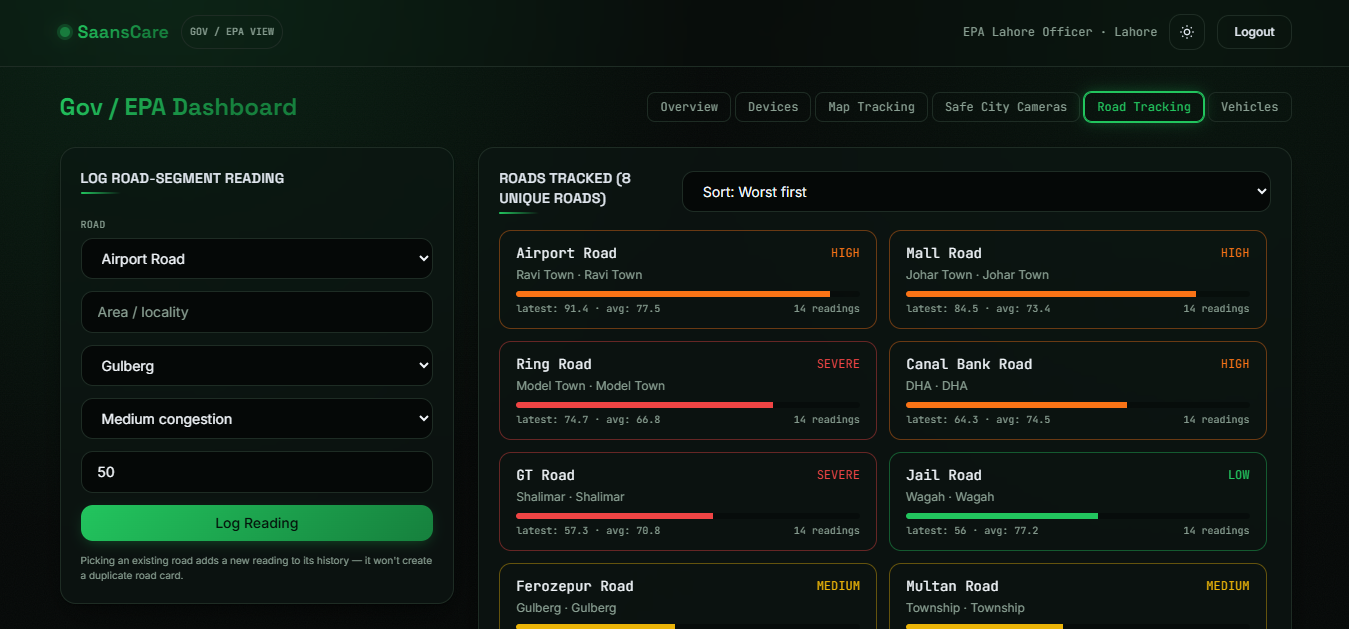
Roads AQI Tracking System
-
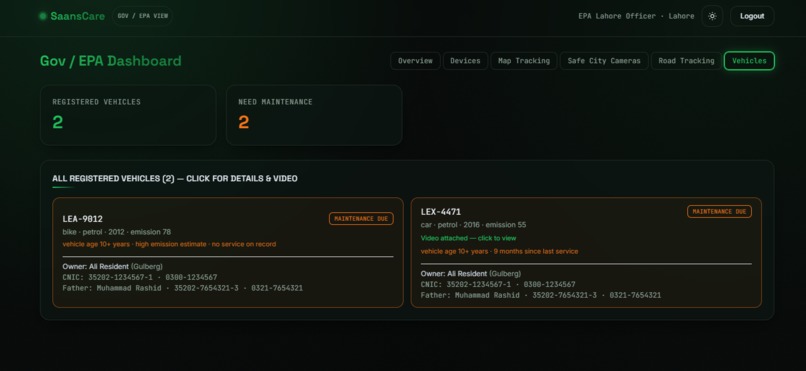
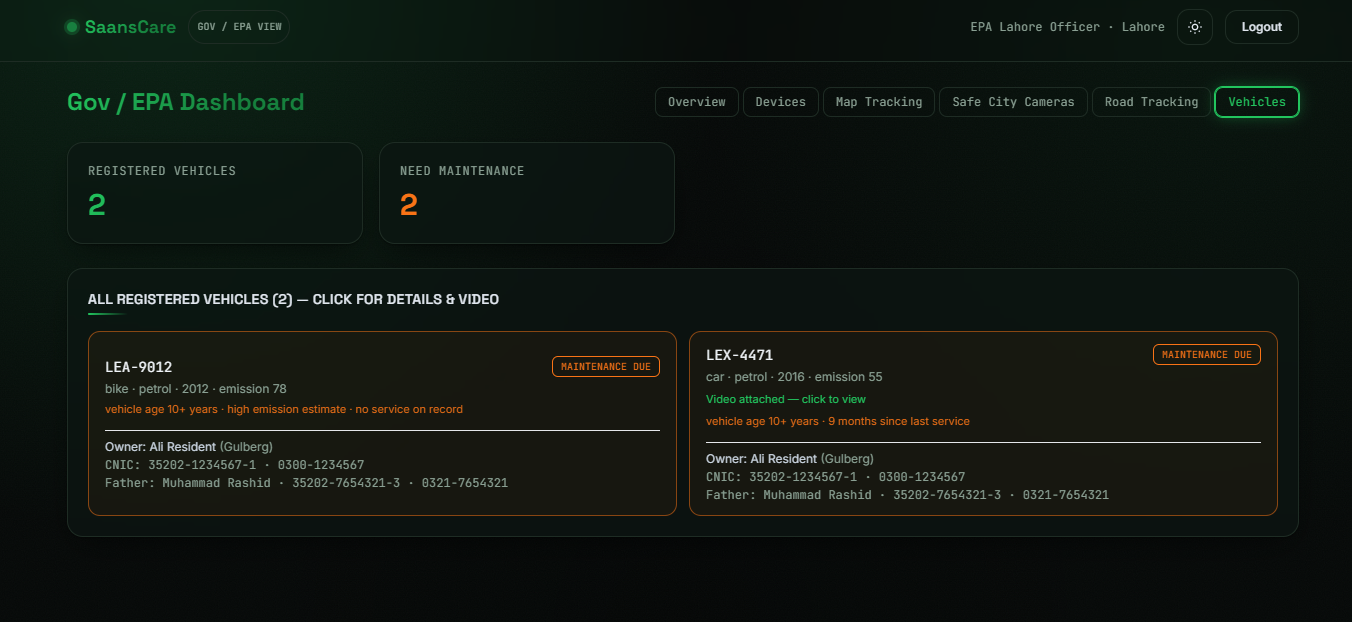
Vehicals data with all details and maintenance
-
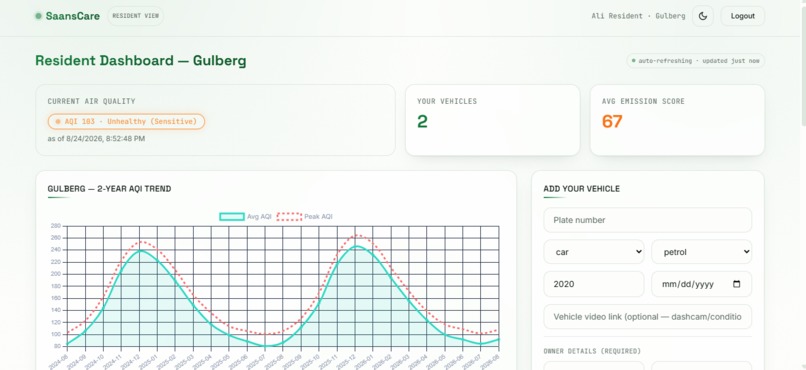
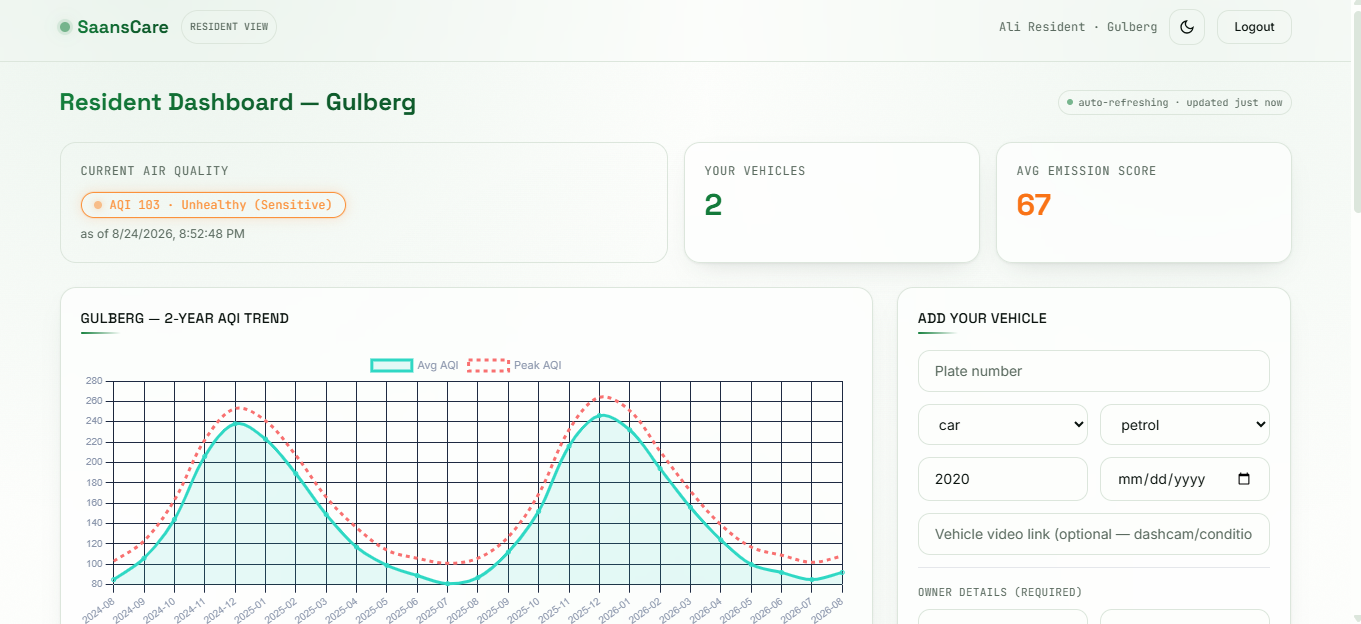
Resident Dashboard
-
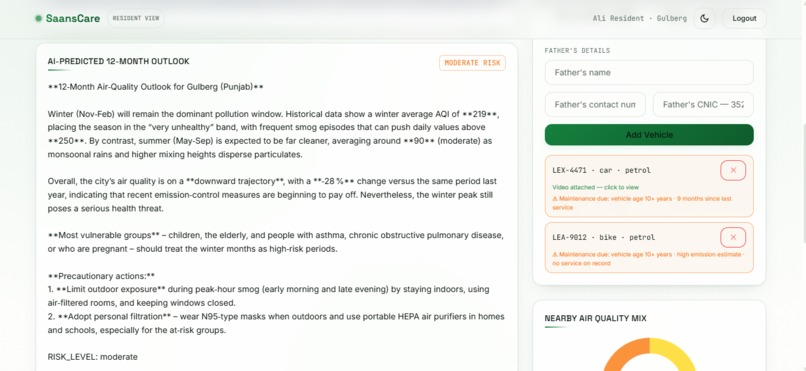
Prediction system for user
-
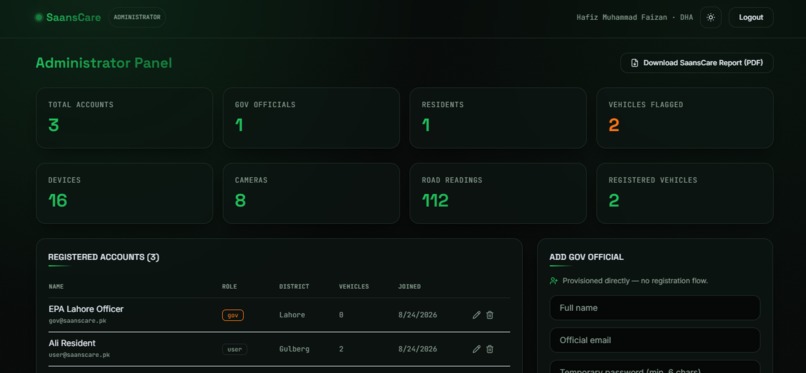
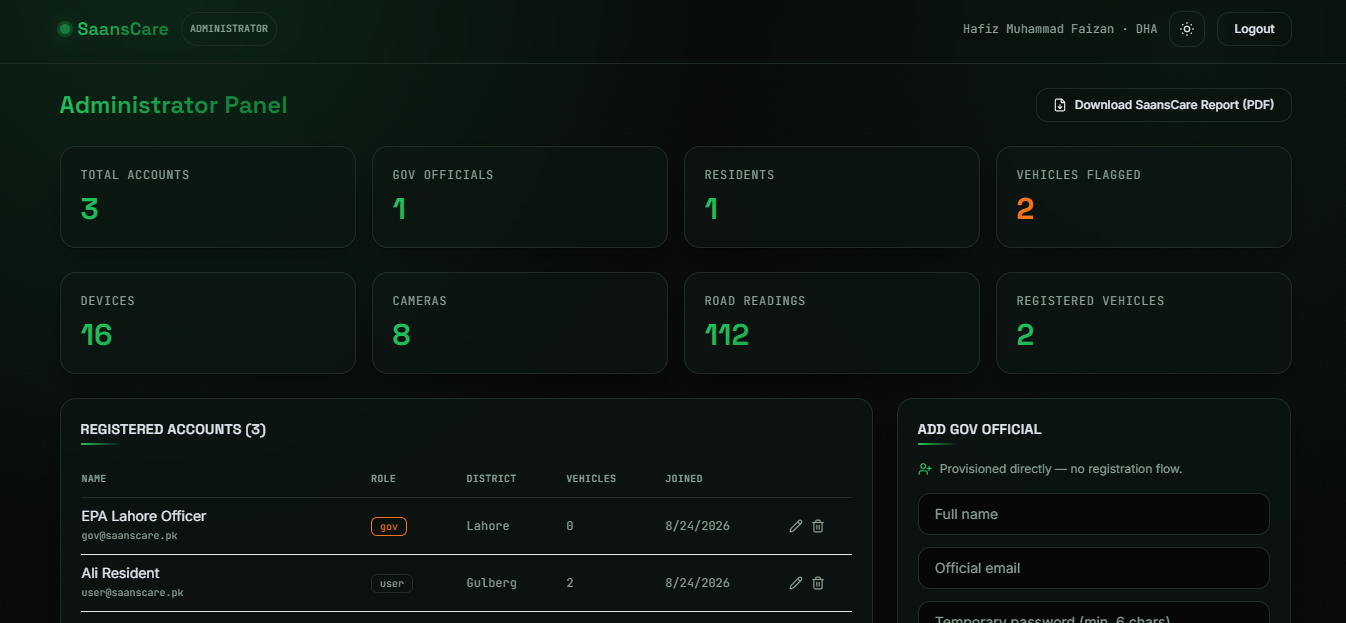
Admin Dashboard where admin can all data saved in SaansCare
-
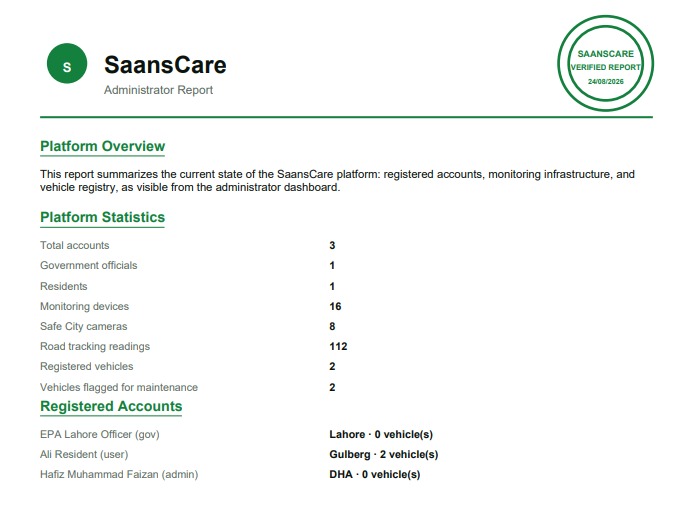
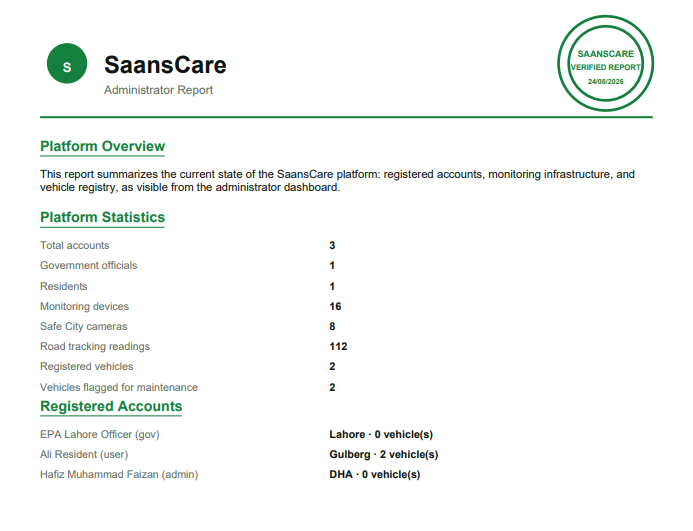
these are instructions reports available in all dashboard for better understanding.
Inspiration
Lahore regularly ranks among the world's most polluted cities, especially during winter smog season (Nov–Feb), when AQI routinely crosses "Hazardous." Public AQI numbers exist, but they're just a number — they don't tell a parent whether it's safe for their asthmatic child to play outside today, and they don't give the Health Department a way to see where the pollution-driven health burden is actually concentrated. The Smart City Hackathon Lahore 2026's problem statement — "Linking Air Pollution to Public Health Outcomes," for Punjab EPA and the Health Department — was exactly the gap we wanted to close.
What it does
SaansCare is a role-based dashboard, not just a data viewer:
- Residents get their district's current AQI, a 2-year trend, an AI-generated 12-month health risk outlook, and can register their own vehicle(s) for emission/maintenance tracking.
- Gov/EPA officials get city-wide risk exposure by district, a live device and Safe City camera network, road-segment pollution tracking, and a vehicle registry auto-flagged for overdue maintenance — traceable to the owner.
- Administrators manage the whole platform: provisioning Gov accounts directly (no open registration for that role), editing or removing accounts, and running scoped data resets.
How we built it
MERN-style stack, but with MySQL instead of Mongo: Node/Express/Sequelize on the backend, React 19 + Vite + Tailwind on the frontend, Chart.js and Leaflet for visualization, and Groq's LLM for the narrative forecasts (with a deterministic rule-based fallback so the feature never breaks live if the API is unavailable). We seeded ~5,800 historical AQI readings across 8 real Lahore districts with realistic winter-smog seasonality, so every chart and forecast works against real patterns, not flat placeholder data.
We built it iteratively: core AQI dashboard first, then the Gov/User dual portal, then real MySQL (swapped in from an initial SQLite prototype), then the admin layer, PDF reporting, and UI polish — testing each layer end-to-end against a live database before moving to the next.
Challenges we ran into
- A model deprecation, not a bug. Our AI forecasts kept silently falling back to the rule-based generator even with a valid API key — turned out Groq had deprecated the model we were using. Tracked it down properly instead of guessing, and fixed the actual cause.
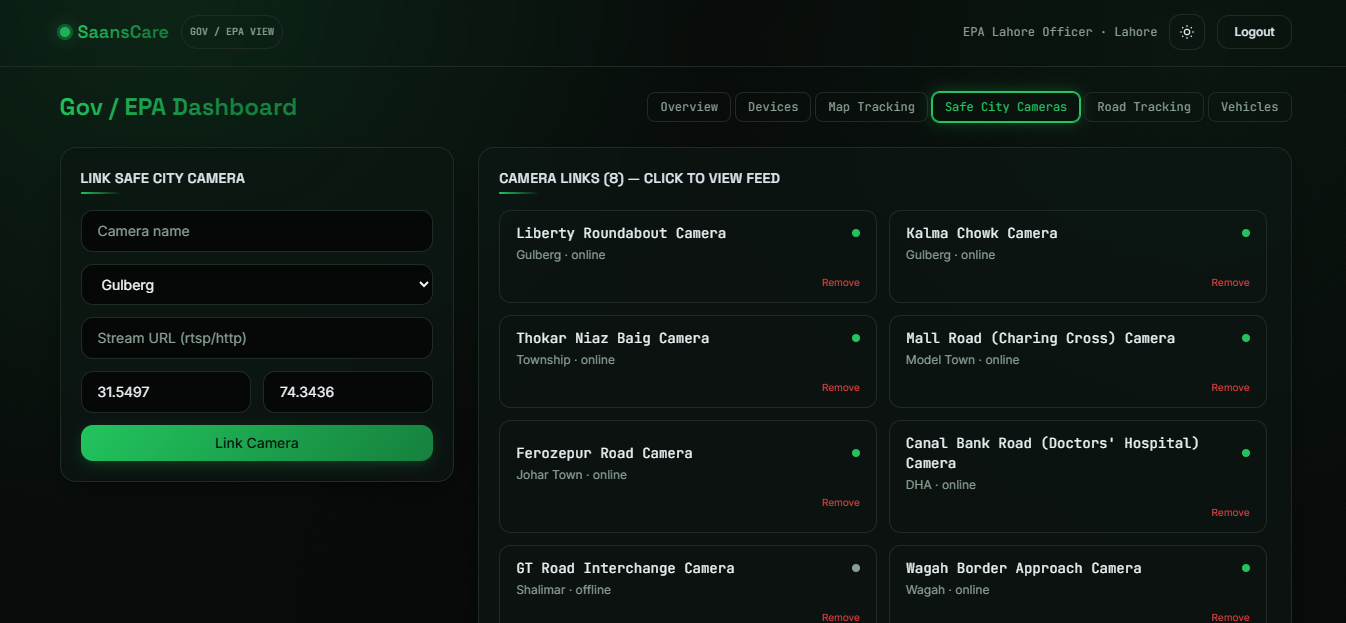
- Being honest about what's real. Lahore's actual Safe City camera network is a closed government system with no public API. Rather than fake a live feed, we built a clearly-labeled simulated view with a link to genuine public reference footage — useful for the demo without misrepresenting what's actually connected.
- A subtle data bug. Road tracking logs multiple historical readings per road for trend purposes, but the API was returning all of them unaggregated — 112 near-duplicate cards instead of 8 clean ones. Fixed at the source with proper aggregation.
- Confidentiality by design, not as an afterthought — locking registration to residents only, making Gov/Admin provisioning deliberate and traceable, and validating CNIC/email formats on both client and server.
What we learned
Building for three genuinely different personas (resident, official, administrator) in one system forces real product decisions, not just more UI — what each role should see, edit, and never be able to touch. We also learned to treat "AI-powered" features defensively: always design the fallback path first, then layer the LLM on top, so a third-party API hiccup never takes down the core product.
What's next
Swapping the seeded historical data for a live ingestion job against Punjab EPA's public AQI feed, and pursuing real Safe City camera access through proper channels rather than simulating it.
Built With
- bcrypt
- chartjs
- css3
- express.js
- git
- github
- groq
- html5
- javascript
- jspdf
- jwt
- leaflet.js
- lucidereact
- mysql
- node.js
- react
- reactrouter
- restapi
- sequelize
- tailwindcss
- vite


Log in or sign up for Devpost to join the conversation.