-
-
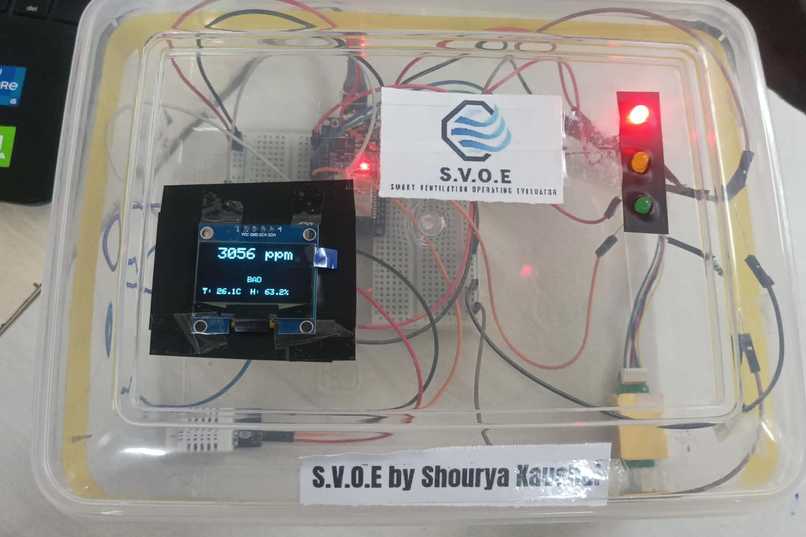
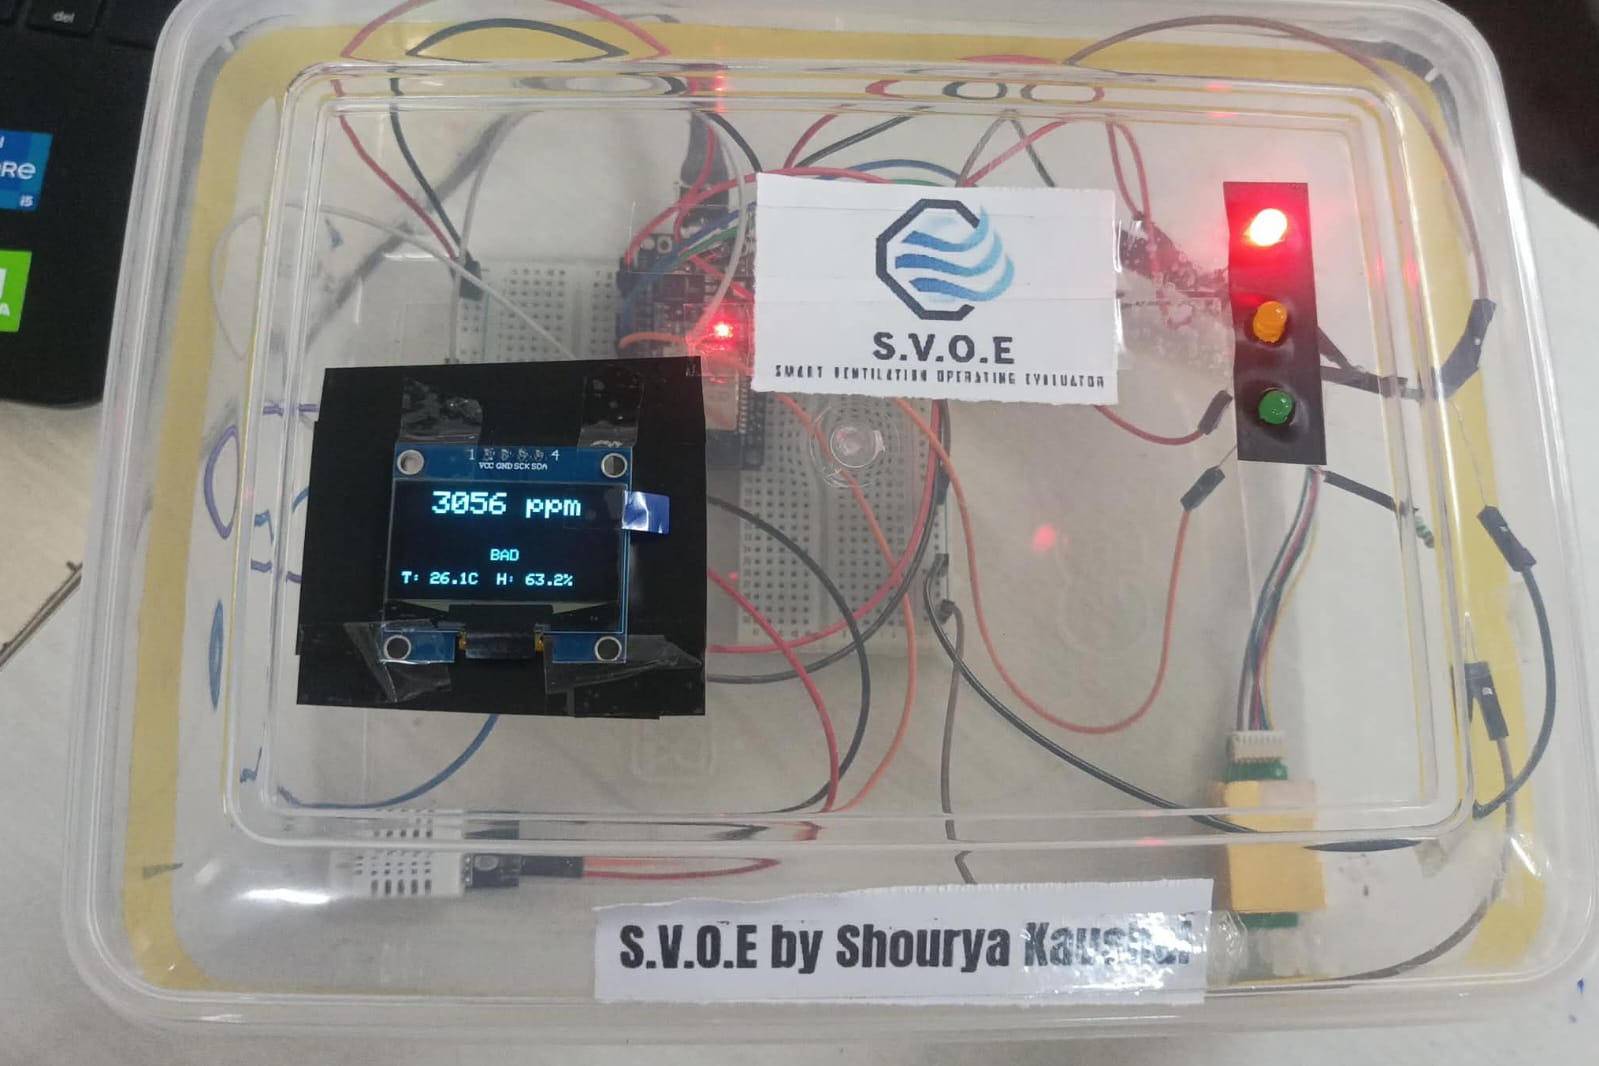
The final model
-
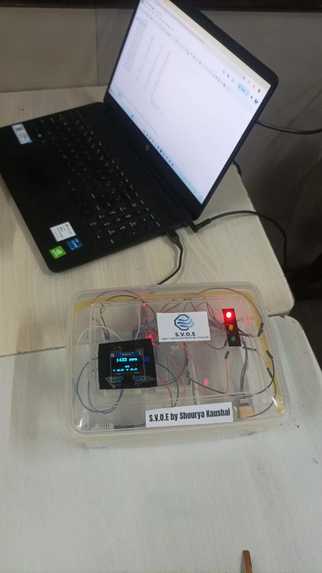
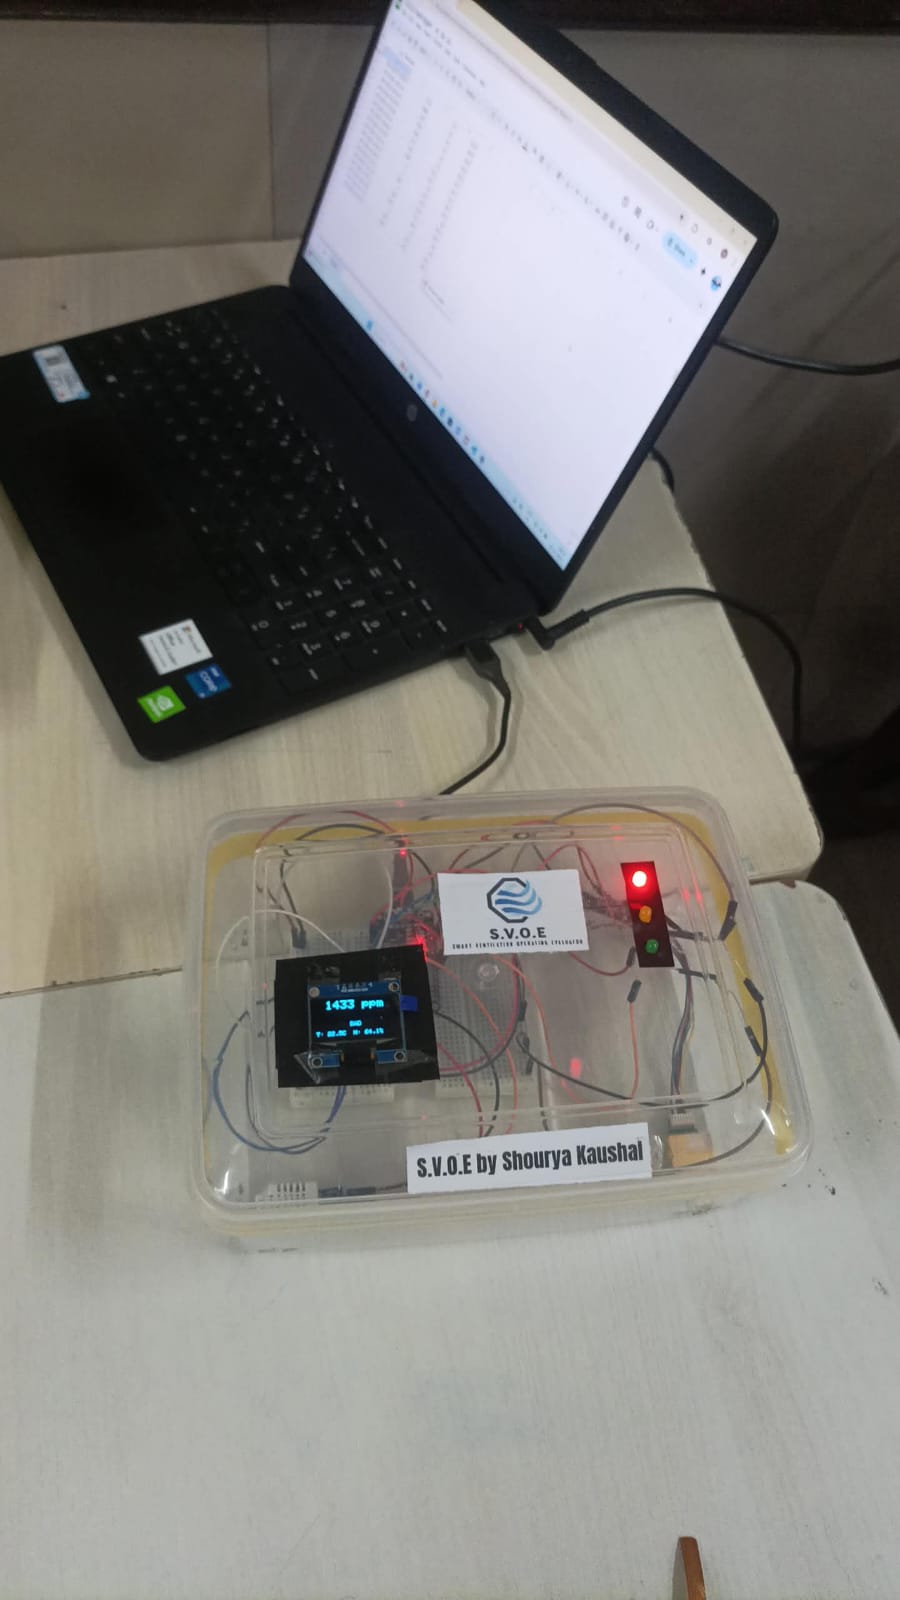
Taking live readings in a classroom
Inspiration
While sitting in class, I often noticed that as the lesson progressed, many students, including myself, started to feel unusually tired and fatigued. At first I thought it might just be boredom but then I realized it might be more.
This curiosity rose in me to figure out what was exactly happening, this led me to discover the high levels of CO₂ in a room must be responsible for this. This inspired me to investigate how CO₂ accumulates in a classroom environment and how ventilation influences its removal.
What it does
The S.V.O.E records the level of CO₂ (in PPM) ,temperature and humidity using sensors at an interval of a minute it then uploads the data to a google spreadsheet through IoT integration.
This data is also displayed live on an 0.96 inch OLED screen which also features an opening intro. The data uploaded is later analyzed, and I plot graphs like CO₂ vs time in a closed room to establish trends and later calculate key metrics such as the decay constant, Air Changes per Hour (ACH), and the half-life of CO₂.
How I built it
I began by researching how CO₂ accumulation affects human health. Before ordering the physical parts and making the model, I created a component diagram and even a 3-D model. The ESP32 was programmed in C++ to display an initial screen on an OLED and, more importantly, to show real-time CO₂ readings. The ESP32 microcontroller was then connected to the MH-Z19C CO₂ sensor and programmed to record CO₂ concentration levels over time. Using IoT integration, the ESP32 transmitted the recorded data to a Google Spreadsheet where it could be logged automatically for analysis. After collecting data from multiple classroom sessions, I analyzed the trends occurring, plotted graphs based on said trends then calculated the decay rate, ACH and half life of CO₂ .
The CO₂ decay was modeled using the exponential decay equation:
$$ C(t) - C_{out} = (C_0 - C_{out})e^{-kt} $$
Using the decay constant (k), the ventilation rate was calculated as: $$ ACH = 60k $$
The rate at which CO₂ levels reduce was further analyzed using the half-life formula:
$$ t_{1/2} = \frac{\ln 2}{k} $$
Challenges I ran into
Since this was my first time developing a full hardware and data-analysis project, learning the necessary tools and concepts required and took significant time and effort. Initially, I encountered coding issues such as errors in displaying sensor data on the OLED screen. There were also some wiring and integration challenges when connecting the sensor and microcontroller.
One particular problem I ran into was that the OLED screen was repeatedly getting stuck on the intro-screen, thankfully though through debugging, troubleshooting, and repeated testing, I was able to resolve these issues and successfully complete the system.
Accomplishments that I'm proud of
I'm proud that I pushed myself to learn completely new concepts and successfully build this project from scratch. What started as just an idea in a classroom turned into a fully working system.
I’m also proud that the model doesn’t just function technically, but actually serves a real purpose. It can be used to analyze classroom ventilation and potentially help the school make informed decisions, such as planning ventilation schedules based on real data rather than assumptions.
What I learned
Through this project, I learned a wide range of skills across both hardware and software. I gained hands-on experience working with microcontrollers like the ESP32 and sensors such as the MH-Z19C and DHT-22.
I also learned the basics of C++ programming and how IoT systems can transmit real-time data to cloud platforms. Beyond the technical side, I learned how to approach and carry out an experimental study, starting from forming a hypothesis, collecting data in a structured way, and then analyzing it to draw meaningful conclusions.
This project also helped me understand how to work with real-world data, identify patterns through graphs like CO₂ vs time, and apply mathematical models to evaluate ventilation performance.
What's next for the S.V.O.E
This project can be expanded further to make it more intelligent and scalable.
Machine learning algorithms can be integrated to predict CO₂ concentration based on factors such as occupancy, time of day, and ventilation conditions, enabling more intelligent and energy-efficient control systems.
Additionally, a mobile or web-based interface can be developed for real-time monitoring, data visualization, alerts, and remote access to indoor air-quality conditions.
In the future, the system could be even deployed across multiple classrooms or buildings to create a larger network for monitoring and recording the environmental data.


Log in or sign up for Devpost to join the conversation.