-
-

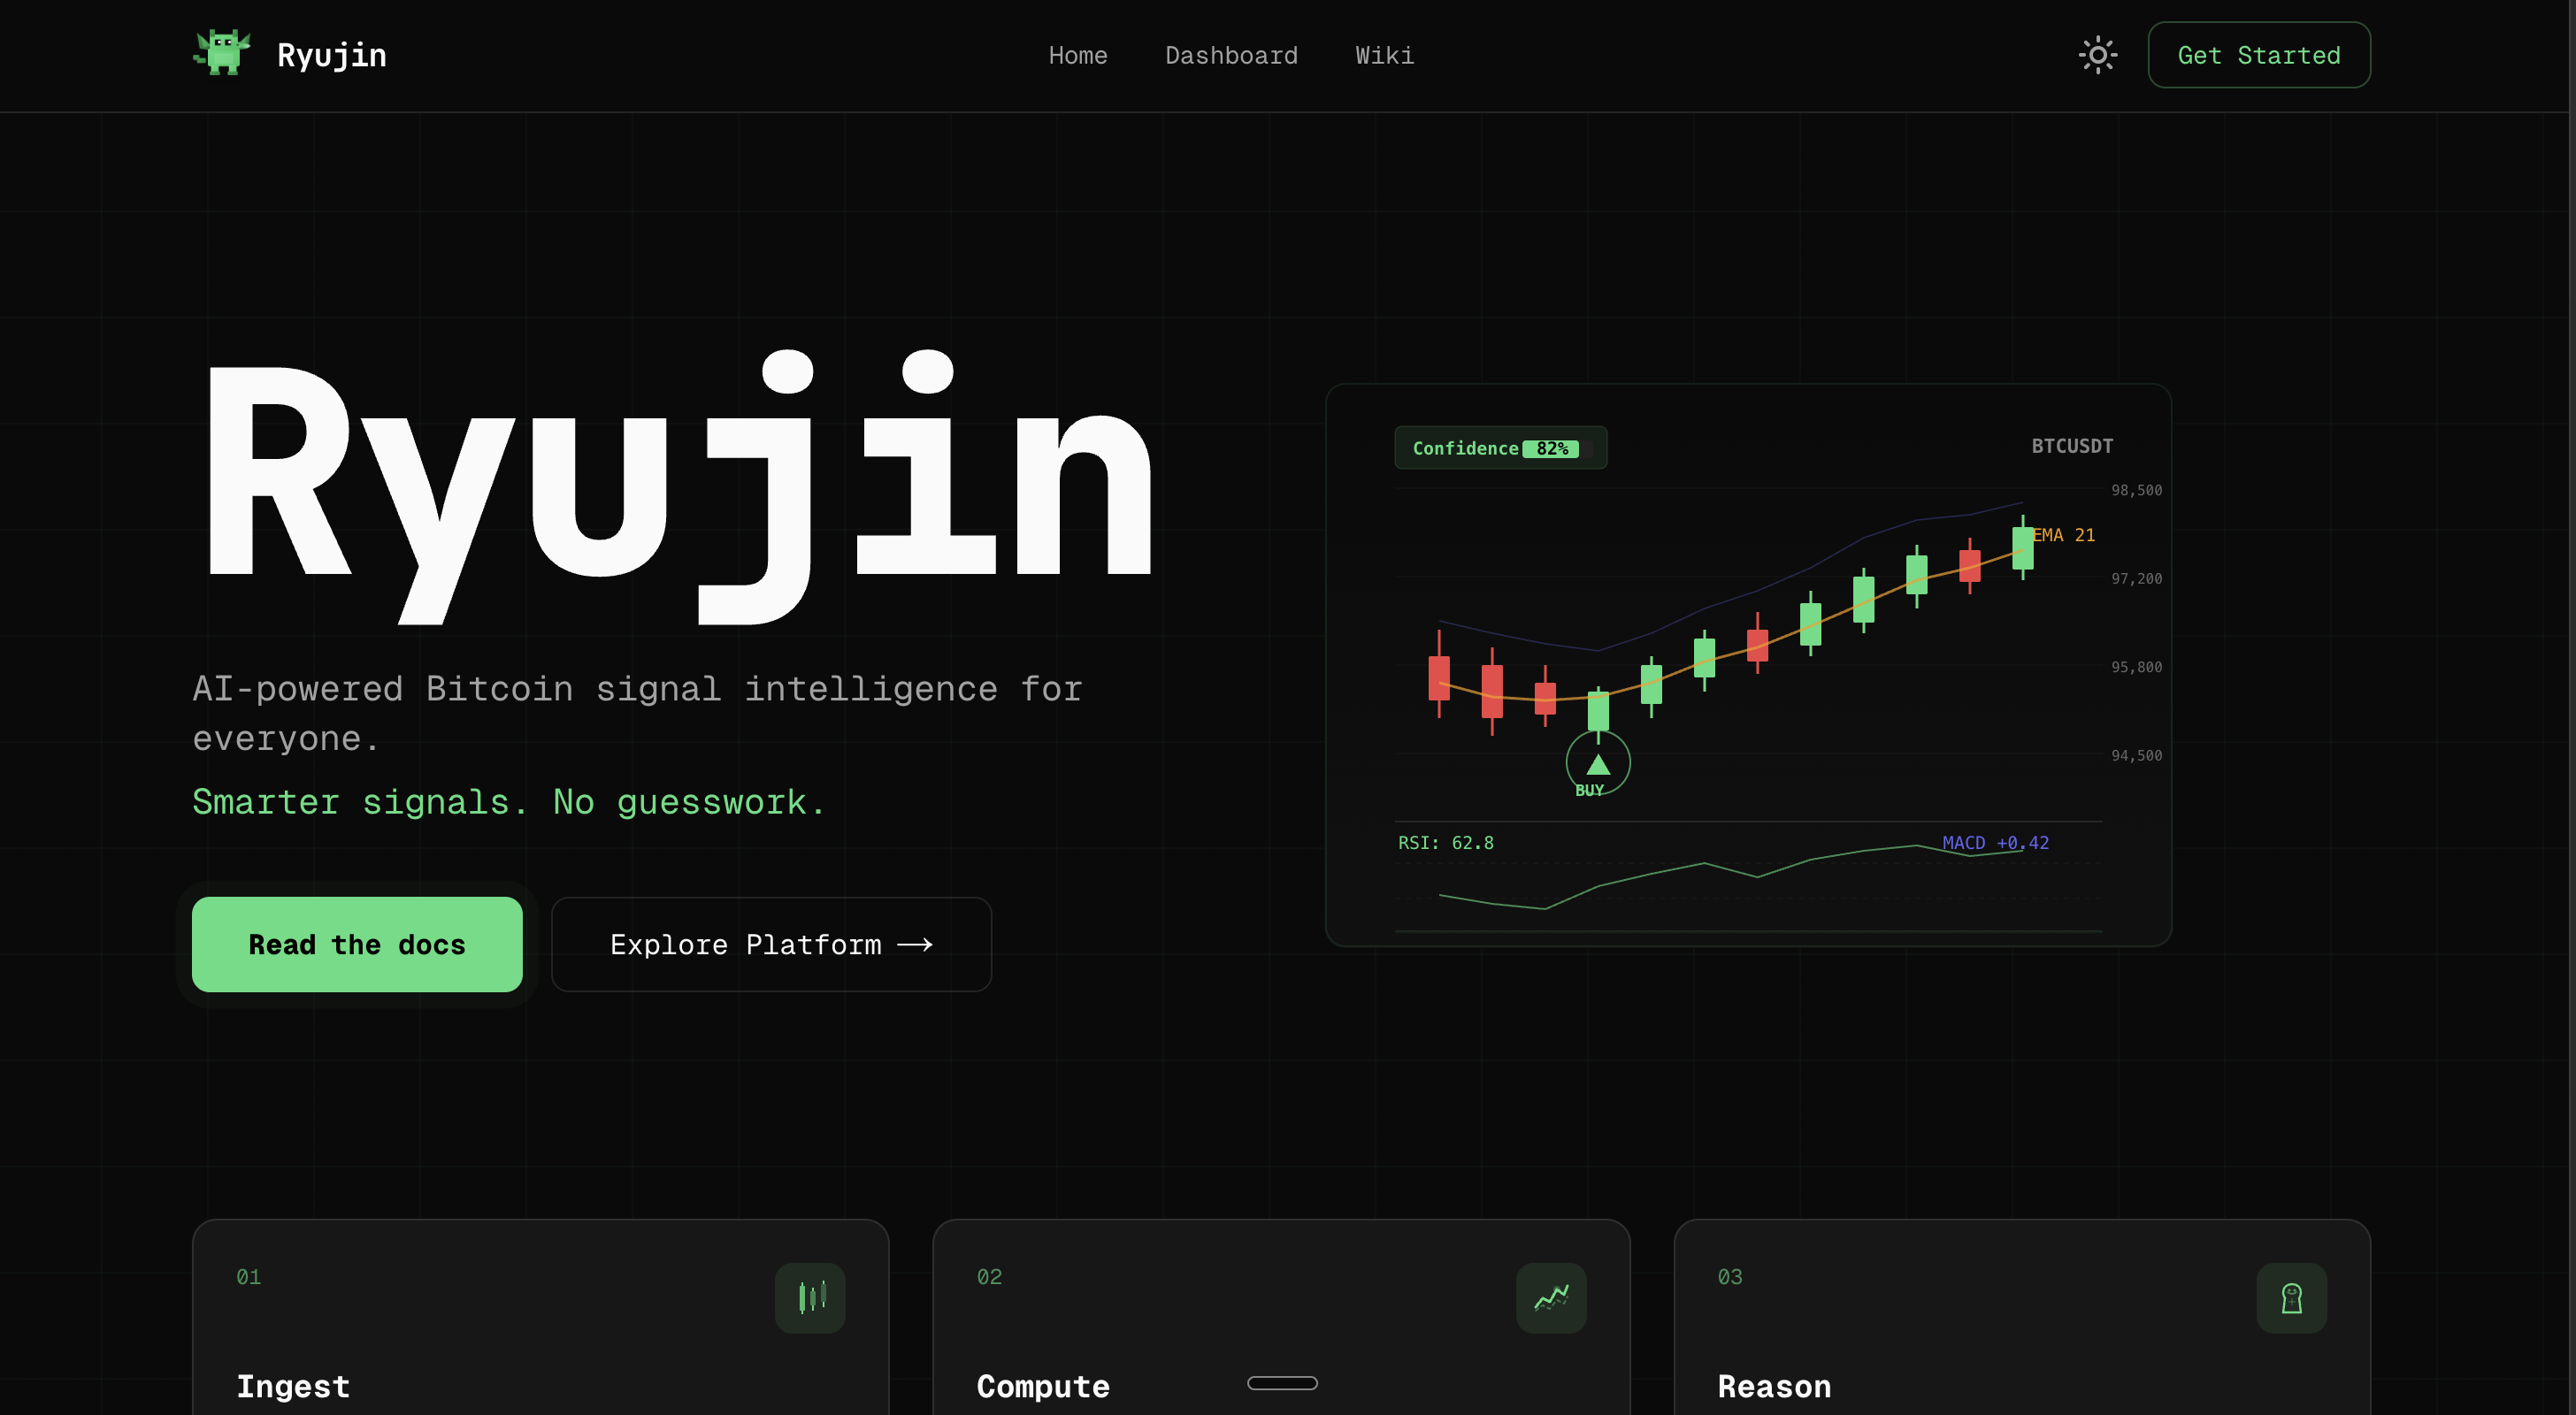
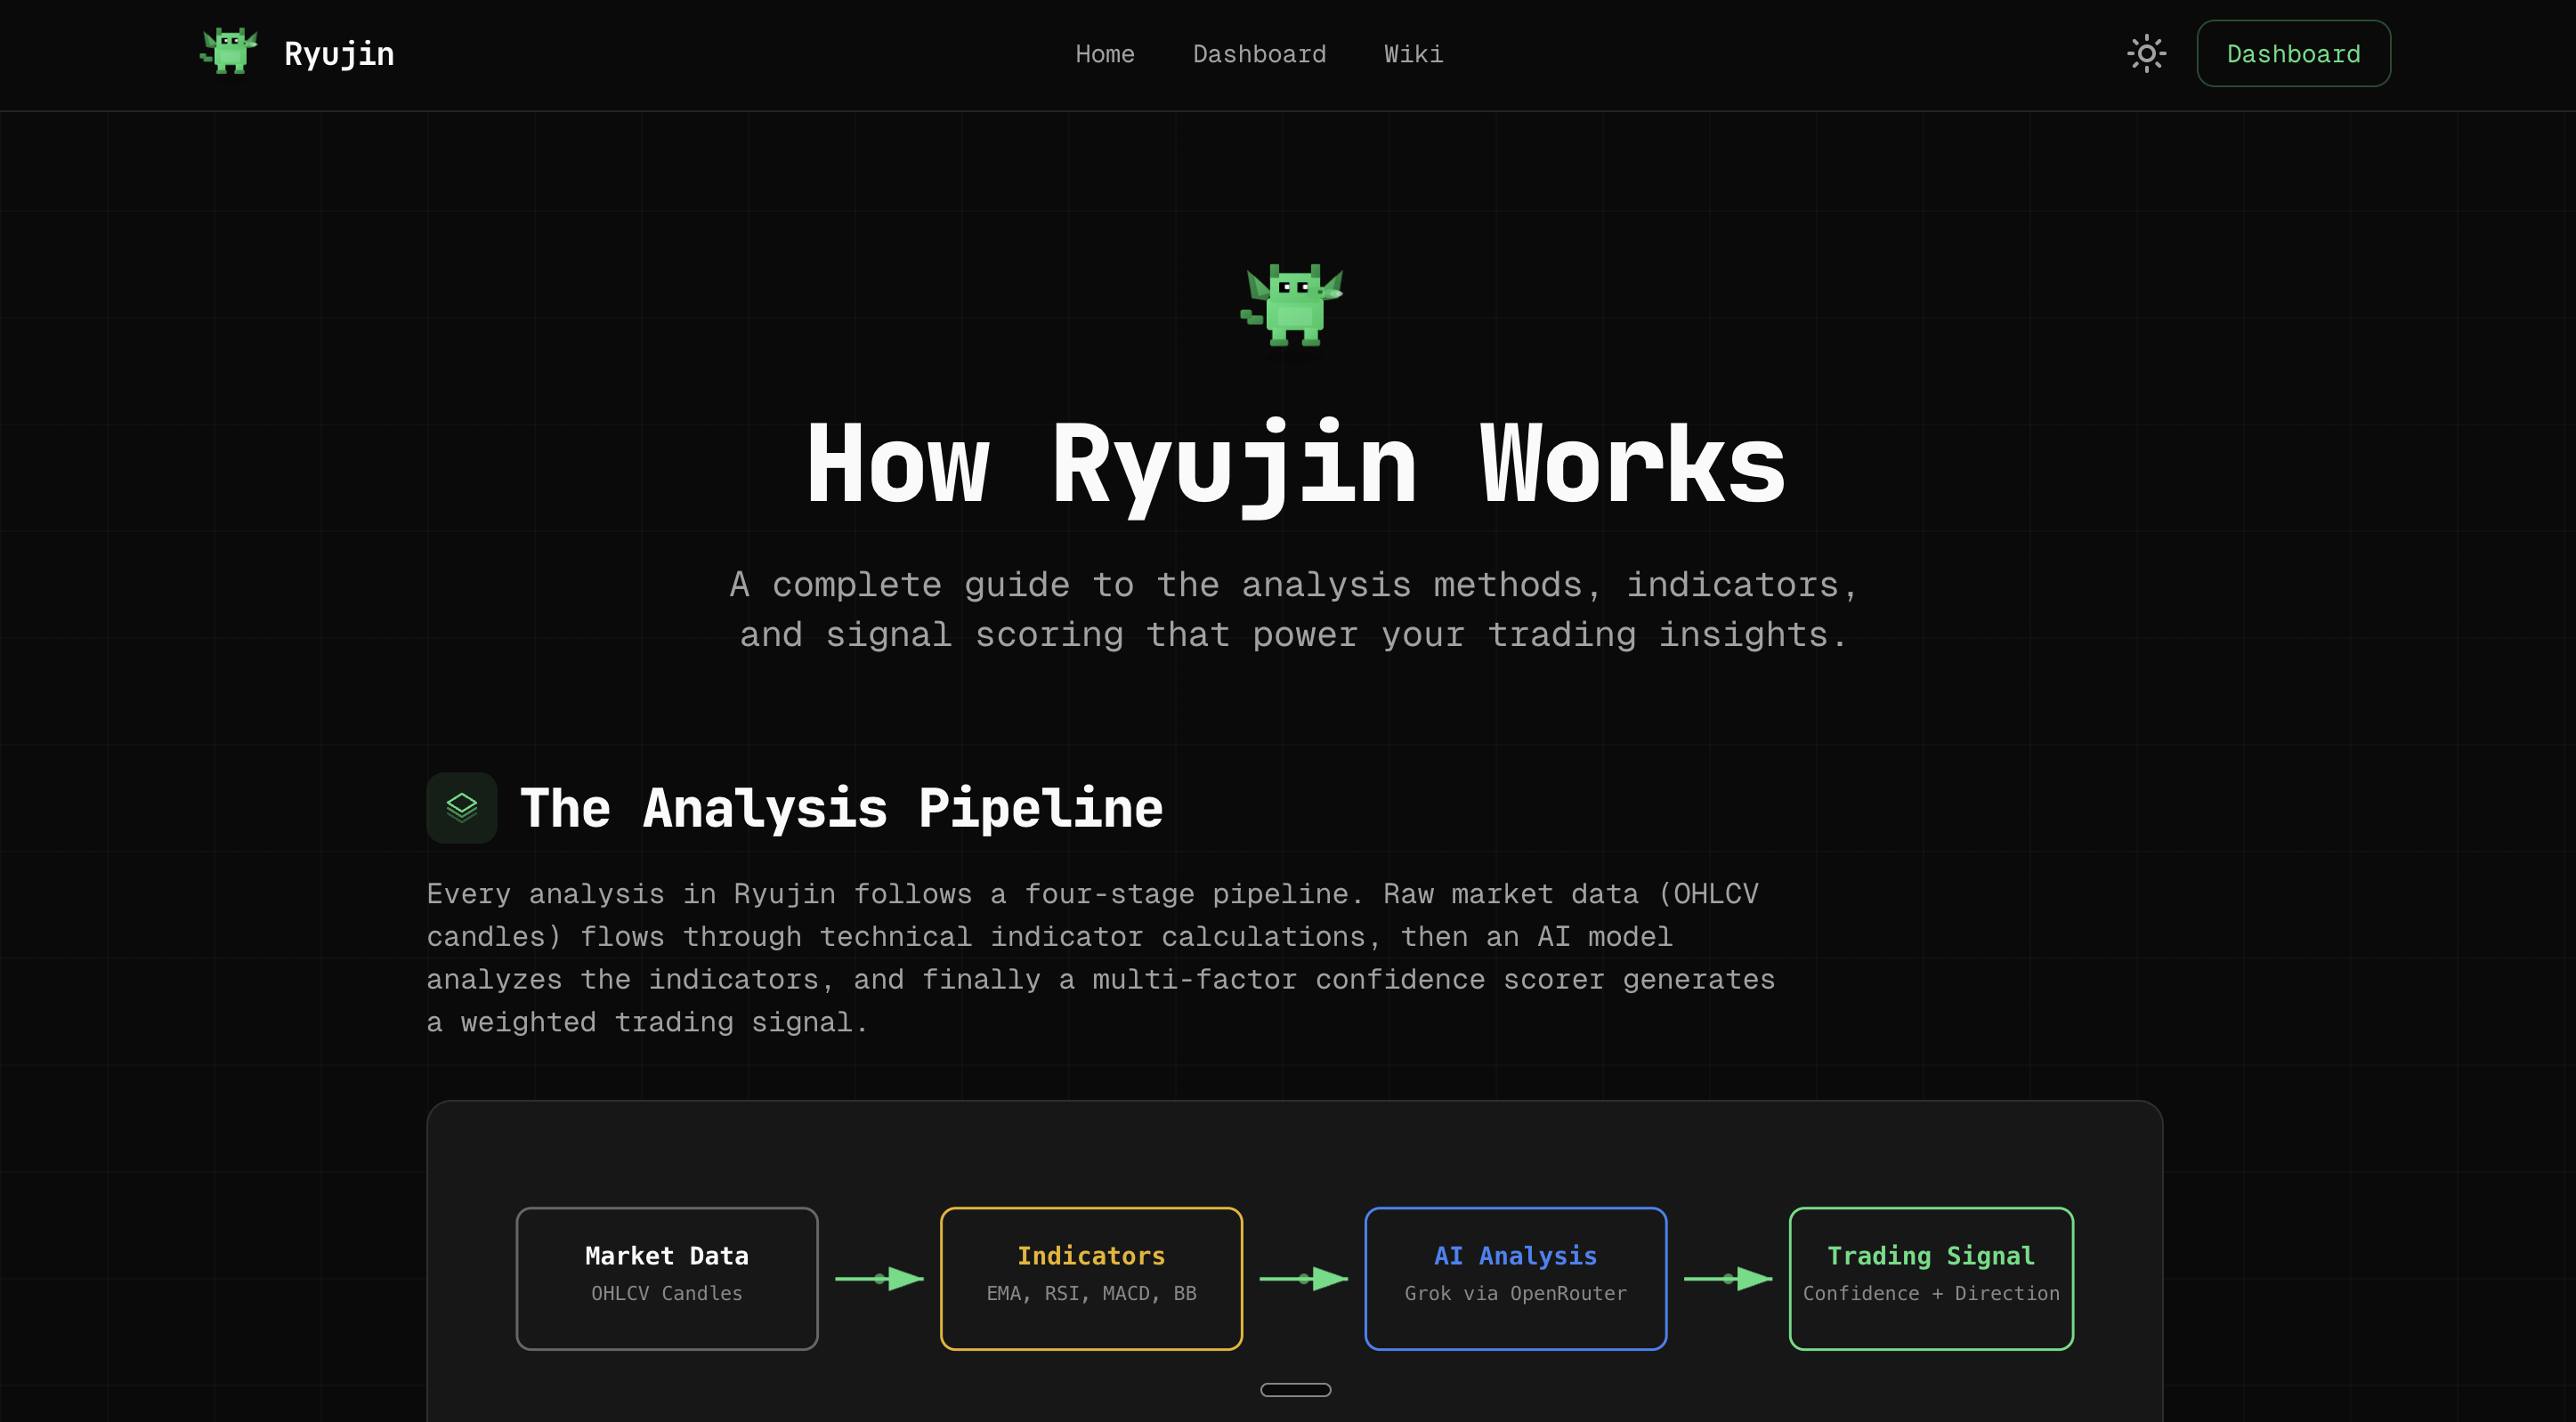
Landing page
-
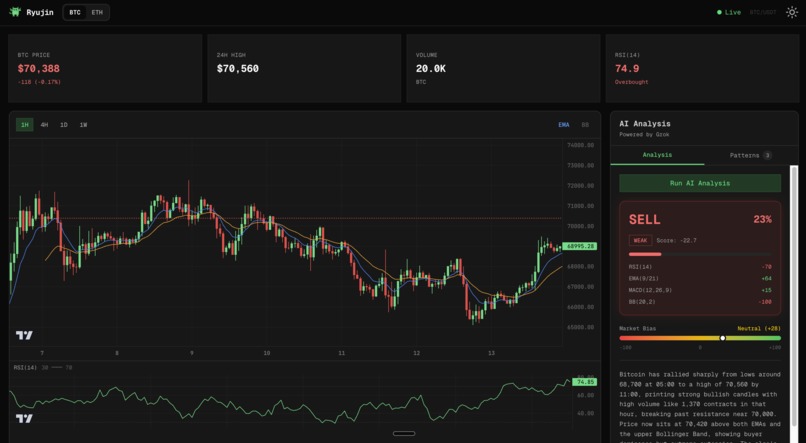
The actual interface/real-time dashboard
-
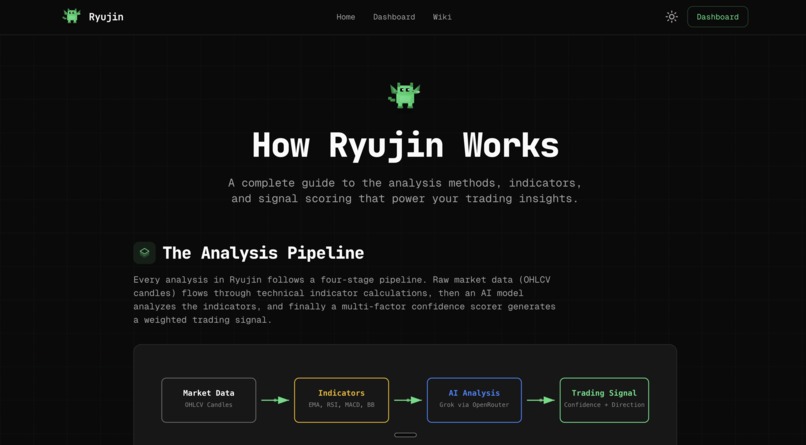
Wiki to explain the technicals behind the project
-
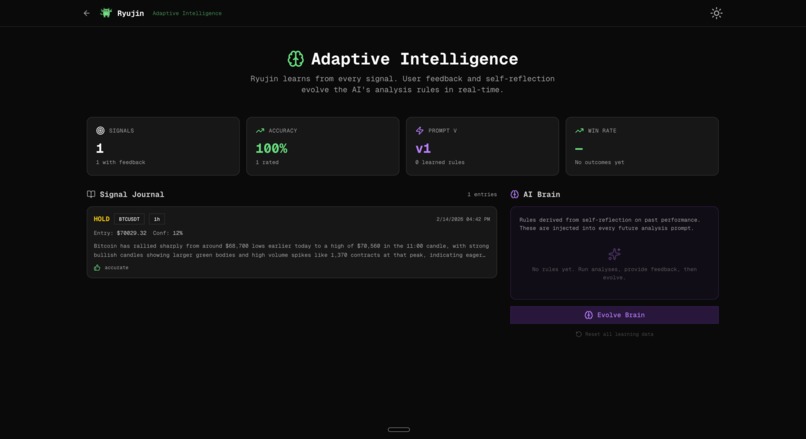
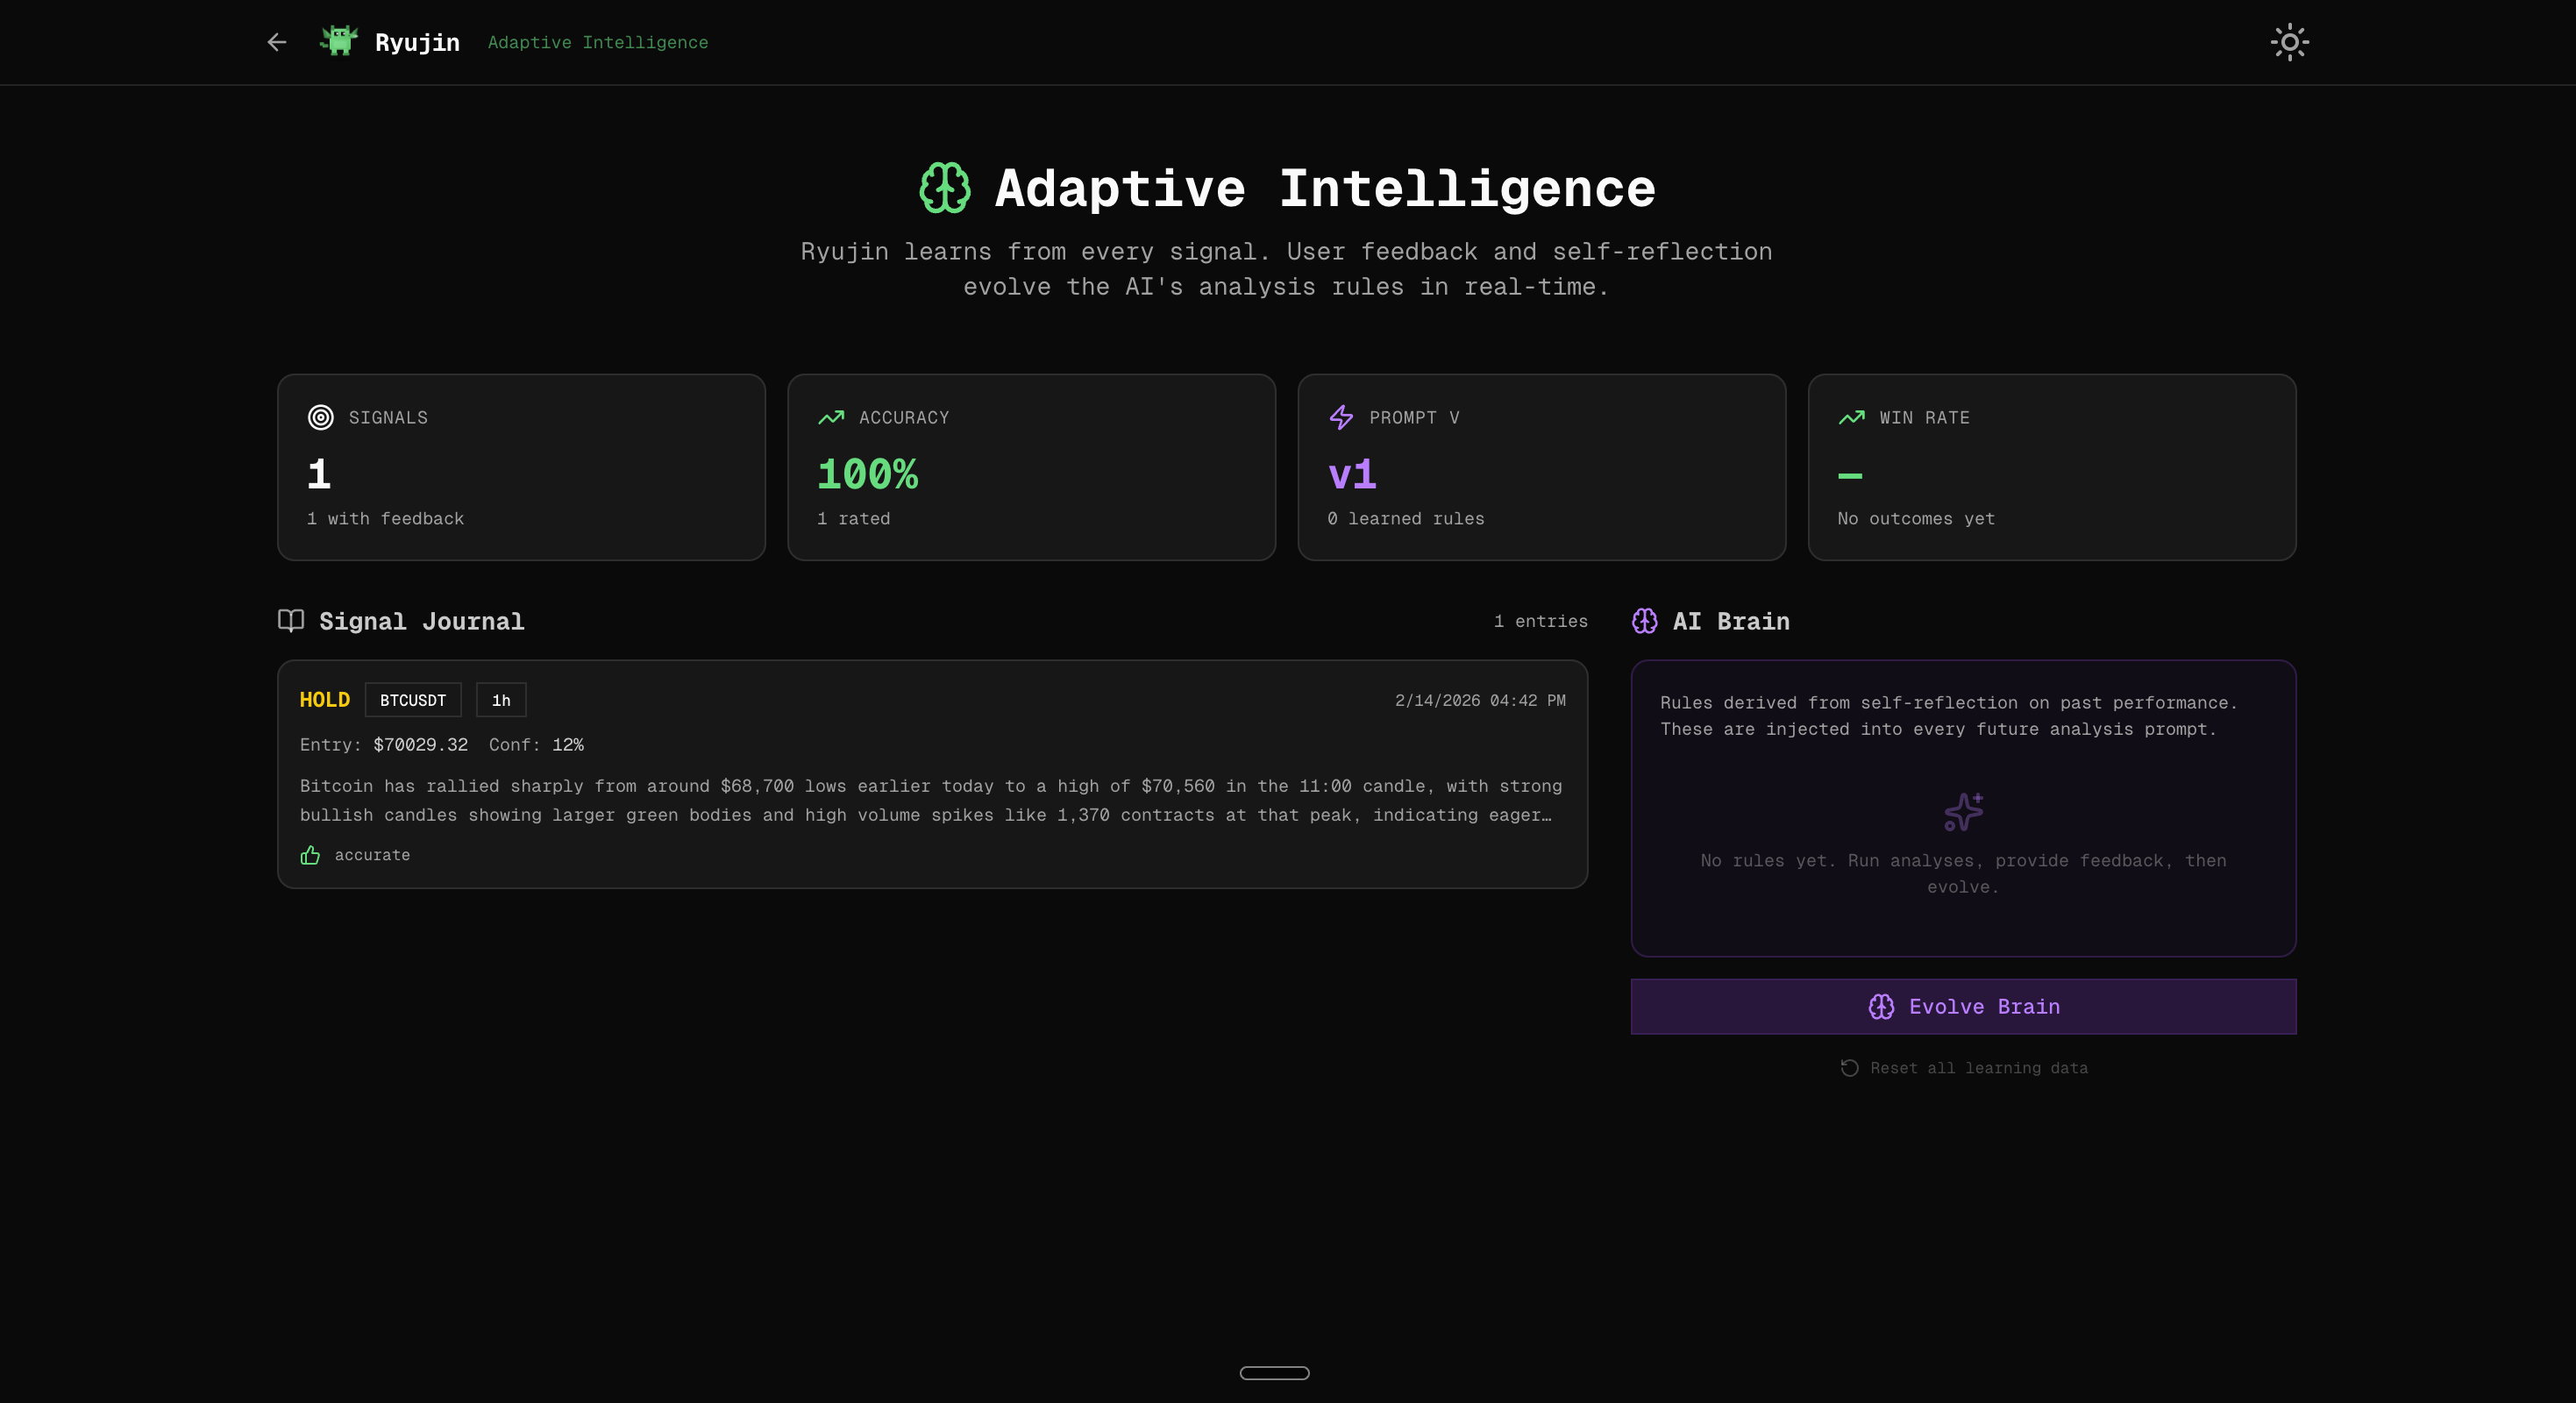
Self-learning skills page

Inspiration
What it does
How we built it
⏺ Inspiration We wanted to bridge the gap between raw technical analysis and actual understanding. Most trading tools throw charts and numbers at you — RSI is 32, MACD crossed, Bollinger squeezed — but never explain what that means or why it matters. We thought: what if an AI could look at the same data a trader sees and explain it like a mentor sitting next to you? And what if it got smarter every time you told it whether its advice was useful?
What it does?
Ryujin streams live crypto prices from Binance, computes four battle-tested technical indicators (RSI, EMA, MACD, Bollinger Bands) and detects 11 classical chart patterns — all in the browser with zero server cost. It scores everything into a single BUY/SELL/HOLD signal, then sends the data to an AI (Grok 4.1 via OpenRouter) that explains the market conditions in plain English. The key differentiator: Ryujin learns from your feedback. Every thumbs-up or thumbs-down gets logged, and a self-reflection loop evolves the AI's analysis rules over time — so its explanations get more aligned with your trading style the more you use it.
How we built it?
- Next.js 16 + TypeScript for the full-stack framework with App Router
- Binance REST + WebSocket for real-time OHLCV data (no API key needed)
- Pure TypeScript functions for all indicator math — stateless, testable, runs entirely client-side
- TradingView lightweight-charts v5 for professional-grade candlestick charting with synced RSI sub-charts
- OpenRouter SDK connecting to Grok 4.1 Fast for structured JSON AI responses
- localStorage-based learning store that journals every signal, tracks outcomes via P&L, and stores evolved rules
- Tailwind CSS 4 + shadcn/ui for the UI, with a View Transition API theme toggle and CSS-only animations
- A custom swing-point algorithm for detecting patterns like Double Tops, Head & Shoulders, and Cup & Handle
Challenges we ran into?
- lightweight-charts v5 breaking changes — the v4 API (addCandlestickSeries) was completely removed, and documentation was sparse. We had to dig into the source to find the new addSeries(CandlestickSeries, opts) pattern.
- OpenRouter SDK surface — the SDK doesn't follow the OpenAI-style chat.completions.create() convention. It uses its own chat.send({ chatGenerationParams }) method with camelCase params, which took trial and error to discover.
- MACD cold-start — you need at least 34 candles (26 for the slow EMA + 9 for the signal line) before MACD produces valid output. Handling this gracefully without showing broken data required careful null-checking throughout the pipeline.
- WebSocket reliability — Binance drops connections every 24 hours by policy. We implemented exponential backoff (1s → 30s max) and had to handle the edge case of in-progress candles vs. closed candles correctly to avoid duplicate or missing data.
- LLM JSON consistency — models sometimes wrap JSON responses in markdown code fences (```json). We had to add a stripping layer before parsing.
Accomplishments that we're proud of:
- Zero server cost for the core pipeline — all indicator math, pattern detection, and signal scoring runs in the browser. The only server call is the on-demand AI analysis.
- The self-learning loop actually works — after a few feedback cycles, the evolved rules noticeably change the AI's analysis tone and focus areas, making it feel personalized.
- 11 chart patterns detected client-side — with animated SVG visualizations for each pattern type, making them educational, not just labels.
- The View Transition API theme toggle — a smooth circular clip-path reveal that radiates from the toggle button. A small detail, but it makes the app feel polished.
- Clean architecture — every indicator is a pure function, the data flow is strictly unidirectional, and the entire type system is defined in one file. Adding a new indicator takes about 15 minutes.
What we learned?
- Prompt engineering is product design — the way you structure data for the LLM (tables vs. prose, what context to include, what tone to request) has more impact on output quality than which model you pick.
- Client-side computation is underrated — we expected performance issues computing indicators on 300 candles per update, but it takes < 1ms. The real bottleneck is always the network, not the math.
- Feedback loops need friction reduction — the learning system only works if users actually give feedback. Making it a single click (thumbs up/down) right next to the analysis was critical for adoption.
- Technical indicators are just opinions in math form — building them from scratch taught us that RSI, MACD, and Bollinger Bands are all just different ways of asking "is this price normal?" There's no magic, just well-chosen formulas.
What's next for Ryujin?
- Multi-timeframe analysis — showing 1H, 4H, and 1D signals side by side so you can see if short-term and long-term trends agree
- Alert system — push notifications when the signal changes direction or confidence crosses a threshold
- Backtesting mode — replay historical data to see how Ryujin's signals would have performed over the past weeks/months
- Custom indicator builder — let users define their own indicators through a visual formula editor
- Community-shared learned rules — export and import evolved rule sets so traders can share what works
- More trading pairs — expand beyond BTC and ETH to SOL, XRP, and other major assets
Built With
- ai
- amazon-web-services
- binance
- nextjs
- openrouter
- typescript
- websockets

Log in or sign up for Devpost to join the conversation.